Water pollution is one of the most serious environmental problems in Malaysia. The most notable occurrence of pollution happened in Selangor. Currently, there are various water quality monitoring (WQM) methods to observe the quality of water. One of the methods used is the internet of things (IoT) for wireless sensor network technology to obtain real-time data measurement. In this study, the developed WQM system is equipped with a sensor that can measure total dissolved solid (TDS) and electrical conductivity (EC). Arduino UNO was used in this system as a microcontroller to interact with the sensor. The Wi-Fi module, ESP8266, was used to transfer the collected data to ThingSpeak, which acts as a cloud to store all the data. The results showed that both sample populations can be discriminated since the p-value is greater than 0.05 in the normality test, while in the paired sample t-test, the p-value is less than 0.05. In conclusion, this research provides an easier way to monitor water quality by taking up less time at less cost, as well as being reliable in giving real-time data reading.
Web based Water Turbidity Monitoring and Automated Filtration System: IoT App...IJECEIAES
Water supplied to residential areas is prone to contaminants due to pipe residues and silt, and therefore resulted in cloudiness, unfavorable taste, and odor in water. Turbidity, a measure of water cloudiness, is one of the important factors for assessing water quality. This paper proposes a low-cost turbidity system based on a light detection unit to measure the cloudiness in water. The automated system uses Intel Galileo 2 as the microprocessor and a server for a web-based monitoring system. The turbidity detection unit consists of a Light Dependent Resistor (LDR) and a Light Emitting Diode (LED) inside a polyvinyl chloride (PVC) pipe. Turbidity readings were recorded for two different positionings; 90° and 180° between the detector (LDR) and the incident light (LED). Once the turbidity level reached a threshold level, the system will trigger the filtration process to clean the water. The voltage output captured from the designed system versus total suspended solid (TSS) in sample water is graphed and analyzed in two different conditions; in total darkness and in the present of ambient light. This paper also discusses and compares the results from the above-mentioned conditions when the system is submerged in still and flowing water. It was found that the trends of the plotted graph decline when the total suspended solid increased for both 90° and 180° detector turbidimeter in all conditions which imitate the trends of a commercial turbidimeter. By taking the consideration of the above findings, the design can be recommended for a low-cost real-time web-based monitoring system of the water quality in an IOT environment.
Water monitoring and analytic based ThingSpeak IJECEIAES
Diseases associated with bad water have largely reported cases annually leading to deaths, therefore the water quality monitoring become necessary to provide safe water. Traditional monitoring includes manual gathering of samples from different points on the distributed site, and then testing in laboratory. This procedure has proven that it is ineffective because it is laborious, lag time and lacks online results to enhance proactive response to water pollution. Emergence of the Internet of Things (IoT) and step towards the smart life poses the successful using of IoT. This paper presents a water quality monitoring using IoT based ThingSpeak platform that provides analytic tools and visualization using MATLAB programming. The proposed model is used to test water samples using sensor fusion technique such as TDS and Turbidity, and then uploading data online to ThingSpeak platform to monitor and analyze. The system notifies authorities when there are water quality parameters out of a predefined set of normal values. A warning will be notified to user by IFTTT protocol.
Evaluating IoT based passive water catchment monitoring system data acquisiti...journalBEEI
Water quality is the main aspect to determine the quality of aquatic systems. Poor water quality will pose a health risk for people and ecosystems. The old methods such as collecting samples of water manually and testing and analysing at lab will cause the time consuming, wastage of man power and not economical. A system is needed to provide a real-time data for environmental protection and tracking pollution sources. This paper aims to describe on how to monitor water quality continuously through IoT platform. Water Quality Catchment Monitoring System was introduced to check and monitor water quality continuously. It’s features five sensors which are temperature sensor, light intensity sensor, pH sensor, GPS tracker and Inertia Movement Unit (IMU). IMU is a new feature in the system where the direction of x and y is determined for planning and find out where a water quality problem exists by determining the flow of water. The system uses an internet wireless connection using the ESP8266 Wi-Fi Shield Module as a connection between Arduino Mega2560 and laptop. ThingSpeak application acts as an IoT platform used for real-time data monitoring.
Design of Flood Warning System Based IoT and Water CharacteristicsTELKOMNIKA JOURNAL
Indonesia is one of the tropical country with high rainfall. It causes a flood disaster that with the loss of property and life. Currently handling flood disasters in developing countries are still using many conventional ways. By using conventional way the flood early warning system is still not able to reach the wider community so that information too late of impending disaster received by the public. Besides that the speed of information is needed in the handling of disasters. Therefore a rapid flood warning system that can reach a wide area such as the internet is necessary to minimize the effects of disasters. IoT (Internet of Thing) is smart technology which has capability to send data in real time, connected to the smart phone, sensor and web service. This ability can be used for smart application to control and manage an early warning system. In this research we also use IoT technology to monitor and control the early detection system of flood disaster. By using IoT technology, sensor data can be sent in real time from sensor to smartphone through internet network. The sensor data contains the water characteristics data on the dam that will be processed in the data base. The processing data of water characteristic will be a decision of hazard level. That decision will be sent to users as notification into the user smartphone application. This research will be useful for deeply research on disaster management system and flood early detection system in Indonesia.
Capacitive electrode sensor implanted on a printed circuit board designed for...journalBEEI
Water level sensors are one of the practical ways to get the actual measurement of the depth of a dam or canal. The ease of deployment and easy data acquisition makes them widely used in many fields. Therefore, it will be advantageous to have a miniaturized water level sensor for easier mobility and deployment. A novel method for measuring water level using a Printed Circuit Board has been proposed in this paper. The design stages of circuit sketching, printing of sketch on PCB and etching are discussed for the electrode water level sensor. A signal conditioning circuit is necessary to maintain a steady flow of current from the power source. The fabricated electrode water level sensor was tested based on its capacitive effect while charging up and the amount of current at each electrode finger at the saturation stage. The hardware enablers for this test were the multimeter and LCR meter. Arduino microprocessor was used to test and measure the transient response time for each electrode finger. The transient response sensitivity of the electrode sensor is measured to be 0.0873 millisecond/cm while the resolution of the electrode sensor is 0.1cm over a range of 30cm water level. A multiple correlation of 0.921 was achieved for the water level, measured current and measured capacitance with P-values less than 0.05 indicating strength of the data obtained from the tests conducted. The result showed strong evidence that the electrode water level sensor can be an alternative method of measuring water level.
International Journal of Engineering Research and Applications (IJERA) is an open access online peer reviewed international journal that publishes research and review articles in the fields of Computer Science, Neural Networks, Electrical Engineering, Software Engineering, Information Technology, Mechanical Engineering, Chemical Engineering, Plastic Engineering, Food Technology, Textile Engineering, Nano Technology & science, Power Electronics, Electronics & Communication Engineering, Computational mathematics, Image processing, Civil Engineering, Structural Engineering, Environmental Engineering, VLSI Testing & Low Power VLSI Design etc.
Intelligent Water Leakage Controller using Raspberry PIijtsrd
In water supply network system, the major problem is water leakage. This system contains two sections, first part is leakage detection and automatically closes the solenoid valve to prevent the over leakage of water at the time it will send SMS to the corporation using GSM module which is according to sensor information. GPS location is used to detect where the leakage takes place. A prototype of suggested system was implemented and tested with various scenarios and the results are presented in this paper. Water source management is one of the key goal, so any country in the world of water requirement is increasing presently involving automation is such systems will reduce human errors and will increase the efficiency and thus decreasing the supply demand gap. R. Karthick | R. T Ajaykarthik | D. R. P Rajarathnam | M. Malarmohanraj | M. Prakash | S. Sivakumar "Intelligent Water Leakage Controller using Raspberry PI" Published in International Journal of Trend in Scientific Research and Development (ijtsrd), ISSN: 2456-6470, Volume-6 | Issue-4 , June 2022, URL: https://www.ijtsrd.com/papers/ijtsrd50280.pdf Paper URL: https://www.ijtsrd.com/engineering/mechanical-engineering/50280/intelligent-water-leakage-controller-using-raspberry-pi/r-karthick
Bibliometric analysis highlighting the role of women in addressing climate ch...IJECEIAES
Fossil fuel consumption increased quickly, contributing to climate change
that is evident in unusual flooding and draughts, and global warming. Over
the past ten years, women's involvement in society has grown dramatically,
and they succeeded in playing a noticeable role in reducing climate change.
A bibliometric analysis of data from the last ten years has been carried out to
examine the role of women in addressing the climate change. The analysis's
findings discussed the relevant to the sustainable development goals (SDGs),
particularly SDG 7 and SDG 13. The results considered contributions made
by women in the various sectors while taking geographic dispersion into
account. The bibliometric analysis delves into topics including women's
leadership in environmental groups, their involvement in policymaking, their
contributions to sustainable development projects, and the influence of
gender diversity on attempts to mitigate climate change. This study's results
highlight how women have influenced policies and actions related to climate
change, point out areas of research deficiency and recommendations on how
to increase role of the women in addressing the climate change and
achieving sustainability. To achieve more successful results, this initiative
aims to highlight the significance of gender equality and encourage
inclusivity in climate change decision-making processes.
Voltage and frequency control of microgrid in presence of micro-turbine inter...IJECEIAES
The active and reactive load changes have a significant impact on voltage
and frequency. In this paper, in order to stabilize the microgrid (MG) against
load variations in islanding mode, the active and reactive power of all
distributed generators (DGs), including energy storage (battery), diesel
generator, and micro-turbine, are controlled. The micro-turbine generator is
connected to MG through a three-phase to three-phase matrix converter, and
the droop control method is applied for controlling the voltage and
frequency of MG. In addition, a method is introduced for voltage and
frequency control of micro-turbines in the transition state from gridconnected mode to islanding mode. A novel switching strategy of the matrix
converter is used for converting the high-frequency output voltage of the
micro-turbine to the grid-side frequency of the utility system. Moreover,
using the switching strategy, the low-order harmonics in the output current
and voltage are not produced, and consequently, the size of the output filter
would be reduced. In fact, the suggested control strategy is load-independent
and has no frequency conversion restrictions. The proposed approach for
voltage and frequency regulation demonstrates exceptional performance and
favorable response across various load alteration scenarios. The suggested
strategy is examined in several scenarios in the MG test systems, and the
simulation results are addressed.
More Related Content
Similar to Variance of total dissolved solids and electrical conductivity for water quality in Sabak Bernam
Design of Flood Warning System Based IoT and Water CharacteristicsTELKOMNIKA JOURNAL
Indonesia is one of the tropical country with high rainfall. It causes a flood disaster that with the loss of property and life. Currently handling flood disasters in developing countries are still using many conventional ways. By using conventional way the flood early warning system is still not able to reach the wider community so that information too late of impending disaster received by the public. Besides that the speed of information is needed in the handling of disasters. Therefore a rapid flood warning system that can reach a wide area such as the internet is necessary to minimize the effects of disasters. IoT (Internet of Thing) is smart technology which has capability to send data in real time, connected to the smart phone, sensor and web service. This ability can be used for smart application to control and manage an early warning system. In this research we also use IoT technology to monitor and control the early detection system of flood disaster. By using IoT technology, sensor data can be sent in real time from sensor to smartphone through internet network. The sensor data contains the water characteristics data on the dam that will be processed in the data base. The processing data of water characteristic will be a decision of hazard level. That decision will be sent to users as notification into the user smartphone application. This research will be useful for deeply research on disaster management system and flood early detection system in Indonesia.
Capacitive electrode sensor implanted on a printed circuit board designed for...journalBEEI
Water level sensors are one of the practical ways to get the actual measurement of the depth of a dam or canal. The ease of deployment and easy data acquisition makes them widely used in many fields. Therefore, it will be advantageous to have a miniaturized water level sensor for easier mobility and deployment. A novel method for measuring water level using a Printed Circuit Board has been proposed in this paper. The design stages of circuit sketching, printing of sketch on PCB and etching are discussed for the electrode water level sensor. A signal conditioning circuit is necessary to maintain a steady flow of current from the power source. The fabricated electrode water level sensor was tested based on its capacitive effect while charging up and the amount of current at each electrode finger at the saturation stage. The hardware enablers for this test were the multimeter and LCR meter. Arduino microprocessor was used to test and measure the transient response time for each electrode finger. The transient response sensitivity of the electrode sensor is measured to be 0.0873 millisecond/cm while the resolution of the electrode sensor is 0.1cm over a range of 30cm water level. A multiple correlation of 0.921 was achieved for the water level, measured current and measured capacitance with P-values less than 0.05 indicating strength of the data obtained from the tests conducted. The result showed strong evidence that the electrode water level sensor can be an alternative method of measuring water level.
International Journal of Engineering Research and Applications (IJERA) is an open access online peer reviewed international journal that publishes research and review articles in the fields of Computer Science, Neural Networks, Electrical Engineering, Software Engineering, Information Technology, Mechanical Engineering, Chemical Engineering, Plastic Engineering, Food Technology, Textile Engineering, Nano Technology & science, Power Electronics, Electronics & Communication Engineering, Computational mathematics, Image processing, Civil Engineering, Structural Engineering, Environmental Engineering, VLSI Testing & Low Power VLSI Design etc.
Intelligent Water Leakage Controller using Raspberry PIijtsrd
In water supply network system, the major problem is water leakage. This system contains two sections, first part is leakage detection and automatically closes the solenoid valve to prevent the over leakage of water at the time it will send SMS to the corporation using GSM module which is according to sensor information. GPS location is used to detect where the leakage takes place. A prototype of suggested system was implemented and tested with various scenarios and the results are presented in this paper. Water source management is one of the key goal, so any country in the world of water requirement is increasing presently involving automation is such systems will reduce human errors and will increase the efficiency and thus decreasing the supply demand gap. R. Karthick | R. T Ajaykarthik | D. R. P Rajarathnam | M. Malarmohanraj | M. Prakash | S. Sivakumar "Intelligent Water Leakage Controller using Raspberry PI" Published in International Journal of Trend in Scientific Research and Development (ijtsrd), ISSN: 2456-6470, Volume-6 | Issue-4 , June 2022, URL: https://www.ijtsrd.com/papers/ijtsrd50280.pdf Paper URL: https://www.ijtsrd.com/engineering/mechanical-engineering/50280/intelligent-water-leakage-controller-using-raspberry-pi/r-karthick
Bibliometric analysis highlighting the role of women in addressing climate ch...IJECEIAES
Fossil fuel consumption increased quickly, contributing to climate change
that is evident in unusual flooding and draughts, and global warming. Over
the past ten years, women's involvement in society has grown dramatically,
and they succeeded in playing a noticeable role in reducing climate change.
A bibliometric analysis of data from the last ten years has been carried out to
examine the role of women in addressing the climate change. The analysis's
findings discussed the relevant to the sustainable development goals (SDGs),
particularly SDG 7 and SDG 13. The results considered contributions made
by women in the various sectors while taking geographic dispersion into
account. The bibliometric analysis delves into topics including women's
leadership in environmental groups, their involvement in policymaking, their
contributions to sustainable development projects, and the influence of
gender diversity on attempts to mitigate climate change. This study's results
highlight how women have influenced policies and actions related to climate
change, point out areas of research deficiency and recommendations on how
to increase role of the women in addressing the climate change and
achieving sustainability. To achieve more successful results, this initiative
aims to highlight the significance of gender equality and encourage
inclusivity in climate change decision-making processes.
Voltage and frequency control of microgrid in presence of micro-turbine inter...IJECEIAES
The active and reactive load changes have a significant impact on voltage
and frequency. In this paper, in order to stabilize the microgrid (MG) against
load variations in islanding mode, the active and reactive power of all
distributed generators (DGs), including energy storage (battery), diesel
generator, and micro-turbine, are controlled. The micro-turbine generator is
connected to MG through a three-phase to three-phase matrix converter, and
the droop control method is applied for controlling the voltage and
frequency of MG. In addition, a method is introduced for voltage and
frequency control of micro-turbines in the transition state from gridconnected mode to islanding mode. A novel switching strategy of the matrix
converter is used for converting the high-frequency output voltage of the
micro-turbine to the grid-side frequency of the utility system. Moreover,
using the switching strategy, the low-order harmonics in the output current
and voltage are not produced, and consequently, the size of the output filter
would be reduced. In fact, the suggested control strategy is load-independent
and has no frequency conversion restrictions. The proposed approach for
voltage and frequency regulation demonstrates exceptional performance and
favorable response across various load alteration scenarios. The suggested
strategy is examined in several scenarios in the MG test systems, and the
simulation results are addressed.
Enhancing battery system identification: nonlinear autoregressive modeling fo...IJECEIAES
Precisely characterizing Li-ion batteries is essential for optimizing their
performance, enhancing safety, and prolonging their lifespan across various
applications, such as electric vehicles and renewable energy systems. This
article introduces an innovative nonlinear methodology for system
identification of a Li-ion battery, employing a nonlinear autoregressive with
exogenous inputs (NARX) model. The proposed approach integrates the
benefits of nonlinear modeling with the adaptability of the NARX structure,
facilitating a more comprehensive representation of the intricate
electrochemical processes within the battery. Experimental data collected
from a Li-ion battery operating under diverse scenarios are employed to
validate the effectiveness of the proposed methodology. The identified
NARX model exhibits superior accuracy in predicting the battery's behavior
compared to traditional linear models. This study underscores the
importance of accounting for nonlinearities in battery modeling, providing
insights into the intricate relationships between state-of-charge, voltage, and
current under dynamic conditions.
Smart grid deployment: from a bibliometric analysis to a surveyIJECEIAES
Smart grids are one of the last decades' innovations in electrical energy.
They bring relevant advantages compared to the traditional grid and
significant interest from the research community. Assessing the field's
evolution is essential to propose guidelines for facing new and future smart
grid challenges. In addition, knowing the main technologies involved in the
deployment of smart grids (SGs) is important to highlight possible
shortcomings that can be mitigated by developing new tools. This paper
contributes to the research trends mentioned above by focusing on two
objectives. First, a bibliometric analysis is presented to give an overview of
the current research level about smart grid deployment. Second, a survey of
the main technological approaches used for smart grid implementation and
their contributions are highlighted. To that effect, we searched the Web of
Science (WoS), and the Scopus databases. We obtained 5,663 documents
from WoS and 7,215 from Scopus on smart grid implementation or
deployment. With the extraction limitation in the Scopus database, 5,872 of
the 7,215 documents were extracted using a multi-step process. These two
datasets have been analyzed using a bibliometric tool called bibliometrix.
The main outputs are presented with some recommendations for future
research.
Use of analytical hierarchy process for selecting and prioritizing islanding ...IJECEIAES
One of the problems that are associated to power systems is islanding
condition, which must be rapidly and properly detected to prevent any
negative consequences on the system's protection, stability, and security.
This paper offers a thorough overview of several islanding detection
strategies, which are divided into two categories: classic approaches,
including local and remote approaches, and modern techniques, including
techniques based on signal processing and computational intelligence.
Additionally, each approach is compared and assessed based on several
factors, including implementation costs, non-detected zones, declining
power quality, and response times using the analytical hierarchy process
(AHP). The multi-criteria decision-making analysis shows that the overall
weight of passive methods (24.7%), active methods (7.8%), hybrid methods
(5.6%), remote methods (14.5%), signal processing-based methods (26.6%),
and computational intelligent-based methods (20.8%) based on the
comparison of all criteria together. Thus, it can be seen from the total weight
that hybrid approaches are the least suitable to be chosen, while signal
processing-based methods are the most appropriate islanding detection
method to be selected and implemented in power system with respect to the
aforementioned factors. Using Expert Choice software, the proposed
hierarchy model is studied and examined.
Enhancing of single-stage grid-connected photovoltaic system using fuzzy logi...IJECEIAES
The power generated by photovoltaic (PV) systems is influenced by
environmental factors. This variability hampers the control and utilization of
solar cells' peak output. In this study, a single-stage grid-connected PV
system is designed to enhance power quality. Our approach employs fuzzy
logic in the direct power control (DPC) of a three-phase voltage source
inverter (VSI), enabling seamless integration of the PV connected to the
grid. Additionally, a fuzzy logic-based maximum power point tracking
(MPPT) controller is adopted, which outperforms traditional methods like
incremental conductance (INC) in enhancing solar cell efficiency and
minimizing the response time. Moreover, the inverter's real-time active and
reactive power is directly managed to achieve a unity power factor (UPF).
The system's performance is assessed through MATLAB/Simulink
implementation, showing marked improvement over conventional methods,
particularly in steady-state and varying weather conditions. For solar
irradiances of 500 and 1,000 W/m2
, the results show that the proposed
method reduces the total harmonic distortion (THD) of the injected current
to the grid by approximately 46% and 38% compared to conventional
methods, respectively. Furthermore, we compare the simulation results with
IEEE standards to evaluate the system's grid compatibility.
Enhancing photovoltaic system maximum power point tracking with fuzzy logic-b...IJECEIAES
Photovoltaic systems have emerged as a promising energy resource that
caters to the future needs of society, owing to their renewable, inexhaustible,
and cost-free nature. The power output of these systems relies on solar cell
radiation and temperature. In order to mitigate the dependence on
atmospheric conditions and enhance power tracking, a conventional
approach has been improved by integrating various methods. To optimize
the generation of electricity from solar systems, the maximum power point
tracking (MPPT) technique is employed. To overcome limitations such as
steady-state voltage oscillations and improve transient response, two
traditional MPPT methods, namely fuzzy logic controller (FLC) and perturb
and observe (P&O), have been modified. This research paper aims to
simulate and validate the step size of the proposed modified P&O and FLC
techniques within the MPPT algorithm using MATLAB/Simulink for
efficient power tracking in photovoltaic systems.
Adaptive synchronous sliding control for a robot manipulator based on neural ...IJECEIAES
Robot manipulators have become important equipment in production lines, medical fields, and transportation. Improving the quality of trajectory tracking for
robot hands is always an attractive topic in the research community. This is a
challenging problem because robot manipulators are complex nonlinear systems
and are often subject to fluctuations in loads and external disturbances. This
article proposes an adaptive synchronous sliding control scheme to improve trajectory tracking performance for a robot manipulator. The proposed controller
ensures that the positions of the joints track the desired trajectory, synchronize
the errors, and significantly reduces chattering. First, the synchronous tracking
errors and synchronous sliding surfaces are presented. Second, the synchronous
tracking error dynamics are determined. Third, a robust adaptive control law is
designed,the unknown components of the model are estimated online by the neural network, and the parameters of the switching elements are selected by fuzzy
logic. The built algorithm ensures that the tracking and approximation errors
are ultimately uniformly bounded (UUB). Finally, the effectiveness of the constructed algorithm is demonstrated through simulation and experimental results.
Simulation and experimental results show that the proposed controller is effective with small synchronous tracking errors, and the chattering phenomenon is
significantly reduced.
Remote field-programmable gate array laboratory for signal acquisition and de...IJECEIAES
A remote laboratory utilizing field-programmable gate array (FPGA) technologies enhances students’ learning experience anywhere and anytime in embedded system design. Existing remote laboratories prioritize hardware access and visual feedback for observing board behavior after programming, neglecting comprehensive debugging tools to resolve errors that require internal signal acquisition. This paper proposes a novel remote embeddedsystem design approach targeting FPGA technologies that are fully interactive via a web-based platform. Our solution provides FPGA board access and debugging capabilities beyond the visual feedback provided by existing remote laboratories. We implemented a lab module that allows users to seamlessly incorporate into their FPGA design. The module minimizes hardware resource utilization while enabling the acquisition of a large number of data samples from the signal during the experiments by adaptively compressing the signal prior to data transmission. The results demonstrate an average compression ratio of 2.90 across three benchmark signals, indicating efficient signal acquisition and effective debugging and analysis. This method allows users to acquire more data samples than conventional methods. The proposed lab allows students to remotely test and debug their designs, bridging the gap between theory and practice in embedded system design.
Detecting and resolving feature envy through automated machine learning and m...IJECEIAES
Efficiently identifying and resolving code smells enhances software project quality. This paper presents a novel solution, utilizing automated machine learning (AutoML) techniques, to detect code smells and apply move method refactoring. By evaluating code metrics before and after refactoring, we assessed its impact on coupling, complexity, and cohesion. Key contributions of this research include a unique dataset for code smell classification and the development of models using AutoGluon for optimal performance. Furthermore, the study identifies the top 20 influential features in classifying feature envy, a well-known code smell, stemming from excessive reliance on external classes. We also explored how move method refactoring addresses feature envy, revealing reduced coupling and complexity, and improved cohesion, ultimately enhancing code quality. In summary, this research offers an empirical, data-driven approach, integrating AutoML and move method refactoring to optimize software project quality. Insights gained shed light on the benefits of refactoring on code quality and the significance of specific features in detecting feature envy. Future research can expand to explore additional refactoring techniques and a broader range of code metrics, advancing software engineering practices and standards.
Smart monitoring technique for solar cell systems using internet of things ba...IJECEIAES
Rapidly and remotely monitoring and receiving the solar cell systems status parameters, solar irradiance, temperature, and humidity, are critical issues in enhancement their efficiency. Hence, in the present article an improved smart prototype of internet of things (IoT) technique based on embedded system through NodeMCU ESP8266 (ESP-12E) was carried out experimentally. Three different regions at Egypt; Luxor, Cairo, and El-Beheira cities were chosen to study their solar irradiance profile, temperature, and humidity by the proposed IoT system. The monitoring data of solar irradiance, temperature, and humidity were live visualized directly by Ubidots through hypertext transfer protocol (HTTP) protocol. The measured solar power radiation in Luxor, Cairo, and El-Beheira ranged between 216-1000, 245-958, and 187-692 W/m 2 respectively during the solar day. The accuracy and rapidity of obtaining monitoring results using the proposed IoT system made it a strong candidate for application in monitoring solar cell systems. On the other hand, the obtained solar power radiation results of the three considered regions strongly candidate Luxor and Cairo as suitable places to build up a solar cells system station rather than El-Beheira.
An efficient security framework for intrusion detection and prevention in int...IJECEIAES
Over the past few years, the internet of things (IoT) has advanced to connect billions of smart devices to improve quality of life. However, anomalies or malicious intrusions pose several security loopholes, leading to performance degradation and threat to data security in IoT operations. Thereby, IoT security systems must keep an eye on and restrict unwanted events from occurring in the IoT network. Recently, various technical solutions based on machine learning (ML) models have been derived towards identifying and restricting unwanted events in IoT. However, most ML-based approaches are prone to miss-classification due to inappropriate feature selection. Additionally, most ML approaches applied to intrusion detection and prevention consider supervised learning, which requires a large amount of labeled data to be trained. Consequently, such complex datasets are impossible to source in a large network like IoT. To address this problem, this proposed study introduces an efficient learning mechanism to strengthen the IoT security aspects. The proposed algorithm incorporates supervised and unsupervised approaches to improve the learning models for intrusion detection and mitigation. Compared with the related works, the experimental outcome shows that the model performs well in a benchmark dataset. It accomplishes an improved detection accuracy of approximately 99.21%.
Developing a smart system for infant incubators using the internet of things ...IJECEIAES
This research is developing an incubator system that integrates the internet of things and artificial intelligence to improve care for premature babies. The system workflow starts with sensors that collect data from the incubator. Then, the data is sent in real-time to the internet of things (IoT) broker eclipse mosquito using the message queue telemetry transport (MQTT) protocol version 5.0. After that, the data is stored in a database for analysis using the long short-term memory network (LSTM) method and displayed in a web application using an application programming interface (API) service. Furthermore, the experimental results produce as many as 2,880 rows of data stored in the database. The correlation coefficient between the target attribute and other attributes ranges from 0.23 to 0.48. Next, several experiments were conducted to evaluate the model-predicted value on the test data. The best results are obtained using a two-layer LSTM configuration model, each with 60 neurons and a lookback setting 6. This model produces an R 2 value of 0.934, with a root mean square error (RMSE) value of 0.015 and a mean absolute error (MAE) of 0.008. In addition, the R 2 value was also evaluated for each attribute used as input, with a result of values between 0.590 and 0.845.
A review on internet of things-based stingless bee's honey production with im...IJECEIAES
Honey is produced exclusively by honeybees and stingless bees which both are well adapted to tropical and subtropical regions such as Malaysia. Stingless bees are known for producing small amounts of honey and are known for having a unique flavor profile. Problem identified that many stingless bees collapsed due to weather, temperature and environment. It is critical to understand the relationship between the production of stingless bee honey and environmental conditions to improve honey production. Thus, this paper presents a review on stingless bee's honey production and prediction modeling. About 54 previous research has been analyzed and compared in identifying the research gaps. A framework on modeling the prediction of stingless bee honey is derived. The result presents the comparison and analysis on the internet of things (IoT) monitoring systems, honey production estimation, convolution neural networks (CNNs), and automatic identification methods on bee species. It is identified based on image detection method the top best three efficiency presents CNN is at 98.67%, densely connected convolutional networks with YOLO v3 is 97.7%, and DenseNet201 convolutional networks 99.81%. This study is significant to assist the researcher in developing a model for predicting stingless honey produced by bee's output, which is important for a stable economy and food security.
A trust based secure access control using authentication mechanism for intero...IJECEIAES
The internet of things (IoT) is a revolutionary innovation in many aspects of our society including interactions, financial activity, and global security such as the military and battlefield internet. Due to the limited energy and processing capacity of network devices, security, energy consumption, compatibility, and device heterogeneity are the long-term IoT problems. As a result, energy and security are critical for data transmission across edge and IoT networks. Existing IoT interoperability techniques need more computation time, have unreliable authentication mechanisms that break easily, lose data easily, and have low confidentiality. In this paper, a key agreement protocol-based authentication mechanism for IoT devices is offered as a solution to this issue. This system makes use of information exchange, which must be secured to prevent access by unauthorized users. Using a compact contiki/cooja simulator, the performance and design of the suggested framework are validated. The simulation findings are evaluated based on detection of malicious nodes after 60 minutes of simulation. The suggested trust method, which is based on privacy access control, reduced packet loss ratio to 0.32%, consumed 0.39% power, and had the greatest average residual energy of 0.99 mJoules at 10 nodes.
Fuzzy linear programming with the intuitionistic polygonal fuzzy numbersIJECEIAES
In real world applications, data are subject to ambiguity due to several factors; fuzzy sets and fuzzy numbers propose a great tool to model such ambiguity. In case of hesitation, the complement of a membership value in fuzzy numbers can be different from the non-membership value, in which case we can model using intuitionistic fuzzy numbers as they provide flexibility by defining both a membership and a non-membership functions. In this article, we consider the intuitionistic fuzzy linear programming problem with intuitionistic polygonal fuzzy numbers, which is a generalization of the previous polygonal fuzzy numbers found in the literature. We present a modification of the simplex method that can be used to solve any general intuitionistic fuzzy linear programming problem after approximating the problem by an intuitionistic polygonal fuzzy number with n edges. This method is given in a simple tableau formulation, and then applied on numerical examples for clarity.
The performance of artificial intelligence in prostate magnetic resonance im...IJECEIAES
Prostate cancer is the predominant form of cancer observed in men worldwide. The application of magnetic resonance imaging (MRI) as a guidance tool for conducting biopsies has been established as a reliable and well-established approach in the diagnosis of prostate cancer. The diagnostic performance of MRI-guided prostate cancer diagnosis exhibits significant heterogeneity due to the intricate and multi-step nature of the diagnostic pathway. The development of artificial intelligence (AI) models, specifically through the utilization of machine learning techniques such as deep learning, is assuming an increasingly significant role in the field of radiology. In the realm of prostate MRI, a considerable body of literature has been dedicated to the development of various AI algorithms. These algorithms have been specifically designed for tasks such as prostate segmentation, lesion identification, and classification. The overarching objective of these endeavors is to enhance diagnostic performance and foster greater agreement among different observers within MRI scans for the prostate. This review article aims to provide a concise overview of the application of AI in the field of radiology, with a specific focus on its utilization in prostate MRI.
Seizure stage detection of epileptic seizure using convolutional neural networksIJECEIAES
According to the World Health Organization (WHO), seventy million individuals worldwide suffer from epilepsy, a neurological disorder. While electroencephalography (EEG) is crucial for diagnosing epilepsy and monitoring the brain activity of epilepsy patients, it requires a specialist to examine all EEG recordings to find epileptic behavior. This procedure needs an experienced doctor, and a precise epilepsy diagnosis is crucial for appropriate treatment. To identify epileptic seizures, this study employed a convolutional neural network (CNN) based on raw scalp EEG signals to discriminate between preictal, ictal, postictal, and interictal segments. The possibility of these characteristics is explored by examining how well timedomain signals work in the detection of epileptic signals using intracranial Freiburg Hospital (FH), scalp Children's Hospital Boston-Massachusetts Institute of Technology (CHB-MIT) databases, and Temple University Hospital (TUH) EEG. To test the viability of this approach, two types of experiments were carried out. Firstly, binary class classification (preictal, ictal, postictal each versus interictal) and four-class classification (interictal versus preictal versus ictal versus postictal). The average accuracy for stage detection using CHB-MIT database was 84.4%, while the Freiburg database's time-domain signals had an accuracy of 79.7% and the highest accuracy of 94.02% for classification in the TUH EEG database when comparing interictal stage to preictal stage.
Analysis of driving style using self-organizing maps to analyze driver behaviorIJECEIAES
Modern life is strongly associated with the use of cars, but the increase in acceleration speeds and their maneuverability leads to a dangerous driving style for some drivers. In these conditions, the development of a method that allows you to track the behavior of the driver is relevant. The article provides an overview of existing methods and models for assessing the functioning of motor vehicles and driver behavior. Based on this, a combined algorithm for recognizing driving style is proposed. To do this, a set of input data was formed, including 20 descriptive features: About the environment, the driver's behavior and the characteristics of the functioning of the car, collected using OBD II. The generated data set is sent to the Kohonen network, where clustering is performed according to driving style and degree of danger. Getting the driving characteristics into a particular cluster allows you to switch to the private indicators of an individual driver and considering individual driving characteristics. The application of the method allows you to identify potentially dangerous driving styles that can prevent accidents.
Hyperspectral object classification using hybrid spectral-spatial fusion and ...IJECEIAES
Because of its spectral-spatial and temporal resolution of greater areas, hyperspectral imaging (HSI) has found widespread application in the field of object classification. The HSI is typically used to accurately determine an object's physical characteristics as well as to locate related objects with appropriate spectral fingerprints. As a result, the HSI has been extensively applied to object identification in several fields, including surveillance, agricultural monitoring, environmental research, and precision agriculture. However, because of their enormous size, objects require a lot of time to classify; for this reason, both spectral and spatial feature fusion have been completed. The existing classification strategy leads to increased misclassification, and the feature fusion method is unable to preserve semantic object inherent features; This study addresses the research difficulties by introducing a hybrid spectral-spatial fusion (HSSF) technique to minimize feature size while maintaining object intrinsic qualities; Lastly, a soft-margins kernel is proposed for multi-layer deep support vector machine (MLDSVM) to reduce misclassification. The standard Indian pines dataset is used for the experiment, and the outcome demonstrates that the HSSF-MLDSVM model performs substantially better in terms of accuracy and Kappa coefficient.
NO1 Uk best vashikaran specialist in delhi vashikaran baba near me online vas...Amil Baba Dawood bangali
Contact with Dawood Bhai Just call on +92322-6382012 and we'll help you. We'll solve all your problems within 12 to 24 hours and with 101% guarantee and with astrology systematic. If you want to take any personal or professional advice then also you can call us on +92322-6382012 , ONLINE LOVE PROBLEM & Other all types of Daily Life Problem's.Then CALL or WHATSAPP us on +92322-6382012 and Get all these problems solutions here by Amil Baba DAWOOD BANGALI
#vashikaranspecialist #astrologer #palmistry #amliyaat #taweez #manpasandshadi #horoscope #spiritual #lovelife #lovespell #marriagespell#aamilbabainpakistan #amilbabainkarachi #powerfullblackmagicspell #kalajadumantarspecialist #realamilbaba #AmilbabainPakistan #astrologerincanada #astrologerindubai #lovespellsmaster #kalajaduspecialist #lovespellsthatwork #aamilbabainlahore#blackmagicformarriage #aamilbaba #kalajadu #kalailam #taweez #wazifaexpert #jadumantar #vashikaranspecialist #astrologer #palmistry #amliyaat #taweez #manpasandshadi #horoscope #spiritual #lovelife #lovespell #marriagespell#aamilbabainpakistan #amilbabainkarachi #powerfullblackmagicspell #kalajadumantarspecialist #realamilbaba #AmilbabainPakistan #astrologerincanada #astrologerindubai #lovespellsmaster #kalajaduspecialist #lovespellsthatwork #aamilbabainlahore #blackmagicforlove #blackmagicformarriage #aamilbaba #kalajadu #kalailam #taweez #wazifaexpert #jadumantar #vashikaranspecialist #astrologer #palmistry #amliyaat #taweez #manpasandshadi #horoscope #spiritual #lovelife #lovespell #marriagespell#aamilbabainpakistan #amilbabainkarachi #powerfullblackmagicspell #kalajadumantarspecialist #realamilbaba #AmilbabainPakistan #astrologerincanada #astrologerindubai #lovespellsmaster #kalajaduspecialist #lovespellsthatwork #aamilbabainlahore #Amilbabainuk #amilbabainspain #amilbabaindubai #Amilbabainnorway #amilbabainkrachi #amilbabainlahore #amilbabaingujranwalan #amilbabainislamabad
Overview of the fundamental roles in Hydropower generation and the components involved in wider Electrical Engineering.
This paper presents the design and construction of hydroelectric dams from the hydrologist’s survey of the valley before construction, all aspects and involved disciplines, fluid dynamics, structural engineering, generation and mains frequency regulation to the very transmission of power through the network in the United Kingdom.
Author: Robbie Edward Sayers
Collaborators and co editors: Charlie Sims and Connor Healey.
(C) 2024 Robbie E. Sayers
Water scarcity is the lack of fresh water resources to meet the standard water demand. There are two type of water scarcity. One is physical. The other is economic water scarcity.
Final project report on grocery store management system..pdfKamal Acharya
In today’s fast-changing business environment, it’s extremely important to be able to respond to client needs in the most effective and timely manner. If your customers wish to see your business online and have instant access to your products or services.
Online Grocery Store is an e-commerce website, which retails various grocery products. This project allows viewing various products available enables registered users to purchase desired products instantly using Paytm, UPI payment processor (Instant Pay) and also can place order by using Cash on Delivery (Pay Later) option. This project provides an easy access to Administrators and Managers to view orders placed using Pay Later and Instant Pay options.
In order to develop an e-commerce website, a number of Technologies must be studied and understood. These include multi-tiered architecture, server and client-side scripting techniques, implementation technologies, programming language (such as PHP, HTML, CSS, JavaScript) and MySQL relational databases. This is a project with the objective to develop a basic website where a consumer is provided with a shopping cart website and also to know about the technologies used to develop such a website.
This document will discuss each of the underlying technologies to create and implement an e- commerce website.
Industrial Training at Shahjalal Fertilizer Company Limited (SFCL)MdTanvirMahtab2
This presentation is about the working procedure of Shahjalal Fertilizer Company Limited (SFCL). A Govt. owned Company of Bangladesh Chemical Industries Corporation under Ministry of Industries.
Welcome to WIPAC Monthly the magazine brought to you by the LinkedIn Group Water Industry Process Automation & Control.
In this month's edition, along with this month's industry news to celebrate the 13 years since the group was created we have articles including
A case study of the used of Advanced Process Control at the Wastewater Treatment works at Lleida in Spain
A look back on an article on smart wastewater networks in order to see how the industry has measured up in the interim around the adoption of Digital Transformation in the Water Industry.
Variance of total dissolved solids and electrical conductivity for water quality in Sabak Bernam
1. International Journal of Electrical and Computer Engineering (IJECE)
Vol. 13, No. 2, April 2023, pp. 2259~2269
ISSN: 2088-8708, DOI: 10.11591/ijece.v13i2.pp2259-2269 2259
Journal homepage: http://ijece.iaescore.com
Variance of total dissolved solids and electrical conductivity for
water quality in Sabak Bernam
Mohd Suhaimi Sulaiman1
, Mohamad Faizal Abd Rahman1
, Aileen Farida Mohd Adam2
1
School of Electrical Engineering, College of Engineering, Universiti Teknologi MARA, Cawangan Pulau Pinang,
Permatang Pauh Campus, Pulau Pinang, Malaysia
2
Academy of Language Studies, Universiti Teknologi MARA, Cawangan Pulau Pinang, Permatang Pauh Campus,
Pulau Pinang, Malaysia
Article Info ABSTRACT
Article history:
Received Mar 9, 2022
Revised Sep 28, 2022
Accepted Oct 23, 2022
Water pollution is one of the most serious environmental problems in
Malaysia. The most notable occurrence of pollution happened in Selangor.
Currently, there are various water quality monitoring (WQM) methods to
observe the quality of water. One of the methods used is the internet of
things (IoT) for wireless sensor network technology to obtain real-time data
measurement. In this study, the developed WQM system is equipped with a
sensor that can measure total dissolved solid (TDS) and electrical
conductivity (EC). Arduino UNO was used in this system as a
microcontroller to interact with the sensor. The Wi-Fi module, ESP8266,
was used to transfer the collected data to ThingSpeak, which acts as a cloud
to store all the data. The results showed that both sample populations can be
discriminated since the p-value is greater than 0.05 in the normality test,
while in the paired sample t-test, the p-value is less than 0.05. In conclusion,
this research provides an easier way to monitor water quality by taking up
less time at less cost, as well as being reliable in giving real-time data
reading.
Keywords:
Arduino
Electrical conductivity
Internet of things
Total dissolved solid
Water quality
This is an open access article under the CC BY-SA license.
Corresponding Author:
Mohd Suhaimi Sulaiman
School of Electrical Engineering, College of Engineering, Universiti Teknologi MARA
Cawangan Pulau Pinang, Permatang Pauh Campus, 13500 Permatang Pauh, Penang, Malaysia
Email: shemi@uitm.edu.my
1. INTRODUCTION
Since the 1990s, there have been many water crises in Malaysia, resulting in lots of hardships and
economic losses within the community. This has made it necessary for the government to have an awareness of
the relevance of conserving water. Each year, hundreds of complaints about water pollution are issued to the
Department of Environment from different sources, such as factories, businesses, farms, as well as individuals [1].
Over the years, water pollution has become a critical issue in Selangor, Malaysia. Water pollution
that occurs in the rivers is mostly due to the dumping of wastewater from the factories located nearby [2], [3].
Many methods have been used in previous research to monitor the quality of water. Most of the current
methods being used require a person to go directly to the river to monitor the water quality [4]. This method
is not efficient since it is hard to obtain real-time data measurement [5]–[7]. Based on previous water quality
measurements, most of the methods used to measure water quality do not include the electrical properties of
water such as electrical conductivity (EC). Anna [8] conducted an experiment on the correlation between
conductivity and total dissolved solid in various types of water, which shows that EC is an important
parameter that can be used to indicate whether the water is clean or polluted. Based on the reviewed paper, it
shows that the changes in EC values could affect the health of the consumer.
2. ISSN: 2088-8708
Int J Elec & Comp Eng, Vol. 13, No. 2, April 2023: 2259-2269
2260
In this study, an IoT system was used in the proposed system design that enables the data to be
collected and monitored in real-time through a personal computer (PC) or smartphone. A total set of 200 data
were collected from the nearest river in Sabak Bernam, Selangor. The collected data were then sent to the
cloud using ThingSpeak, which can store and retrieve data from a microcontroller using a standard protocol
over the Internet or via a local area network (LAN). The data then were downloaded and tested using the
statistical analysis method in IBM SPSS. The parameters that were observed in the proposed system were
total dissolved solid (TDS) (unit in part per million, ppm) and EC (unit in milisiemens per centimeter,
mS/cm). According to the National Water Standard for Malaysia, the maximum TDS and EC values for clean
water are between 0 to 500 ppm and 0 to 1 mS/cm [9]. Hence, this project was introduced with the purpose of
establishing a water quality monitoring (WQM) system that could discriminate between clean and polluted
river water based on TDS and EC values.
The traditional water quality measurement involves three steps, which require the authority to do
water sampling, sample testing, and investigative analysis [10]. This technique is not fully reliable and gives
no indication beforehand of the quality of water. These methods mentioned above are also very expensive,
difficult, time-consuming, require expert advice, and are less efficient. [11]. In order to use this technique,
many instruments are needed, such as Secchi disks, which are used to measure water clarity, probes, nets,
gauges, and meters. Besides impeding accurate water quality measurement, this technique also fails to predict
sudden changes in the water.
Chowdury et al. [12] suggested building a system that is mainly composed of the main controller,
sensor, and wireless communication module. The instruments used by the researchers to build a wireless
WQM system were STM32, pH sensor, temperature sensor, turbidity sensor, and ESP8266. The system used
a Microsoft SQL Server database to organize, store and manage the data collected. The data on water quality
can be accessed by the user through a mobile phone application or web client. The researchers claimed that
this system is low-cost, energy-saving, and has low power consumption. Furthermore, users can check the
water quality problem in a timely manner.
A wireless WQM system with IoT has been developed in an effort to measure the water quality at
Hyderabad Metropolitan City [5]. The instruments used were the Arduino Mega, four sensors which measure
pH, turbidity, ultrasonic, and DHT-11, as well as the ESP8266 Wi-Fi module (NodeMCU). Although the
parameters measured in this study were pH, turbidity, water level, temperature, and humidity of water, only
two parameters were considered in the statistical analysis. The cloud used was ThingSpeak, which allows
data to be stored and enables data to be visualized into graphical data. Besides that, ThingSpeak also provides
an easier way for the user to access the data collected through their mobile phone and personal computer.
Electrical conductivity is one of the parameters that can be observed to determine the quality of
water. Zhang et al. [13] have done a case study of determining the water pollution at Rudrasagar Lake by
observing the EC. The researchers stated that the significant change in EC may be due to either natural
flooding, evaporation, or man-made pollution, which can be very detrimental to water quality. The sudden
increase or decrease in conductivity in a body of water may indicate pollution. There is also a linear
relationship between TDS and EC.
Sulaiman and Hashim [14] discriminate latex between healthy and white root infected rubber trees
based on dry rubber content using statistical analysis. The comparison of the DRC of latex from healthy
rubber trees and white root infected rubber trees was initiated using a normality test to investigate whether
the sample population followed a normal distribution or not. The data is considered normal if it is in a bell-
curve shape. Then, the parametric test was applied using an error bar plot and followed by a paired sample
test for conclusive numerical findings. Using statistical analysis, the result showed a very distinguishable
value for both cases. There was no overlap in the error bar in both cases, and the p-value (0.001) indicated
that there was a discrimination between both cases. This shows that statistical analysis is reliable and can be
used to identify healthy and white root diseases in rubber trees.
Based on the above study, it can be concluded that there is an alternative way to monitor the quality
of water by implementing modern technology in the system. TDS and EC are both indicators that can be used
to identify clean and polluted river water [15]. Statistical analysis can be used to strengthen the proof that
clean and polluted river water can be discriminated by looking at p-value results from the normality test and
paired sample t-test. All these measurements can be made with the help of the Arduino Uno microcontroller
and ThingSpeak for data collection.
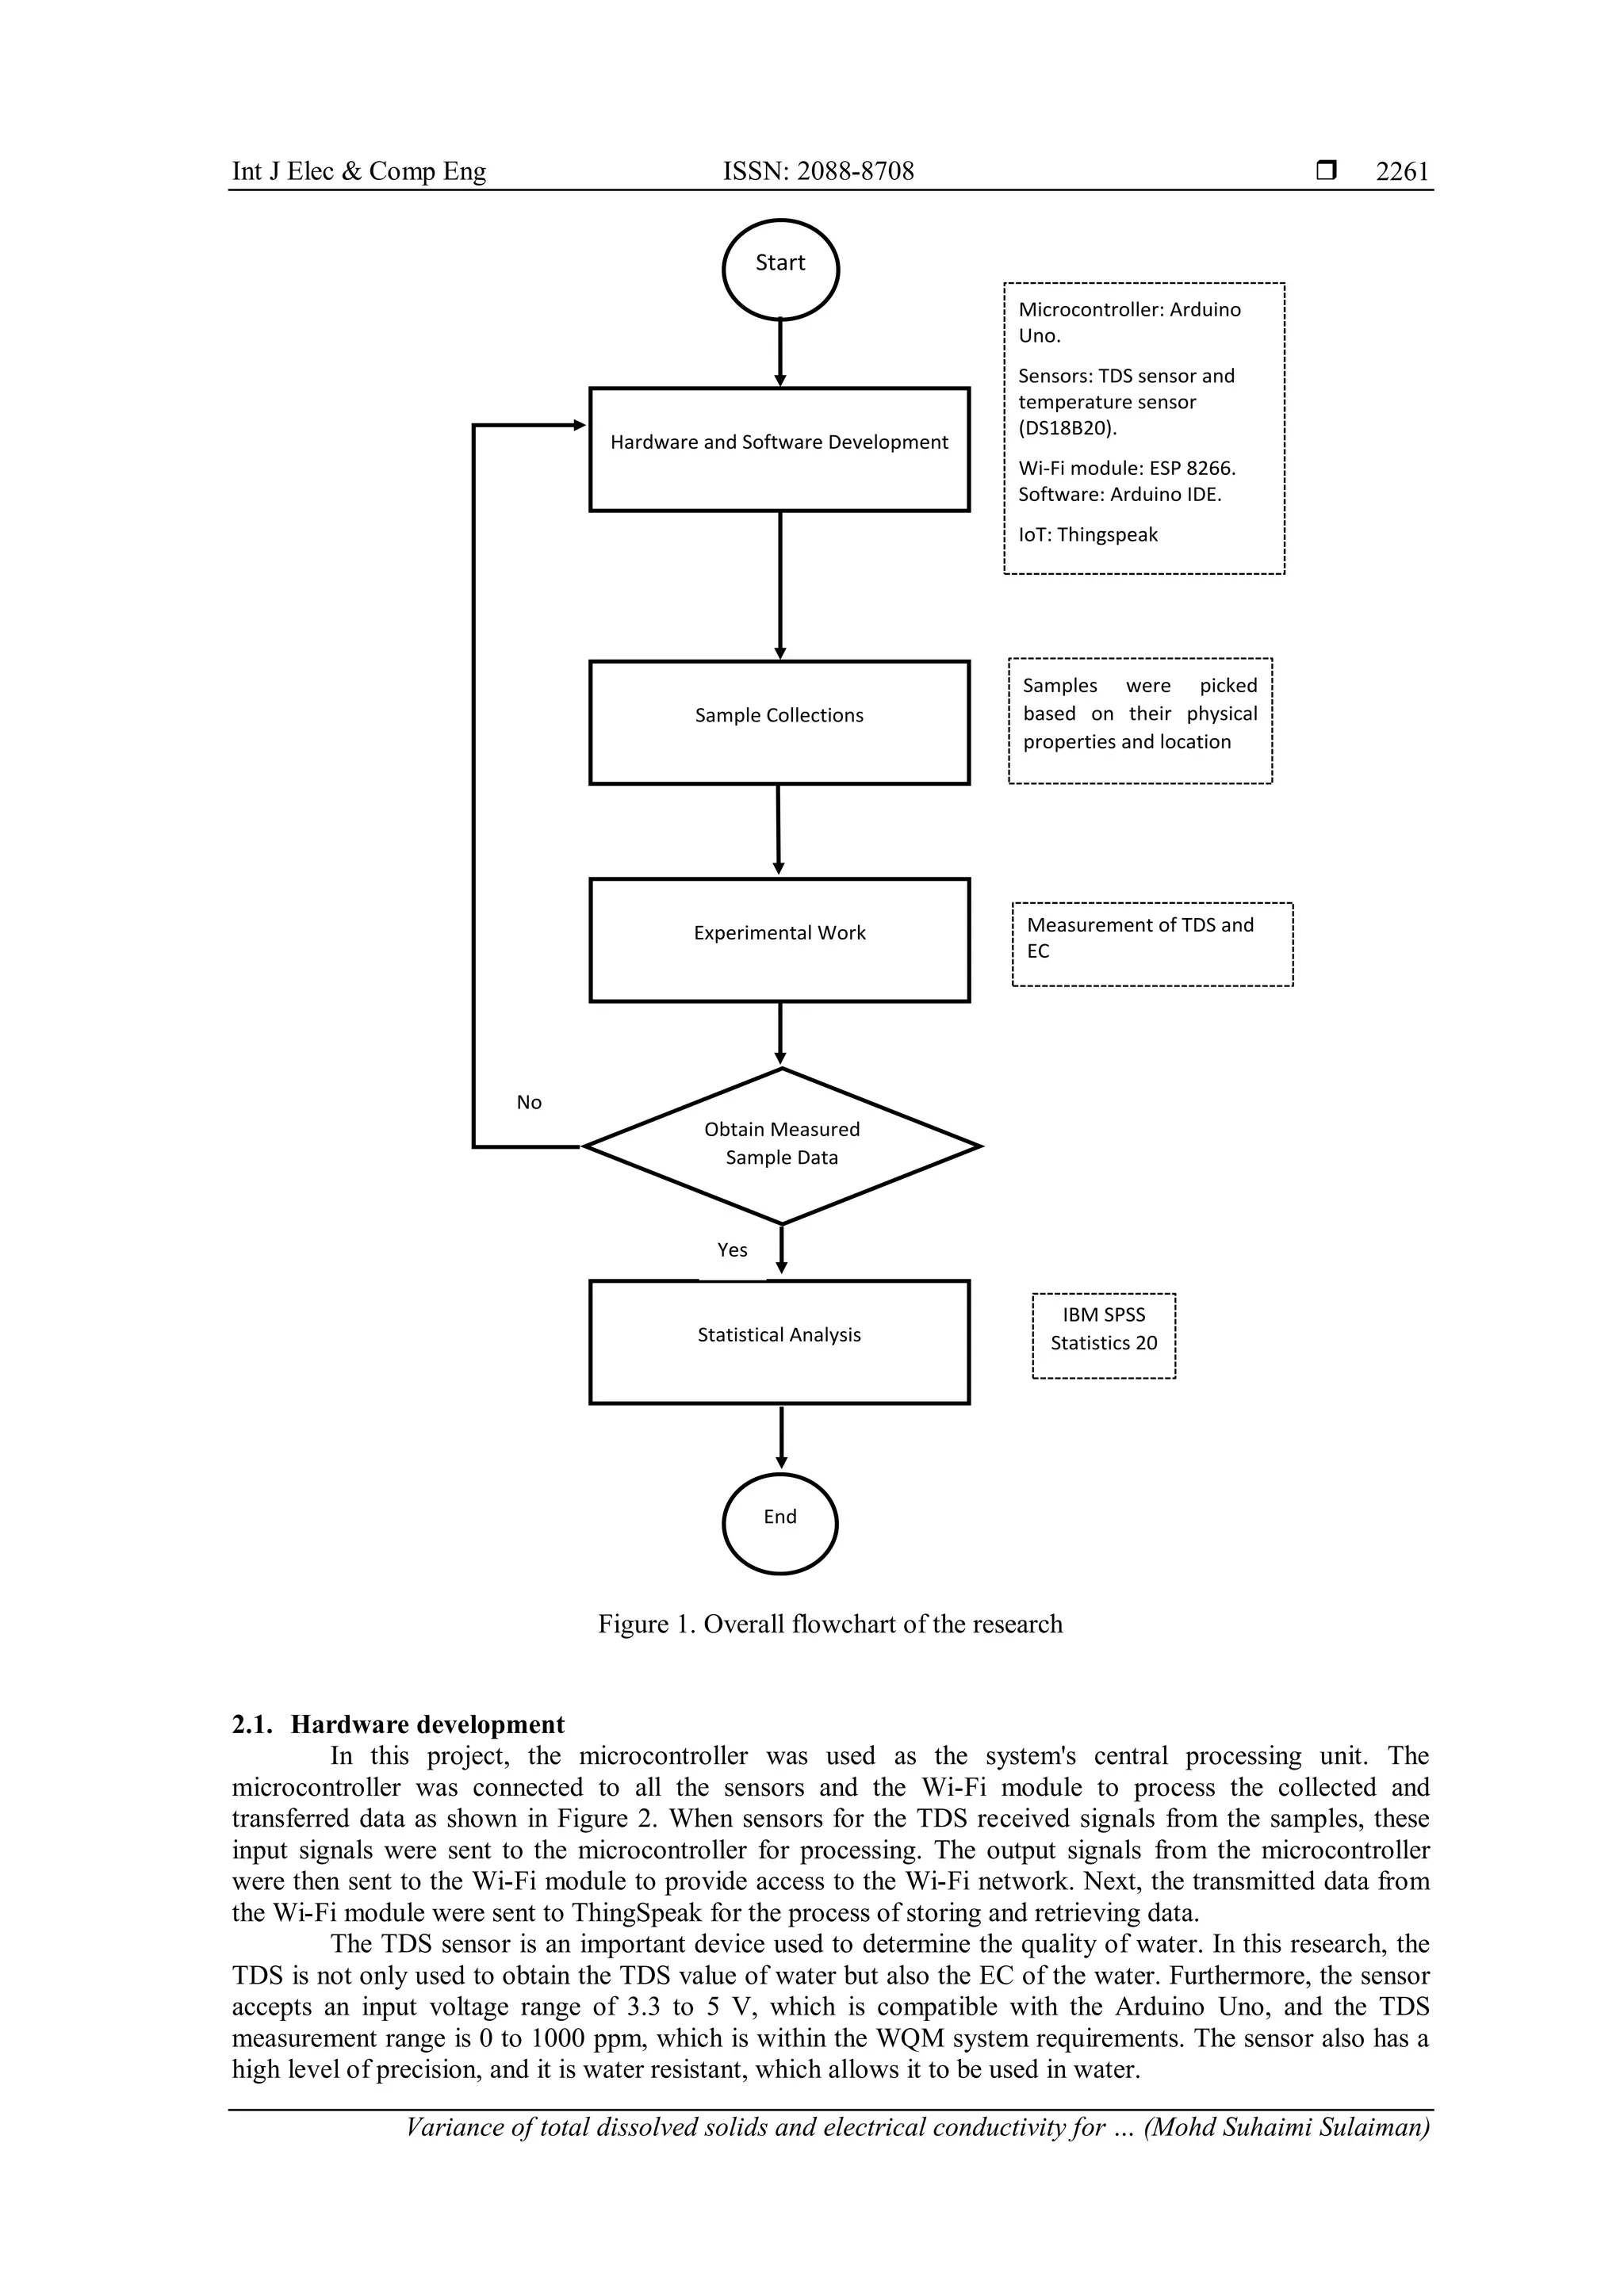
2. METHOD
This section explains the process of the whole experimental work method of measuring TDS and EC
properties using the Arduino Uno microcontroller. The methodology also explains the method of analyzing
the results from the experiment. The overall process of the project is shown in Figure 1.
3. Int J Elec & Comp Eng ISSN: 2088-8708
Variance of total dissolved solids and electrical conductivity for … (Mohd Suhaimi Sulaiman)
2261
Figure 1. Overall flowchart of the research
2.1. Hardware development
In this project, the microcontroller was used as the system's central processing unit. The
microcontroller was connected to all the sensors and the Wi-Fi module to process the collected and
transferred data as shown in Figure 2. When sensors for the TDS received signals from the samples, these
input signals were sent to the microcontroller for processing. The output signals from the microcontroller
were then sent to the Wi-Fi module to provide access to the Wi-Fi network. Next, the transmitted data from
the Wi-Fi module were sent to ThingSpeak for the process of storing and retrieving data.
The TDS sensor is an important device used to determine the quality of water. In this research, the
TDS is not only used to obtain the TDS value of water but also the EC of the water. Furthermore, the sensor
accepts an input voltage range of 3.3 to 5 V, which is compatible with the Arduino Uno, and the TDS
measurement range is 0 to 1000 ppm, which is within the WQM system requirements. The sensor also has a
high level of precision, and it is water resistant, which allows it to be used in water.
Start
Hardware and Software Development
Sample Collections
Experimental Work
Statistical Analysis
Samples were picked
based on their physical
properties and location
End
IBM SPSS
Statistics 20
Microcontroller: Arduino
Uno.
Sensors: TDS sensor and
temperature sensor
(DS18B20).
Wi-Fi module: ESP 8266.
Software: Arduino IDE.
IoT: Thingspeak
Obtain Measured
Sample Data
No
Yes
Measurement of TDS and
EC
4. ISSN: 2088-8708
Int J Elec & Comp Eng, Vol. 13, No. 2, April 2023: 2259-2269
2262
Figure 2. Microcontroller connection to Wi-Fi module and sensors
The ESP8266 module functions as both a data processing and a Wi-Fi networking server. The TDS
and EC data collected were transmitted through the Wi-Fi network and sent to the web server. These data
will be displayed on a web browser which can be accessed on an internet-connected computer [16]–[18]. The
ESP8266 is a very user friendly and low-cost component that can be used to provide internet connectivity to
the system. It is because the module can function as both a hotspot and a station (connecting to Wi-Fi). It can
also use the application programming interface (API) to fetch the data from the internet, allowing the user to
access any information available on the internet and making it smarter. Another appealing feature of this
module is that it can be programmed with the Arduino IDE, which makes it even more user-friendly.
However, due to the limited general-purpose input-output (GPIO) pins, a microcontroller like the Arduino
Uno is needed to provide more GPIO.
The software used to program the Arduino Uno board is the Arduino integrated development
environment (IDE). The languages that can be used by this software are C and C++ programming languages.
This software is easy to use since it prepares two functions every time the user wishes to create a new project.
The first function is the setup function, and the second function is the loop function.
Since this project uses an IoT system to store and display real-time data, the ThingSpeak application
was chosen as its platform. ThingSpeak is an IoT analytic platform that allows the user to aggregate,
visualize, and analyze live data in the cloud. The collected data can be analyzed graphically since the data
can be represented using many types of graphs. The data that has been collected can also be downloaded as
an Excel file for further analysis using a statistical tool (IBM SPSS). In addition, it shows that ThingSpeak
can not only be accessed through a PC but also via a smartphone. Figure 3 shows the block diagram of the
IoT WQM device, while Figure 4 shows the hardware of the circuit. The block diagram of the IoT WQM
device is divided into 4 parts, which are the sensor network, microcontroller, Wi-Fi module, and IoT.
2.2. Sample collection
At the beginning of the project, 200 samples of clean and polluted river water were taken from
different locations. The selection of this river is based on the factor of high-water consumption for
agricultural activities such as palm oil, rubber tree plantations, and paddy fields. Samples of clean river water
were taken from the tap water of houses located around the selected area in Sabak Bernam, Selangor.
Meanwhile, the polluted river water samples were taken from the drains in Sungai Besar, Sabak Bernam, in
Selangor. In order to verify the results, the data from the river at Pasar Jerami, Sabak Bernam were taken to
test the reliability of the IoT WQM device. The location of the data collection was identified based on the
criteria as mentioned in [19]. The location of the river for verification is shown in Figure 5.
5. Int J Elec & Comp Eng ISSN: 2088-8708
Variance of total dissolved solids and electrical conductivity for … (Mohd Suhaimi Sulaiman)
2263
Figure 3. Block diagram of IoT WQM device Figure 4. IoT WQM device hardware
Figure 5. Location of Pasar Jerami River
2.3. Experimental work
Before the readings were taken from the samples, the TDS sensor must be calibrated using the TDS
calibration method. A TDS calibration standard solution (from Netafarm Hydroproduct, Indonesia) is a
calibration standard solution used in the calibration process. The reading for the TDS sensor needs to be the
same as the TDS calibration standard solution. The value from the TDS sensor must not exceed the standard
solution. In this calibration, the standard solution was set at 500 ppm. While for the EC value, the equation
involved was based on the correlation equation between TDS and EC [8]. This is to ensure that the sensor is
working perfectly.
There were 200 samples of clean water and polluted river water collected from the site. All these
samples were tested using a water quality device. A total of 200 readings were taken from both water
samples. All the collected data were stored in the Thingspeak cloud. In the beginning, the data were divided
into two channels, which were tap water (clean river water) and drain water (polluted river water) in the
Thingspeak platform. In both channels, the data were sorted into two fields, based on the measured
parameter. There were two parameters collected during the research, the measured parameters in this study
focused on TDS and EC values only. All the data that were stored in Thingspeak were displayed as a graph to
provide an easy way for the user to observe the changes in water by using a graphical method. Lastly, the
collected data were downloaded from Thingspeak into an Excel file. All the data from the Excel file were
analyzed using the statistical analysis method in IBM SPSS software.
2.4. Statistical data analysis
In this project, statistical analysis was used to discriminate between clean and polluted river water
[20]. The data obtained from the Thingspeak platform were used as input in IBM SPSS software for
statistical data analysis. There were two tests involved in discriminating all the data. The normality test and
paired sample t-test were used to see whether the data could discriminate between clean and polluted water.
It is widely known that the data must be normally distributed for a normally test. Normally
distributed data can be evaluated using a particular set of statistics called parametric statistics. This statistical
6. ISSN: 2088-8708
Int J Elec & Comp Eng, Vol. 13, No. 2, April 2023: 2259-2269
2264
component includes the variance (s2
) and the standard deviation (s). The variance (s2
) for a sample can be
represented in mathematical terms as in (1).
𝑠2
=
∑(𝑥−𝑥̅)2
𝑛−1
(1)
The symbol n represents the number of observations in the sample. Meanwhile, the standard deviation for
normally distributed data (s) can be expressed as in (2).
s =√∑ 𝑥2−
(∑ 𝑥)2
𝑛
𝑛−1
(2)
If the data are normally distributed, then there would be a mathematical relationship between any one
observation in the sample whereby x and y are the values calculated for any given x value. This mathematical
equation is called the Gaussian equation, where:
𝑦 =
1
√2𝜋𝑠2
𝑒
−(
(𝑥−𝑥
̅)2
2𝑠2 )
(3)
Symbols e and π are particularly constant, and their values are 2.72 and 3.14 after being rounded to two
decimal places, respectively. The mean for the sample observation is 𝑥̅, while s2
is the variance of the sample
observation.
A paired sample t-test in statistics is a method of testing hypotheses about the mean of a sample
drawn from a normally distributed population. The hypotheses are
- H0: There is no difference between the means for the two observation samples, and
- H1: There is a difference between the means for the two samples.
In other words, in this research, the study seeks to investigate if there are any differences between the sample
observations of drain and tap water.
The mathematical equations involved in the t-test are standard error of the difference between the
mean, SED, the t-statistics or tcalculated, where it describes how closely the distribution of the data matches the
distribution predicted under the null hypothesis of the statistical test, and lastly, the degree of freedom, df,
which estimates or makes inferences about population parameters based on the sample data.
The mathematical equation for standard error is:
𝑆𝐸𝐷 = √(
𝑠1
2
𝑛1
+
𝑠2
2
𝑛2
) (4)
where 𝑠1
2
and 𝑠2
2
is the variance, and 𝑛1 and 𝑛2 is the recorded number of observations for each sample. The
mathematical equation for the t-statistic is:
𝑡𝑐𝑎𝑙𝑐𝑢𝑙𝑎𝑡𝑒𝑑 =
𝑥̅1−𝑥̅2
𝑆𝐸𝐷
(5)
where 𝑥̅1 and 𝑥̅2 are the mean of the sample observation. All these formulas [21] mentioned above were used
automatically in the normality test and paired sample t-test in the IBM SPSS statistical tool. The results and
discussions of the findings are described in the next section.
3. RESULTS AND DISCUSSION
This section presents the results and findings of the project. The analysis and discussion for each
part of the results presented in this project are based on the findings from the data collection and
measurement. In this research, only the values of TDS and EC were considered for analysis.
Figures 6 and 7 show that all the data collected throughout the experiment were stored in the cloud.
From the graph, it can be seen that the range values of TDS and EC for clean river water were between
(222 and 244 ppm) and (0.444 and 0.488 mS/cm) respectively. While for polluted river water, the range
value of TDS and EC were between (506 and 528 ppm) and (1.012 and 1.056 mS/cm) respectively. The data
that was stored in the channel for each field were downloaded and exported in Microsoft Excel via the ThingSpeak
software. Table 1 illustrates an example of EC value data acquired for clean river water and polluted river water.
7. Int J Elec & Comp Eng ISSN: 2088-8708
Variance of total dissolved solids and electrical conductivity for … (Mohd Suhaimi Sulaiman)
2265
The collected data in the experiment were tested using the IBM SPSS software. A normality test was
performed on the data to determine whether they were normally distributed or not. A normality test was
performed on 100 datasets for clean river water and 100 datasets for polluted river water. The test was used
for both TDS and EC properties for tap and drain water data as described in Tables 2 and 3.
Figure 6. TDS and EC output from ThingSpeak server for tap water
Figure 7. TDS and EC output from ThingSpeak server for drain water
Table 1. Example of EC value taken from IoT WQM device
Sample Number Clean River Water (mS/cm) Polluted River Water (mS/cm)
1. 0.444 1.018
2. 0.446 1.018
3. 0.450 1.014
4. 0.454 1.020
5. 0.458 1.030
6. 0.456 1.026
7. 0.444 1.012
8. 0.444 1.032
9. 0.448 1.028
10. 0.452 1.014
Given that the dataset is larger than 50, the Kolmogorov-Smirnov approach is highly effective for
evaluating the results. Since the significant value (p-value) of clean river water in the TDS dataset and the
significant value of polluted river water in the TDS dataset were both greater than 0.05, the data were
normally distributed [22], [23]. The data for clean river water and polluted river water for EC properties also
showed the same result as the data for TDS properties. Since the data for EC properties showed the same
result as TDS properties, it can be said that the data were normally distributed. As the population for both
TDS and EC was normally distributed, the parametric tests were then used to test both sets of data. Prior to
testing the data with a paired sample t-test, an error bar plot was then used in order to differentiate between
both data sets. An error bar plot was used to provide concrete evidence that the data could be discriminated
against each other as shown in Figures 8 and 9 [24].
8. ISSN: 2088-8708
Int J Elec & Comp Eng, Vol. 13, No. 2, April 2023: 2259-2269
2266
Table 2. Normality test for clean river water and polluted river water based on EC properties
Kolmogorov-Smirnova
Shapiro-Wilk
Statistic df Sig. Statistic df Sig.
Clean river water_ec .071 100 .200* .976 100 .060
Polluted river water_ec .076 100 .164 .971 100 .027
*. This is a lower bound of the true significance
a. Lilliefors Significance Correction
Table 3. Normality test for clean river water and polluted river water based on TDS properties
Kolmogorov-Smirnova
Shapiro-Wilk
Statistic df Sig. Statistic df Sig.
Clean river water_tds .071 100 .200* .976 100 .060
Polluted river water_tds .076 100 .164 .971 100 .027
*. This is a lower bound of the true significance
a. Lilliefors Significance Correction
The error bar plots for each dataset must not overlap in order to demonstrate that the dataset is
discriminating against each other [25]. The error bar plots for tap water data and drain water data did not
overlap, as illustrated in Figures 8 and 9. This demonstrates that the system can distinguish between tap and
drain water data. As a result, it shows that an error bar plot can provide concrete evidence to show inequality
between each population sample.
Figure 8. Error bar plot for clean river water and polluted river water based on EC properties
Figure 9. Error bar plot for clean river water and polluted river water based on TDS properties
9. Int J Elec & Comp Eng ISSN: 2088-8708
Variance of total dissolved solids and electrical conductivity for … (Mohd Suhaimi Sulaiman)
2267
The dependent t-test sample, also known as the paired sample t-test, is a statistical method for
determining if the mean difference between two sets of observations is zero [26]. In a paired sample t-test,
each subject or entity is examined twice, resulting in pairs of observations. The paired sample t-test is
commonly used in case-control studies or repeated-measures designs. A paired sample t-test is a parametric
test in which the data must first be subjected to a normality test to see if it is suitable for testing.
The data received from the system were valid to be examined with a paired sample t-test because the
normality test results for both datasets passed the minimum p-value (0.05). To know if there is a difference
between the mean of the data, the sig (2-tailed) value must be less than 0.05. The value of sig (2-tailed) was
0.000 after the data were tested for both EC and TDS properties as in Table 4 and Table 5, respectively.
This indicates that the population mean can be discriminated against each other. The IoT WQM device was
tested using samples from the Pasar Jerami’s River, Sabak Bernam, which was located near the experiment
site. The TDS and EC output results from the river were sent to the ThingSpeak server field as shown in
Figure 10.
Table 4. Paired sample T-test for clean river water and polluted river water based on EC properties
Paired Differences t df Sig. (2-tailed)
Mean Std.
Deviation
Std.
Error Mean
95% Confidence Interval of Difference
Lower Upper
Pair 1 Drain_EC - Tap_EC .56868 .01125 .00113 .56645 .57091 505.331 99 .000
Table 5. Paired sample T-test for clean river water and polluted river water based on TDS properties
Paired Differences t df Sig. (2-tailed)
Mean Std.
Deviation
Std.
Error Mean
95% Confidence Interval of Difference
Lower Upper
Pair 1 Drain_TDS - Tap_TDS 284.330 5.62831 .56283 283.21322 285.44678 505.178 99 .000
Figure 10. TDS and EC output from ThingSpeak server for river water
Only TDS data from the river (Pasar Jerami’s River, Sabak Bernam), polluted river water (drain
water from Sungai Besar, Sabak Bernam) and clean river water (tap water from households near Sabak
Bernam) were analyzed using the IBM SPSS statistical tool to discriminate between the sample populations
and classify the river as either clean or polluted. By looking at Table 6, it can be seen that the river near Pasar
Jerami, Sabak Bernam, Selangor can be categorized as a clean river based on its TDS properties.
Table 6. Descriptive statistics for TDS value between drain, tap and river water samples
Descriptive
TDS Value N Mean Std. Deviation Std. Error
95% Confidence Interval for Mean
Minimum Maximum
Lower Bound Upper Bound
Drain 100 517.3600 6.04949 .60495 516.1596 518.5604 506.00 528.00
Tap 100 233.0300 5.86456 .58646 231.8663 234.1937 222.00 244.00
River 100 301.5900 7.06120 .70612 300.1889 302.9911 290.00 313.00
Total 300 350.6600 121.51939 7.01592 336.8532 364.4668 222.00 528.00
10. ISSN: 2088-8708
Int J Elec & Comp Eng, Vol. 13, No. 2, April 2023: 2259-2269
2268
According to Ramadhan [15], the maximum permissible TDS standard is 500 mg/liter or 500 ppm.
However, the river water is still not suitable to be consumed directly since the value of the TDS exceeded the
TDS limit that has been stated by the World Health Organization (WHO) [27]. Based on the collected data,
the TDS values for river water were between 290 ppm and 313 ppm, respectively. The low level of TDS
value at Pasar Jerami’s River may be due to having no activity carried out in the area as it was during the
lockdown.
4. CONCLUSION
In conclusion, the device that has been developed is able to distinguish between clean and polluted
water by comparing the values of TDS and EC. The developed device can provide a better alternative for
measuring water quality, and it gives an advantage by having the function to read and store real-time data.
After testing the device at Pasar Jerami’s River, it can be concluded that the IoT WQM device is reliable to
test the condition of the river by looking at the values of TDS and EC. In statistical analysis, it shows that the
value of the normality test for both samples is greater than 0.05. Meanwhile, the p-value for the paired
sample t-test is less than 0.05. This strengthens the point that the device can distinguish between clean and
polluted water.
ACKNOWLEDGEMENTS
The authors would like to express their deepest gratitude to everyone that were involved in this
study especially those from Universiti Teknologi MARA Cawangan Pulau Pinang who provided help and
support during the research. We would also like to thank the Water Quality Technology Group (WQTG) and
Machine Learning Research Group (MLRG), for assisting with ideas and guidelines.
REFERENCES
[1] Z. S. Khozani, M. Iranmehr, and W. H. M. Wan Mohtar, “Improving water quality index prediction for water resources
management plans in Malaysia: application of machine learning techniques,” Geocarto International, pp. 1–18, Feb. 2022, doi:
10.1080/10106049.2022.2032388.
[2] C. Singaraja, S. Chidambaram, M. V. Prasanna, C. Thivya, and R. Thilagavathi, “Statistical analysis of the hydrogeochemical
evolution of groundwater in hard rock coastal aquifers of Thoothukudi district in Tamil Nadu, India,” Environmental Earth
Sciences, vol. 71, no. 1, pp. 451–464, Jan. 2014, doi: 10.1007/s12665-013-2453-5.
[3] L. Y. Li, H. Jaafar, and N. H. Ramli, “Preliminary study of water quality monitoring based on WSN technology,” in 2018
International Conference on Computational Approach in Smart Systems Design and Applications (ICASSDA), Aug. 2018,
pp. 1–7, doi: 10.1109/ICASSDA.2018.8477627.
[4] C. Kai, Z. Weiwei, and D. Lu, “Research on mobile water quality monitoring System based on underwater bionic robot fish
platform,” in 2020 IEEE International Conference on Advances in Electrical Engineering and Computer Applications (AEECA),
Aug. 2020, pp. 457–461, doi: 10.1109/AEECA49918.2020.9213466.
[5] S. Pasika and S. T. Gandla, “Smart water quality monitoring system with cost-effective using IoT,” Heliyon, vol. 6, no. 7, Jul.
2020, doi: 10.1016/j.heliyon.2020.e04096.
[6] L. Hongpin, L. Guanglin, P. Weifeng, S. Jie, and B. Qiuwei, “Real-time remote monitoring system for aquaculture water quality,”
International Journal of Agricultural and Biological Engineering, vol. 8, no. 6, pp. 136–143, 2015, doi:
10.3965/j.ijabe.20150806.1486.
[7] F. A. Saparudin, T. C. Chee, A. S. A. Ghafar, H. A. Majid, and N. Katiran, “Wireless water quality monitoring system for high
density aquaculture application,” Indonesian Journal of Electrical Engineering and Computer Science (IJEECS), vol. 13, no. 2,
pp. 507–513, Feb. 2019, doi: 10.11591/ijeecs.v13.i2.pp507-513.
[8] A. F. Rusydi, “Correlation between conductivity and total dissolved solid in various type of water: A review,” IOP Conference
Series: Earth and Environmental Science, vol. 118, Feb. 2018, doi: 10.1088/1755-1315/118/1/012019.
[9] A. O. A. Hashem, W. A. A. W. Ahmad, and S. Y. Yusuf, “Water quality status of Sungai Petani River, Kedah, Malaysia,” IOP
Conference Series: Earth and Environmental Science, vol. 646, no. 1, Jan. 2021, doi: 10.1088/1755-1315/646/1/012028.
[10] I. Ahamed and A. Ahmed, “Design of smart biofloc for real-time water quality management system,” in 2021 2nd International
Conference on Robotics, Electrical and Signal Processing Techniques (ICREST), Jan. 2021, pp. 298–302, doi:
10.1109/ICREST51555.2021.9331166.
[11] F. Jan, N. Min-Allah, and D. Düştegör, “IoT based smart water quality monitoring: Recent techniques, trends and challenges for
domestic applications,” Water, vol. 13, no. 13, Jun. 2021, doi: 10.3390/w13131729.
[12] M. S. U. Chowdury et al., “IoT based real-time river water quality monitoring system,” Procedia Computer Science, vol. 155,
pp. 161–168, 2019, doi: 10.1016/j.procs.2019.08.025.
[13] D. Zhang et al., “Electrical conductivity and dissolved oxygen as predictors of nitrate concentrations in shallow groundwater in
Erhai Lake region,” Science of The Total Environment, vol. 802, Jan. 2022, doi: 10.1016/j.scitotenv.2021.149879.
[14] M. S. Sulaiman et al., “Statistical discrimination of latex between healthy and white root infected rubber tree based on dry rubber
content,” IOP Conference Series: Materials Science and Engineering, vol. 99, Nov. 2015, doi: 10.1088/1757-899X/99/1/012024.
[15] A. J. Ramadhan, “Smart water-quality monitoring system based on enabled real-time internet of things,” Journal of Engineering
Science and Technology, vol. 15, no. 6, pp. 3514–3527, 2020.
[16] L. Kamelia, M. A. Ramdhani, A. Faroqi, and V. Rifadiapriyana, “Implementation of automation system for humidity monitoring
and irrigation system,” IOP Conference Series: Materials Science and Engineering, vol. 288, Jan. 2018, doi: 10.1088/1757-
899X/288/1/012092.
11. Int J Elec & Comp Eng ISSN: 2088-8708
Variance of total dissolved solids and electrical conductivity for … (Mohd Suhaimi Sulaiman)
2269
[17] J. Velasco et al., “Internet of things-based (IoT) inventory monitoring refrigerator using Arduino sensor network,” Indonesian
Journal of Electrical Engineering and Computer Science (IJEECS), vol. 18, no. 1, pp. 508–515, Apr. 2020, doi:
10.11591/ijeecs.v18.i1.pp508-515.
[18] N. A. J. Salih, I. J. Hasan, and N. I. Abdulkhaleq, “Design and implementation of a smart monitoring system for water quality of
fish farms,” Indonesian Journal of Electrical Engineering and Computer Science (IJEECS), vol. 14, no. 1, pp. 44–50, Apr. 2019,
doi: 10.11591/ijeecs.v14.i1.pp44-50.
[19] M. F. Ahmed and M. Bin Mokhtar, “Treated water quality based on conventional method in Langat River Basin, Malaysia,”
Environmental Earth Sciences, vol. 79, no. 18, Sep. 2020, doi: 10.1007/s12665-020-09160-7.
[20] Z. Ali and Sb. Bhaskar, “Basic statistical tools in research and data analysis,” Indian Journal of Anaesthesia, vol. 60, no. 9,
pp. 662–669, 2016, doi: 10.4103/0019-5049.190623.
[21] D. Holmes, P. Moody, D. Dine, and L. Trueman, Research methods for the biosciences. Oxford University Press, USA; 3rd ed,
2017.
[22] M. S. Sulaiman, N. K. Madzhi, R. Sajari, and N. E. Abdullah, “Statistical discrimination of latex between healthy and white root
infected Hevea brasiliensis tree based on protein concentration,” Journal of Fundamental and Applied Sciences, vol. 9, no. 5S,
pp. 818–829, Jan. 2018, doi: 10.4314/jfas.v9i5s.58.
[23] H. Hashim et al., “Discriminant analysis with visible lighting properties for White root disease infected rubber tree,” IOP
Conference Series: Materials Science and Engineering, vol. 99, Nov. 2015, doi: 10.1088/1757-899X/99/1/012023.
[24] H. Hashim, S. Ramli, N. Wahid, M. S. Sulaiman, and N. Hassan, “Recognition of psoriasis features via Daubechies D8 wavelet
technique,” International Journal on Smart Sensing and Intelligent Systems, vol. 6, no. 2, pp. 711–732, Jan. 2013, doi:
10.21307/ijssis-2017-562.
[25] S. G. Schreiber, S. Schreiber, R. N. Tanna, D. R. Roberts, and T. J. Arciszewski, “Statistical tools for water quality assessment
and monitoring in river ecosystems – a scoping review and recommendations for data analysis,” Water Quality Research Journal,
vol. 57, no. 1, pp. 40–57, Feb. 2022, doi: 10.2166/wqrj.2022.028.
[26] A. Ghasemi and S. Zahediasl, “Normality tests for statistical analysis: A guide for non-statisticians,” International Journal of
Endocrinology and Metabolism, vol. 10, no. 2, pp. 486–489, Dec. 2012, doi: 10.5812/ijem.3505.
[27] R. Isaac and S. Siddiqui, “Application of water quality index and multivariate statistical techniques for assessment of water
quality around Yamuna River in Agra Region, Uttar Pradesh, India,” Water Supply, vol. 22, no. 3, pp. 3399–3418, Mar. 2022, doi:
10.2166/ws.2021.395.
BIOGRAPHIES OF AUTHORS
Mohd Suhaimi Sulaiman is a senior lecturer at the Faculty of Electrical
Engineering, Universiti Teknologi MARA Cawangan Pulau Pinang. Ts. Dr. Mohd Suhaimi
completed his Ph.D. in Electrical Measurement and Instrumentation at the Faculty of Electrical
Engineering, UiTM in 2019. His research interests are electrical measurement, water quality,
agriculture technology, and artificial neural network ranging from theory and design up to the
implementation. He can be contacted at shemi@uitm.edu.my.
Mohamad Faizal Abd Rahman is a senior lecturer and researcher at the Faculty
of Electrical Engineering, Universiti Teknologi MARA Cawangan Pulau Pinang. He obtained
his Ph.D. in Sensor and Instrumentation from Universiti Sains Malaysia. His research interests
are in optical sensors and instrumentation, microfluidic-based applications, and colorimetric
sensing in various applications. He can be contacted at faizal635@uitm.edu.my.
Aileen Farida Mohd Adam holds a B.Sc. in Edu. and M.Ed. in Teaching English
as a Second Language from Universiti Teknologi Malaysia and Universiti Putra Malaysia,
respectively. She was also a Fulbright Language Teaching Assistant at Northern Illinois
University. Her research interests include using technology in education, statistics in
education, teaching English for specific purposes, and communication skills. She can be
contacted at aileen@uitm.edu.my.