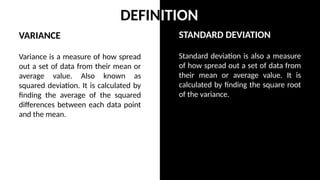
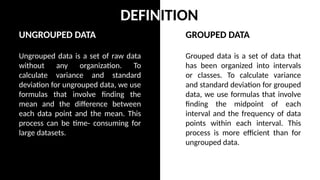
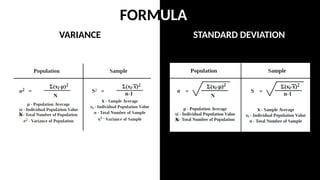
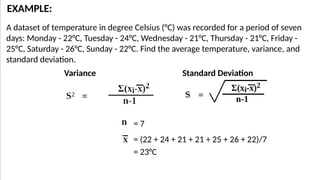
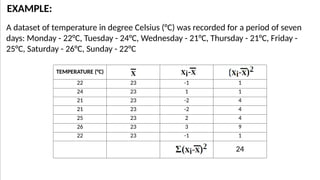
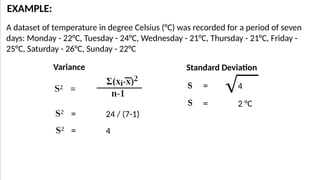
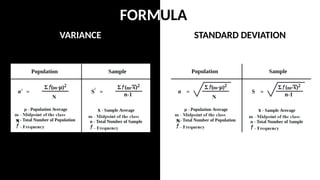
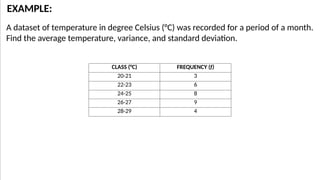
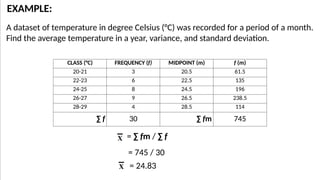
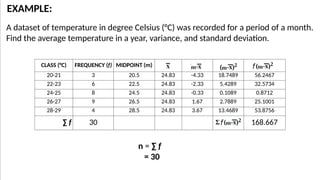
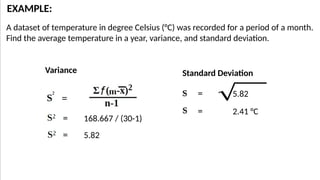
MEASURES OF
VARIABILITY/DISPERSION
VARIANCE
&
STANDARD DEVIATION
STANDARD DEVIATION
Standard deviation is also a measure
of how spread out a set of data from
their mean or average value. It is
calculated by finding the square root
of the variance.
VARIANCE
Variance is a measure of how spread
out a set of data from their mean or
average value. Also known as
squared deviation. It is calculated by
finding the average of the squared
differences between each data point
and the mean.
DEFINITION
GROUPED DATA
Grouped data is a set of data that
has been organized into intervals
or classes. To calculate variance
and standard deviation for grouped
data, we use formulas that involve
finding the midpoint of each
interval and the frequency of data
points within each interval. This
process is more efficient than for
ungrouped data.
UNGROUPED DATA
Ungrouped data is a set of raw data
without any organization. To
calculate variance and standard
deviation for ungrouped data, we use
formulas that involve finding the
mean and the difference between
each data point and the mean. This
process can be time- consuming for
large datasets.
DEFINITION
UNGROUPED DATA
VARIANCE
FORMULA
STANDARD DEVIATION
N
N
N
N
= (22 + 24 + 21 + 21 + 25 + 26 + 22)/7
A dataset of temperature in degree Celsius (°C) was recorded for a period of seven
days: Monday - 22°C, Tuesday - 24°C, Wednesday - 21°C, Thursday - 21°C, Friday -
25°C, Saturday - 26°C, Sunday - 22°C. Find the average temperature, variance, and
standard deviation.
EXAMPLE:
Variance Standard Deviation
= 7
= 23°C
A dataset of temperature in degree Celsius (°C) was recorded for a period of seven
days: Monday - 22°C, Tuesday - 24°C, Wednesday - 21°C, Thursday - 21°C, Friday -
25°C, Saturday - 26°C, Sunday - 22°C
EXAMPLE:
TEMPERATURE (°C)
22 23 -1 1
24 23 1 1
21 23 -2 4
21 23 -2 4
25 23 2 4
26 23 3 9
22 23 -1 1
24
A dataset of temperature in degree Celsius (°C) was recorded for a period of seven
days: Monday - 22°C, Tuesday - 24°C, Wednesday - 21°C, Thursday - 21°C, Friday -
25°C, Saturday - 26°C, Sunday - 22°C
EXAMPLE:
= 24 / (7-1)
= 4
= 4
= 2 °C
Variance Standard Deviation
GROUPED DATA
STANDARD DEVIATION
VARIANCE
FORMULA
N
N
N
N
A dataset of temperature in degree Celsius (°C) was recorded for a period of a month.
Find the average temperature, variance, and standard deviation.
EXAMPLE:
CLASS (°C) FREQUENCY (f)
20-21 3
22-23 6
24-25 8
26-27 9
28-29 4
A dataset of temperature in degree Celsius (°C) was recorded for a period of a month.
Find the average temperature in a year, variance, and standard deviation.
EXAMPLE:
CLASS (°C) FREQUENCY (f) MIDPOINT (m) f (m)
20-21 3 20.5 61.5
22-23 6 22.5 135
24-25 8 24.5 196
26-27 9 26.5 238.5
28-29 4 28.5 114
∑ f 30 ∑ fm 745
= ∑ fm / ∑ f
= 745 / 30
= 24.83
A dataset of temperature in degree Celsius (°C) was recorded for a period of a month.
Find the average temperature in a year, variance, and standard deviation.
EXAMPLE:
CLASS (°C) FREQUENCY (f) MIDPOINT (m)
20-21 3 20.5 24.83 -4.33 18.7489 56.2467
22-23 6 22.5 24.83 -2.33 5.4289 32.5734
24-25 8 24.5 24.83 -0.33 0.1089 0.8712
26-27 9 26.5 24.83 1.67 2.7889 25.1001
28-29 4 28.5 24.83 3.67 13.4689 53.8756
∑ f 30 168.667
n = ∑ f
= 30
A dataset of temperature in degree Celsius (°C) was recorded for a period of a month.
Find the average temperature in a year, variance, and standard deviation.
EXAMPLE:
Variance Standard Deviation
= 168.667 / (30-1)
= 5.82
= 5.82
= 2.41 °C

VARIANCE AND STANDARD DEVIATION Statistics

  • 1.
  • 2.
    STANDARD DEVIATION Standard deviationis also a measure of how spread out a set of data from their mean or average value. It is calculated by finding the square root of the variance. VARIANCE Variance is a measure of how spread out a set of data from their mean or average value. Also known as squared deviation. It is calculated by finding the average of the squared differences between each data point and the mean. DEFINITION
  • 3.
    GROUPED DATA Grouped datais a set of data that has been organized into intervals or classes. To calculate variance and standard deviation for grouped data, we use formulas that involve finding the midpoint of each interval and the frequency of data points within each interval. This process is more efficient than for ungrouped data. UNGROUPED DATA Ungrouped data is a set of raw data without any organization. To calculate variance and standard deviation for ungrouped data, we use formulas that involve finding the mean and the difference between each data point and the mean. This process can be time- consuming for large datasets. DEFINITION
  • 4.
  • 5.
  • 6.
    = (22 +24 + 21 + 21 + 25 + 26 + 22)/7 A dataset of temperature in degree Celsius (°C) was recorded for a period of seven days: Monday - 22°C, Tuesday - 24°C, Wednesday - 21°C, Thursday - 21°C, Friday - 25°C, Saturday - 26°C, Sunday - 22°C. Find the average temperature, variance, and standard deviation. EXAMPLE: Variance Standard Deviation = 7 = 23°C
  • 7.
    A dataset oftemperature in degree Celsius (°C) was recorded for a period of seven days: Monday - 22°C, Tuesday - 24°C, Wednesday - 21°C, Thursday - 21°C, Friday - 25°C, Saturday - 26°C, Sunday - 22°C EXAMPLE: TEMPERATURE (°C) 22 23 -1 1 24 23 1 1 21 23 -2 4 21 23 -2 4 25 23 2 4 26 23 3 9 22 23 -1 1 24
  • 8.
    A dataset oftemperature in degree Celsius (°C) was recorded for a period of seven days: Monday - 22°C, Tuesday - 24°C, Wednesday - 21°C, Thursday - 21°C, Friday - 25°C, Saturday - 26°C, Sunday - 22°C EXAMPLE: = 24 / (7-1) = 4 = 4 = 2 °C Variance Standard Deviation
  • 9.
  • 10.
  • 11.
    A dataset oftemperature in degree Celsius (°C) was recorded for a period of a month. Find the average temperature, variance, and standard deviation. EXAMPLE: CLASS (°C) FREQUENCY (f) 20-21 3 22-23 6 24-25 8 26-27 9 28-29 4
  • 12.
    A dataset oftemperature in degree Celsius (°C) was recorded for a period of a month. Find the average temperature in a year, variance, and standard deviation. EXAMPLE: CLASS (°C) FREQUENCY (f) MIDPOINT (m) f (m) 20-21 3 20.5 61.5 22-23 6 22.5 135 24-25 8 24.5 196 26-27 9 26.5 238.5 28-29 4 28.5 114 ∑ f 30 ∑ fm 745 = ∑ fm / ∑ f = 745 / 30 = 24.83
  • 13.
    A dataset oftemperature in degree Celsius (°C) was recorded for a period of a month. Find the average temperature in a year, variance, and standard deviation. EXAMPLE: CLASS (°C) FREQUENCY (f) MIDPOINT (m) 20-21 3 20.5 24.83 -4.33 18.7489 56.2467 22-23 6 22.5 24.83 -2.33 5.4289 32.5734 24-25 8 24.5 24.83 -0.33 0.1089 0.8712 26-27 9 26.5 24.83 1.67 2.7889 25.1001 28-29 4 28.5 24.83 3.67 13.4689 53.8756 ∑ f 30 168.667 n = ∑ f = 30
  • 14.
    A dataset oftemperature in degree Celsius (°C) was recorded for a period of a month. Find the average temperature in a year, variance, and standard deviation. EXAMPLE: Variance Standard Deviation = 168.667 / (30-1) = 5.82 = 5.82 = 2.41 °C