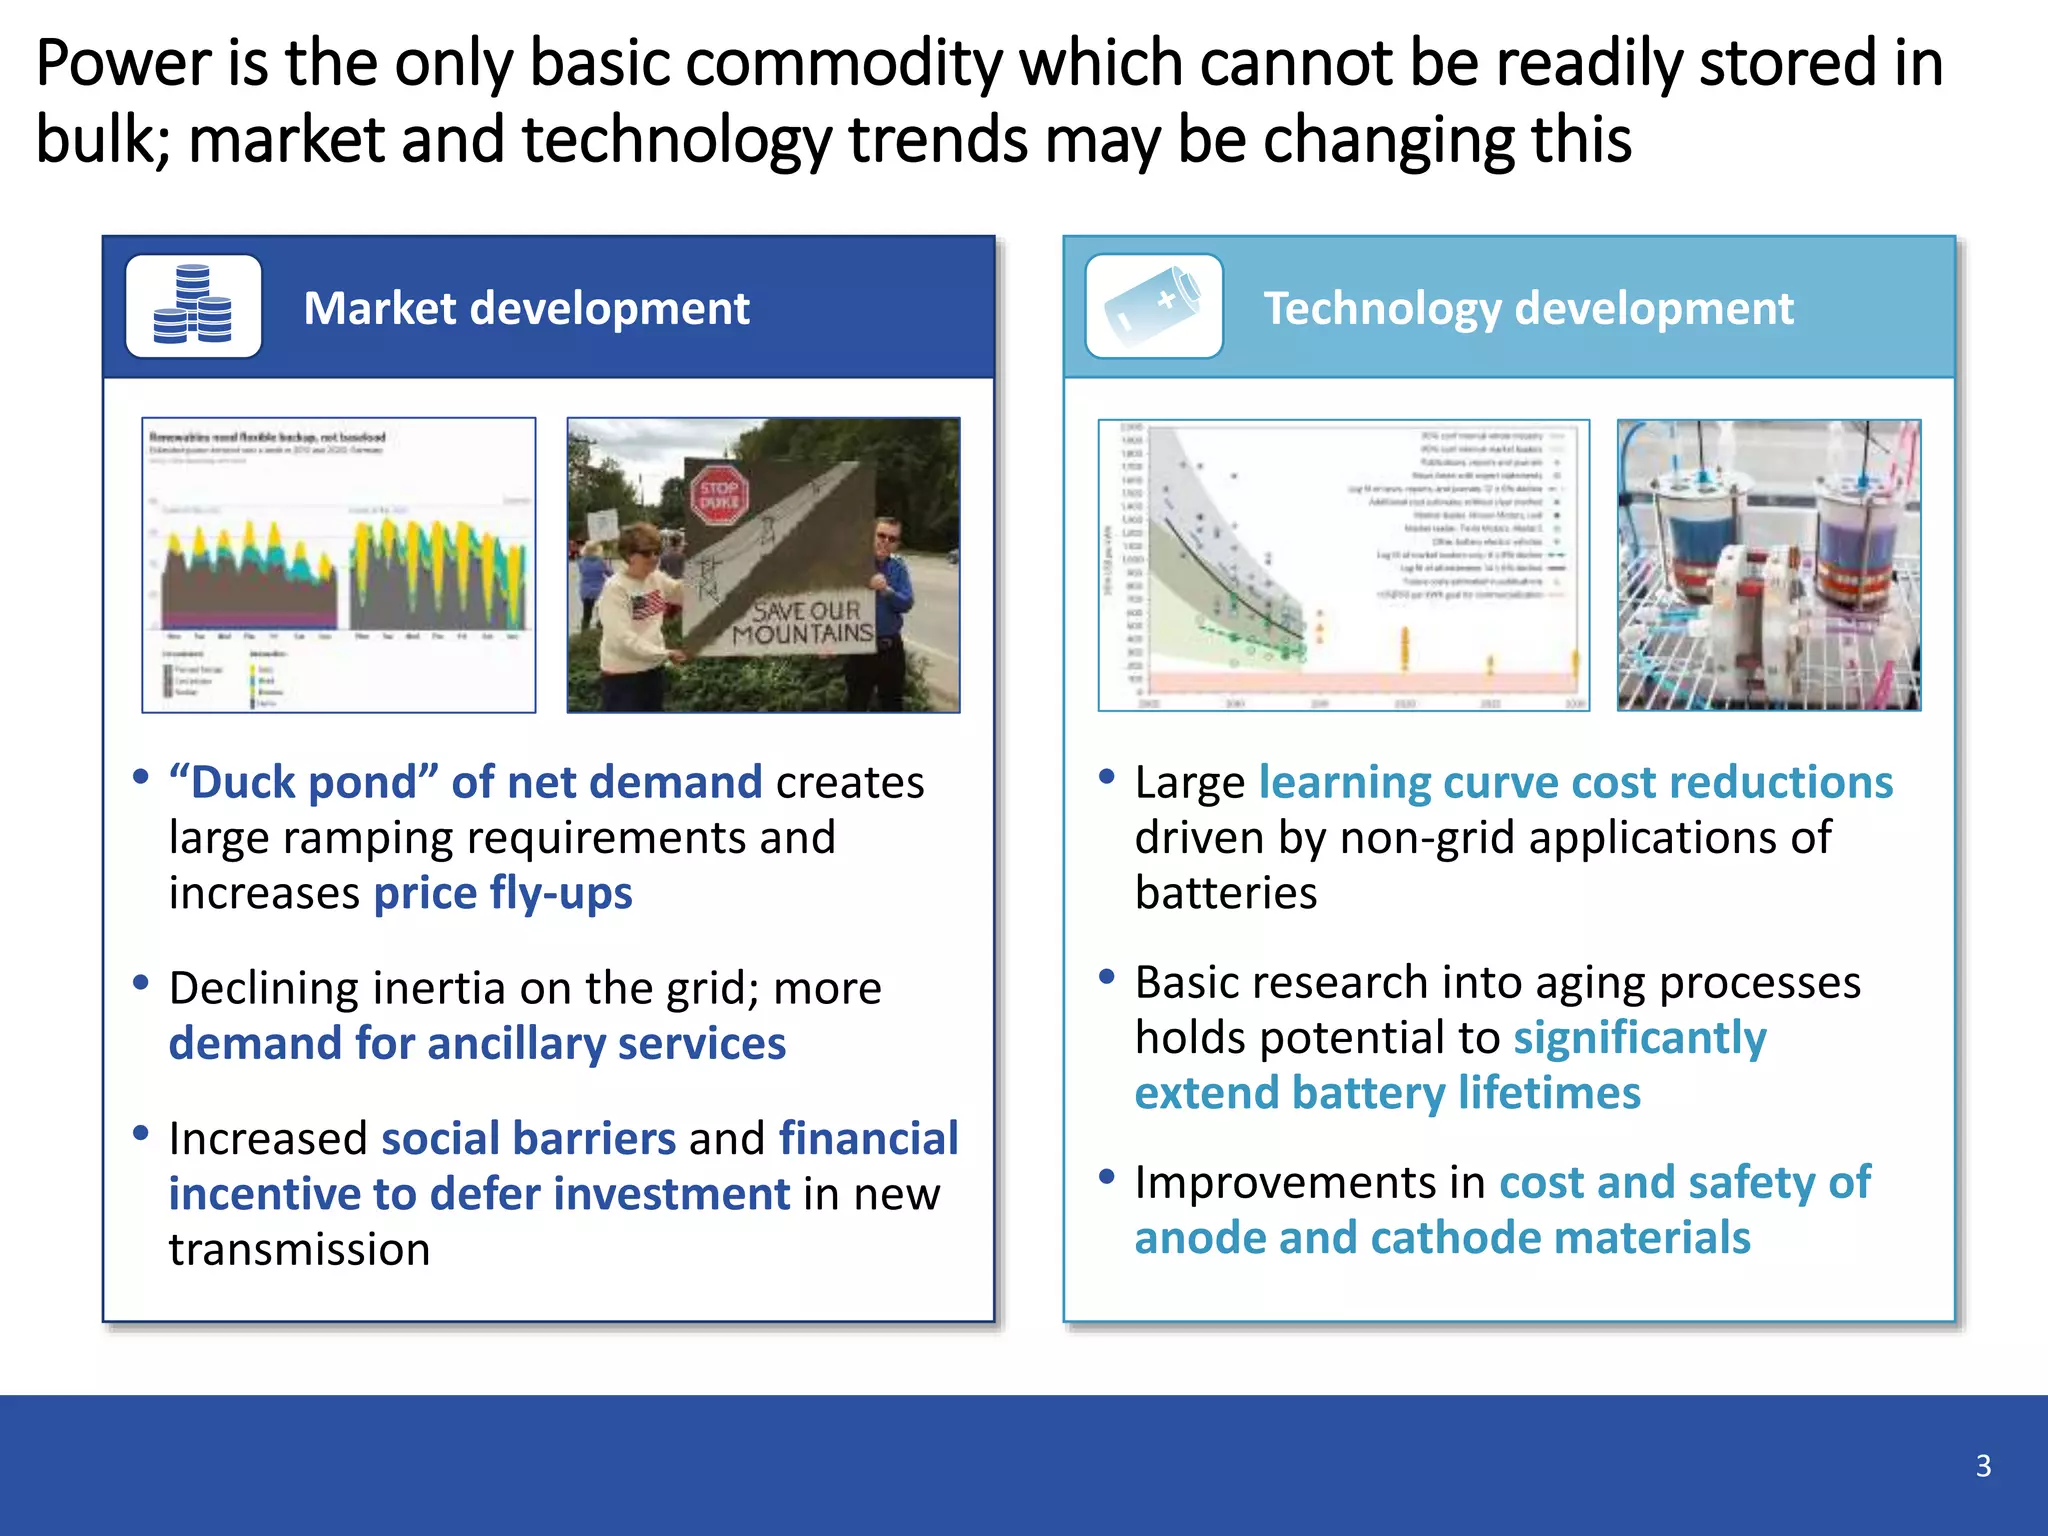
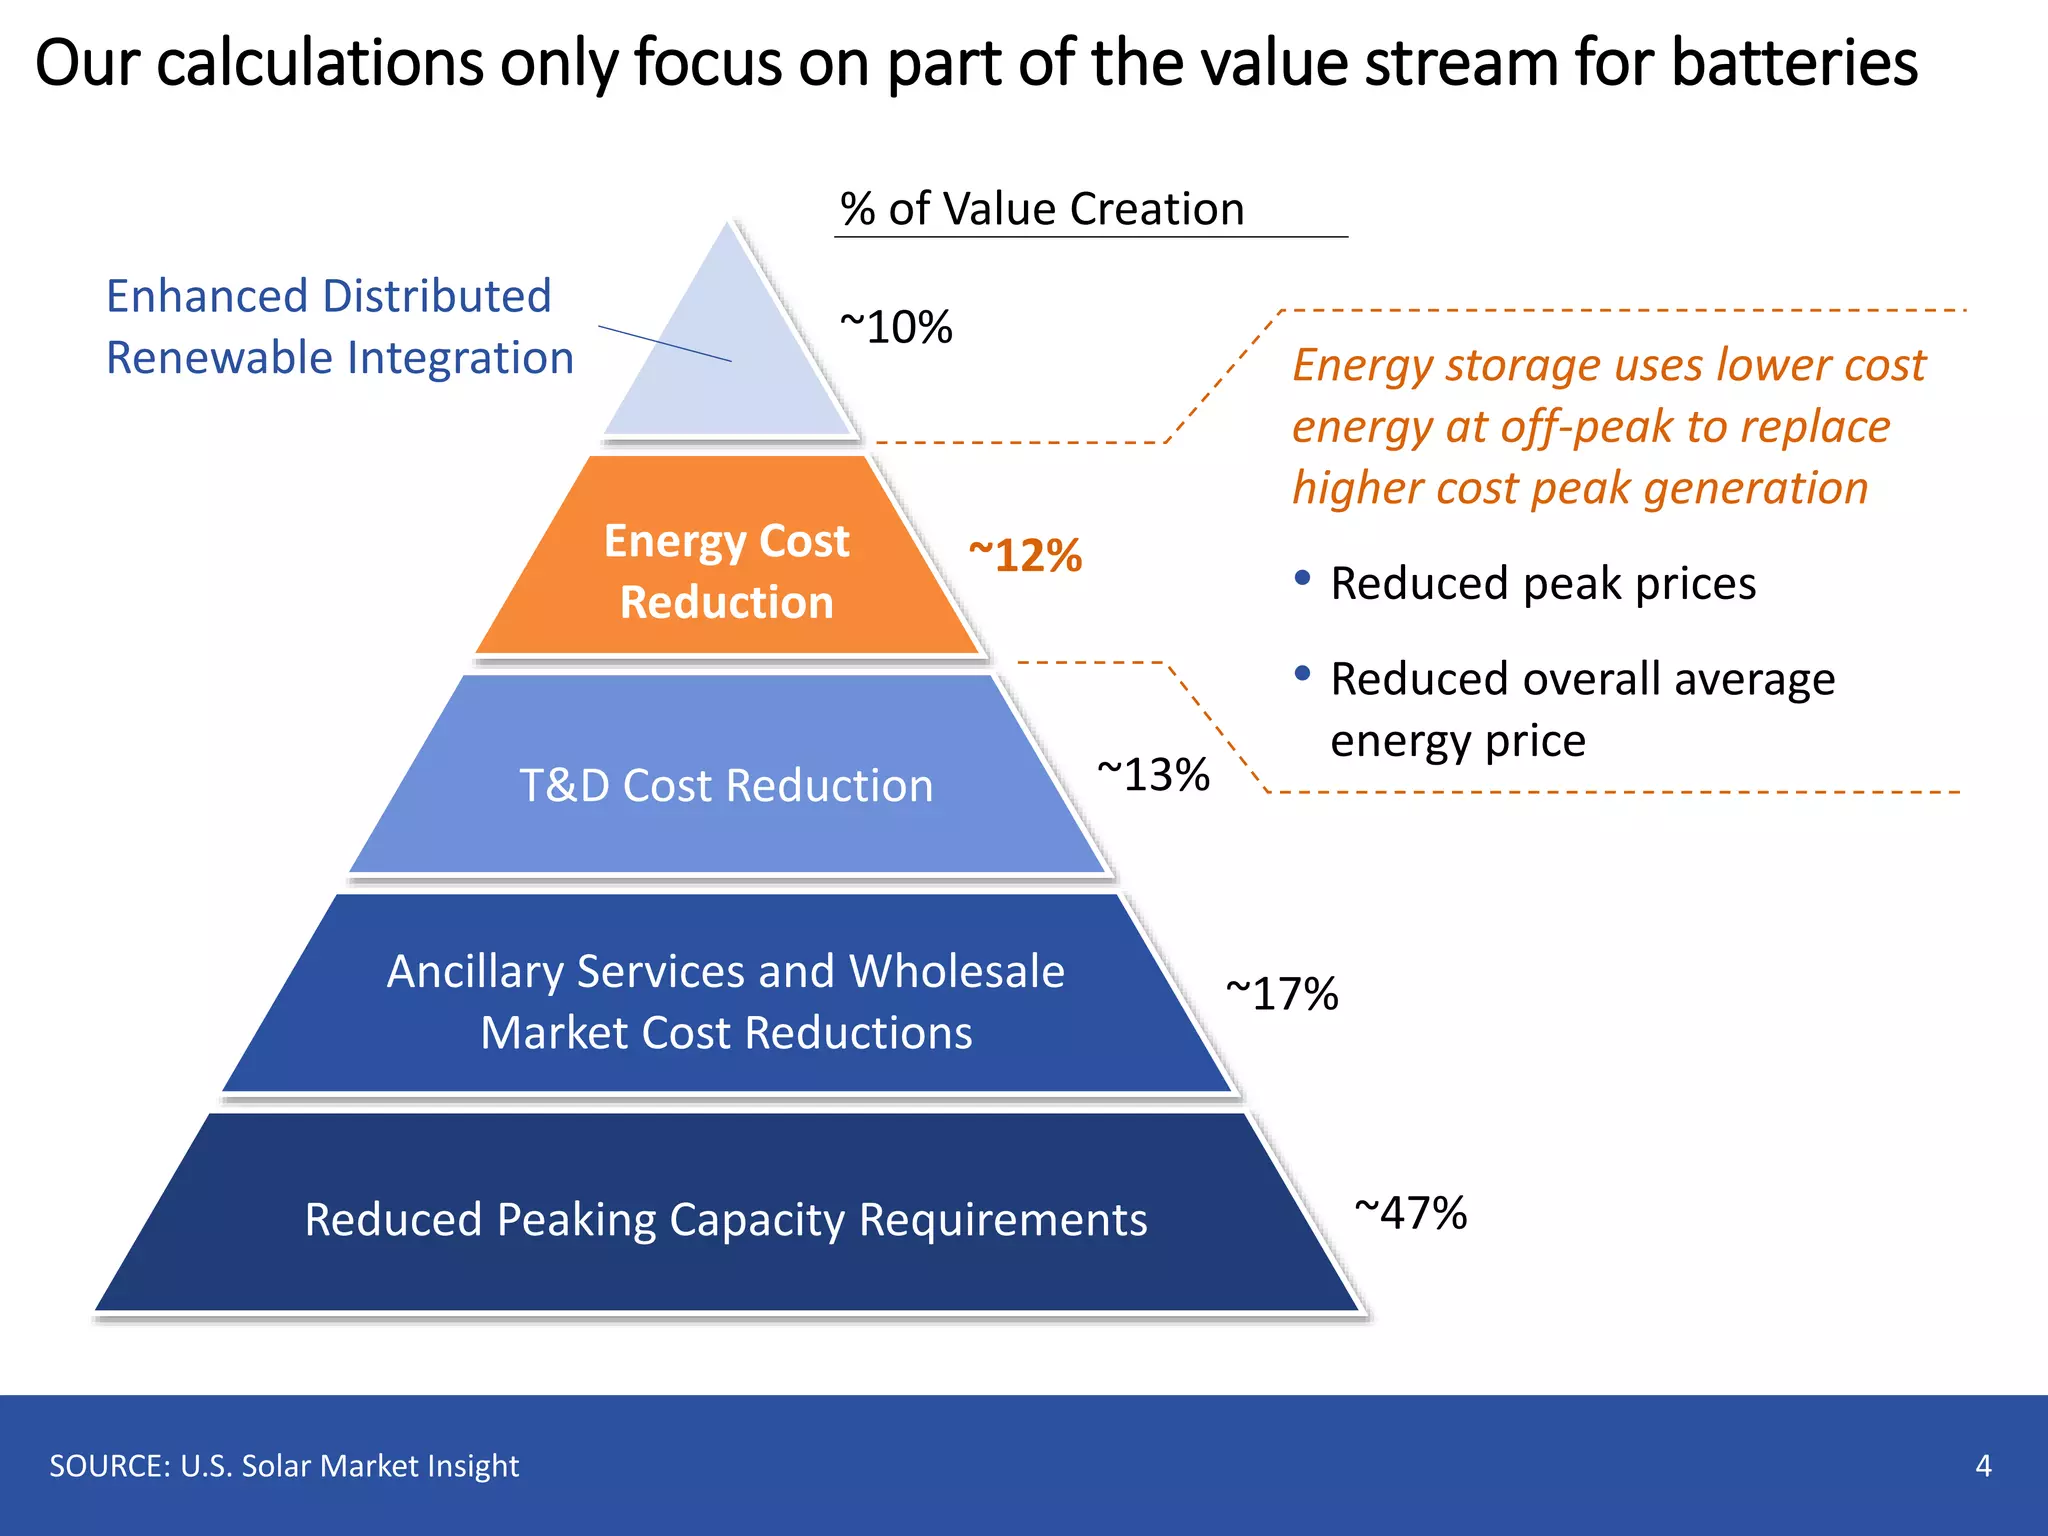
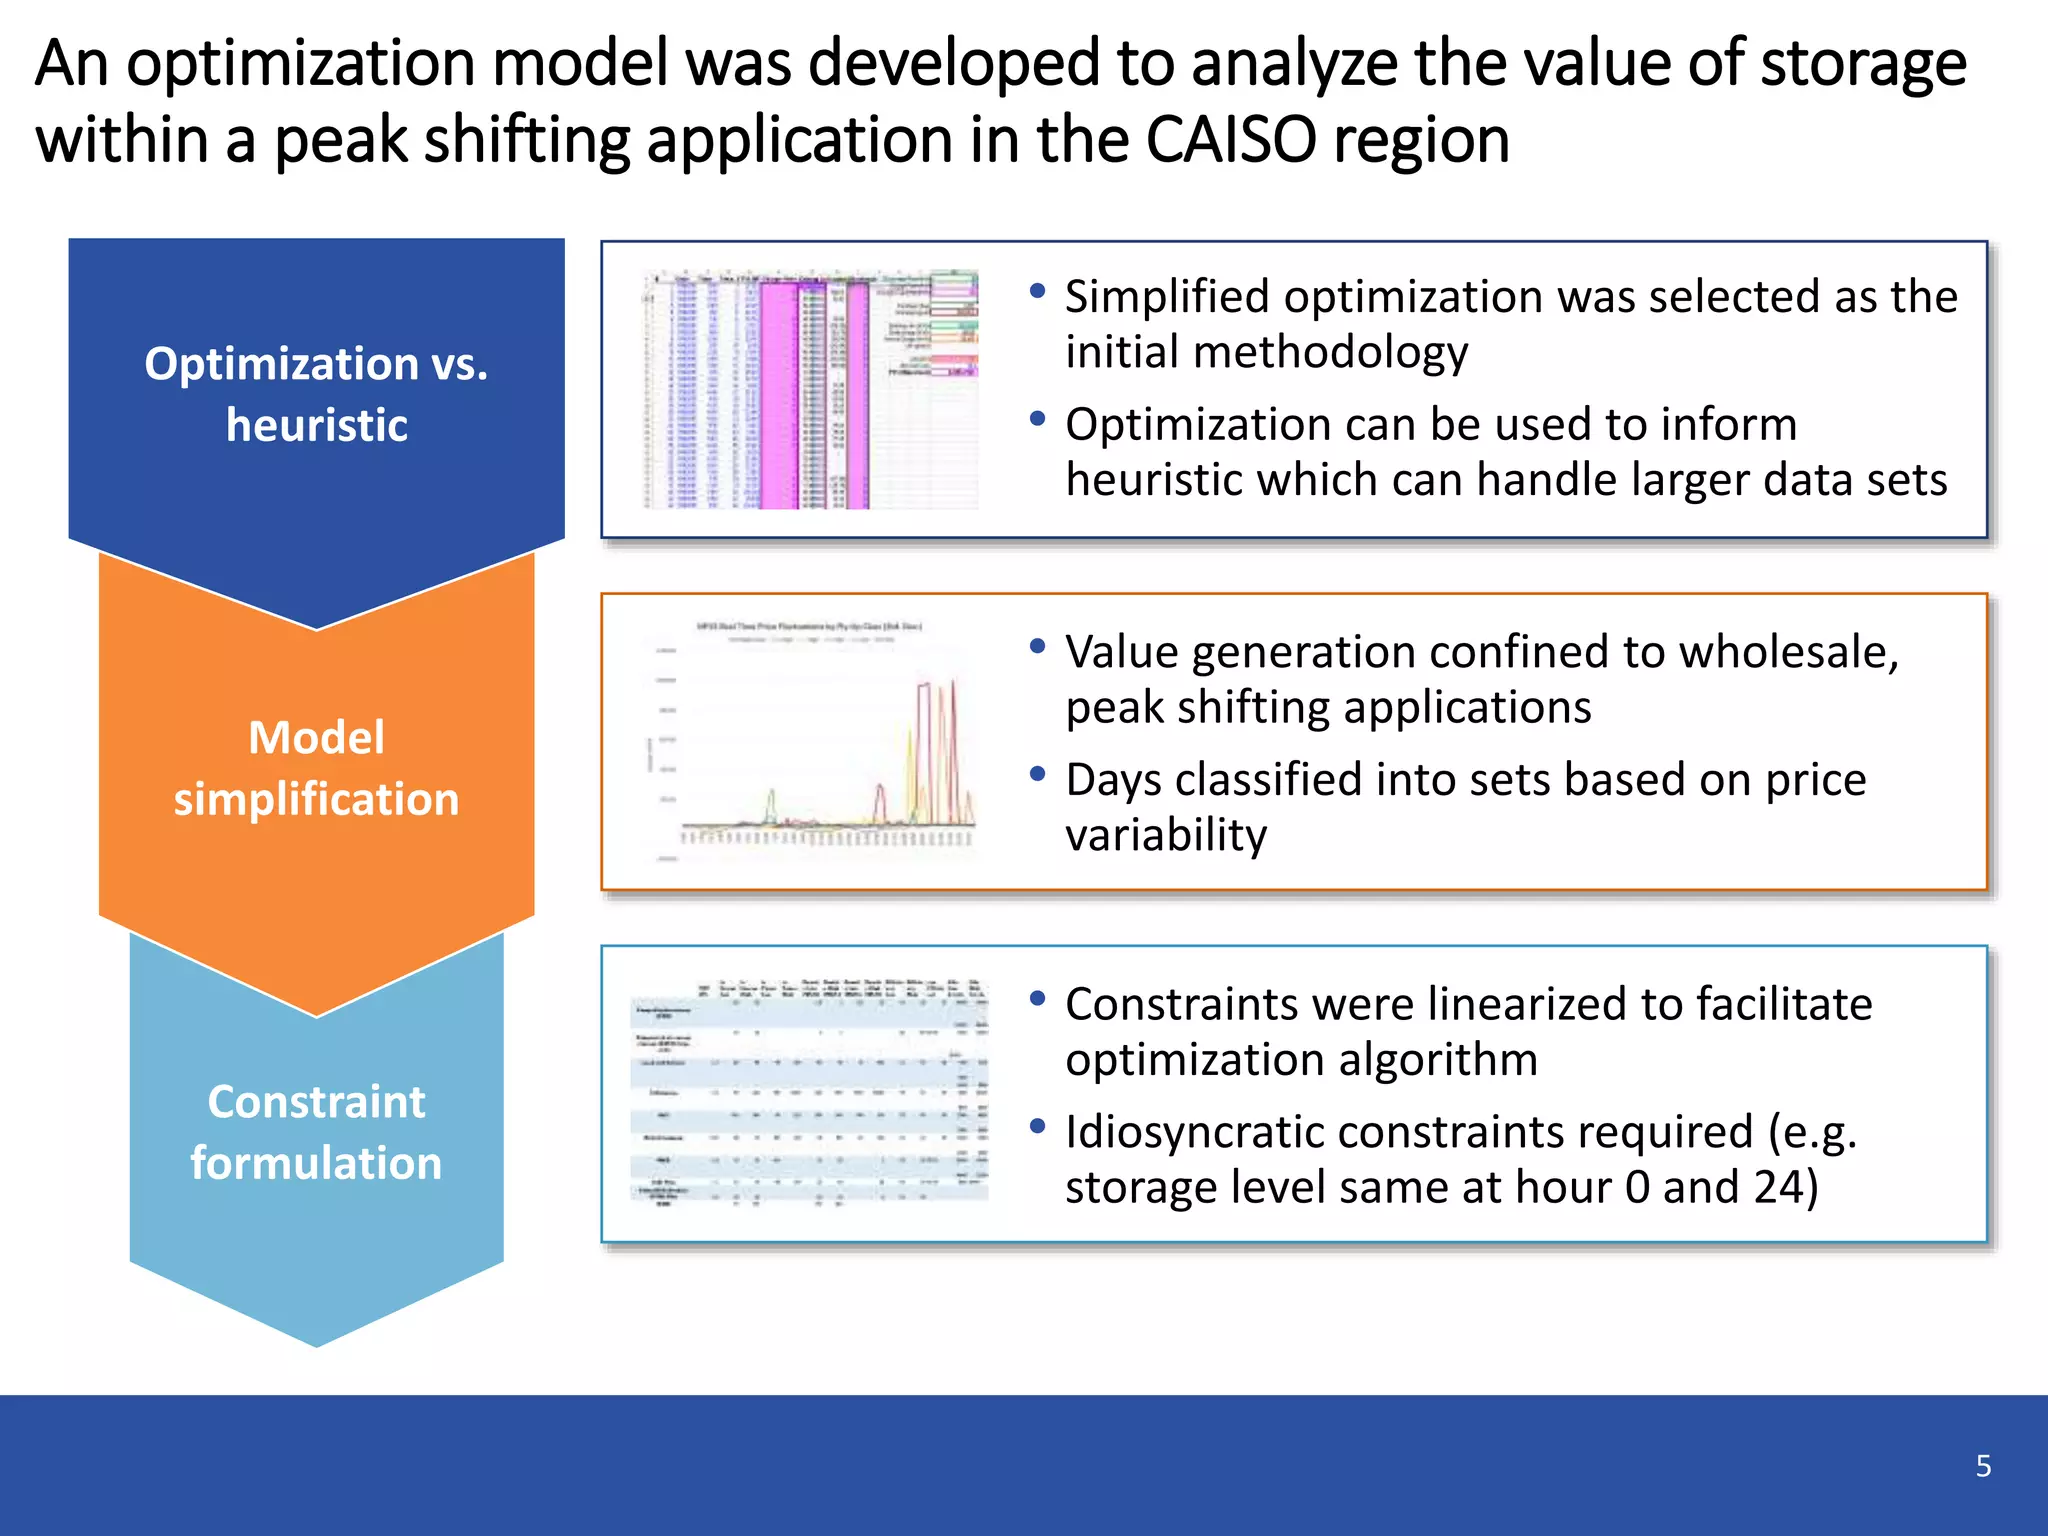
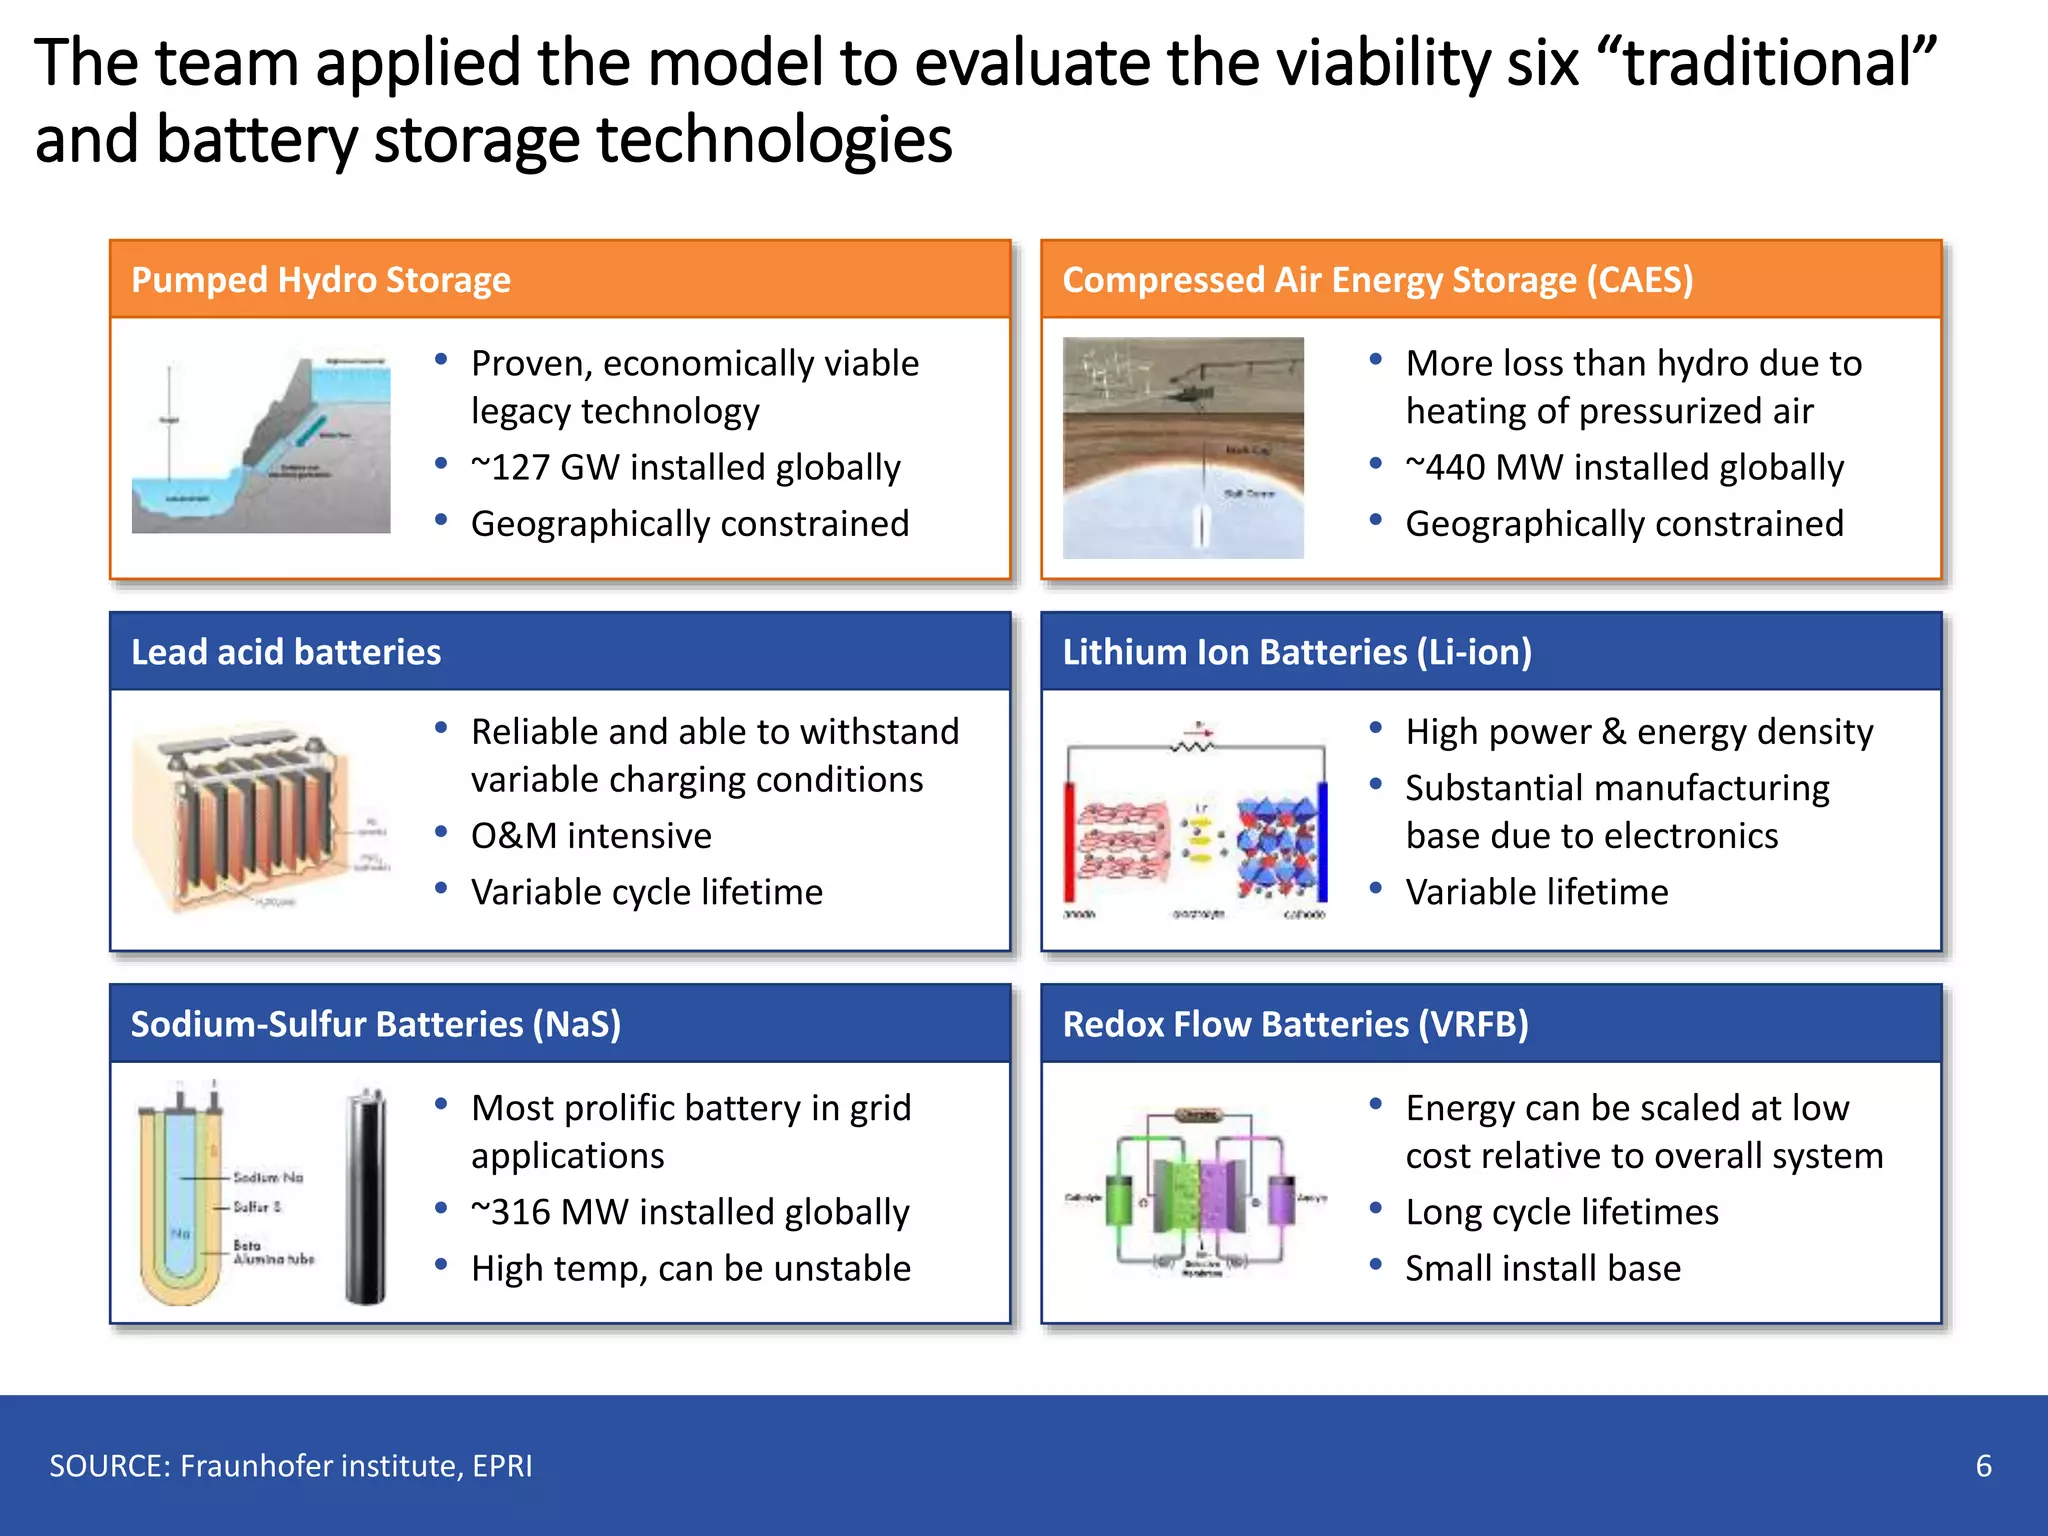
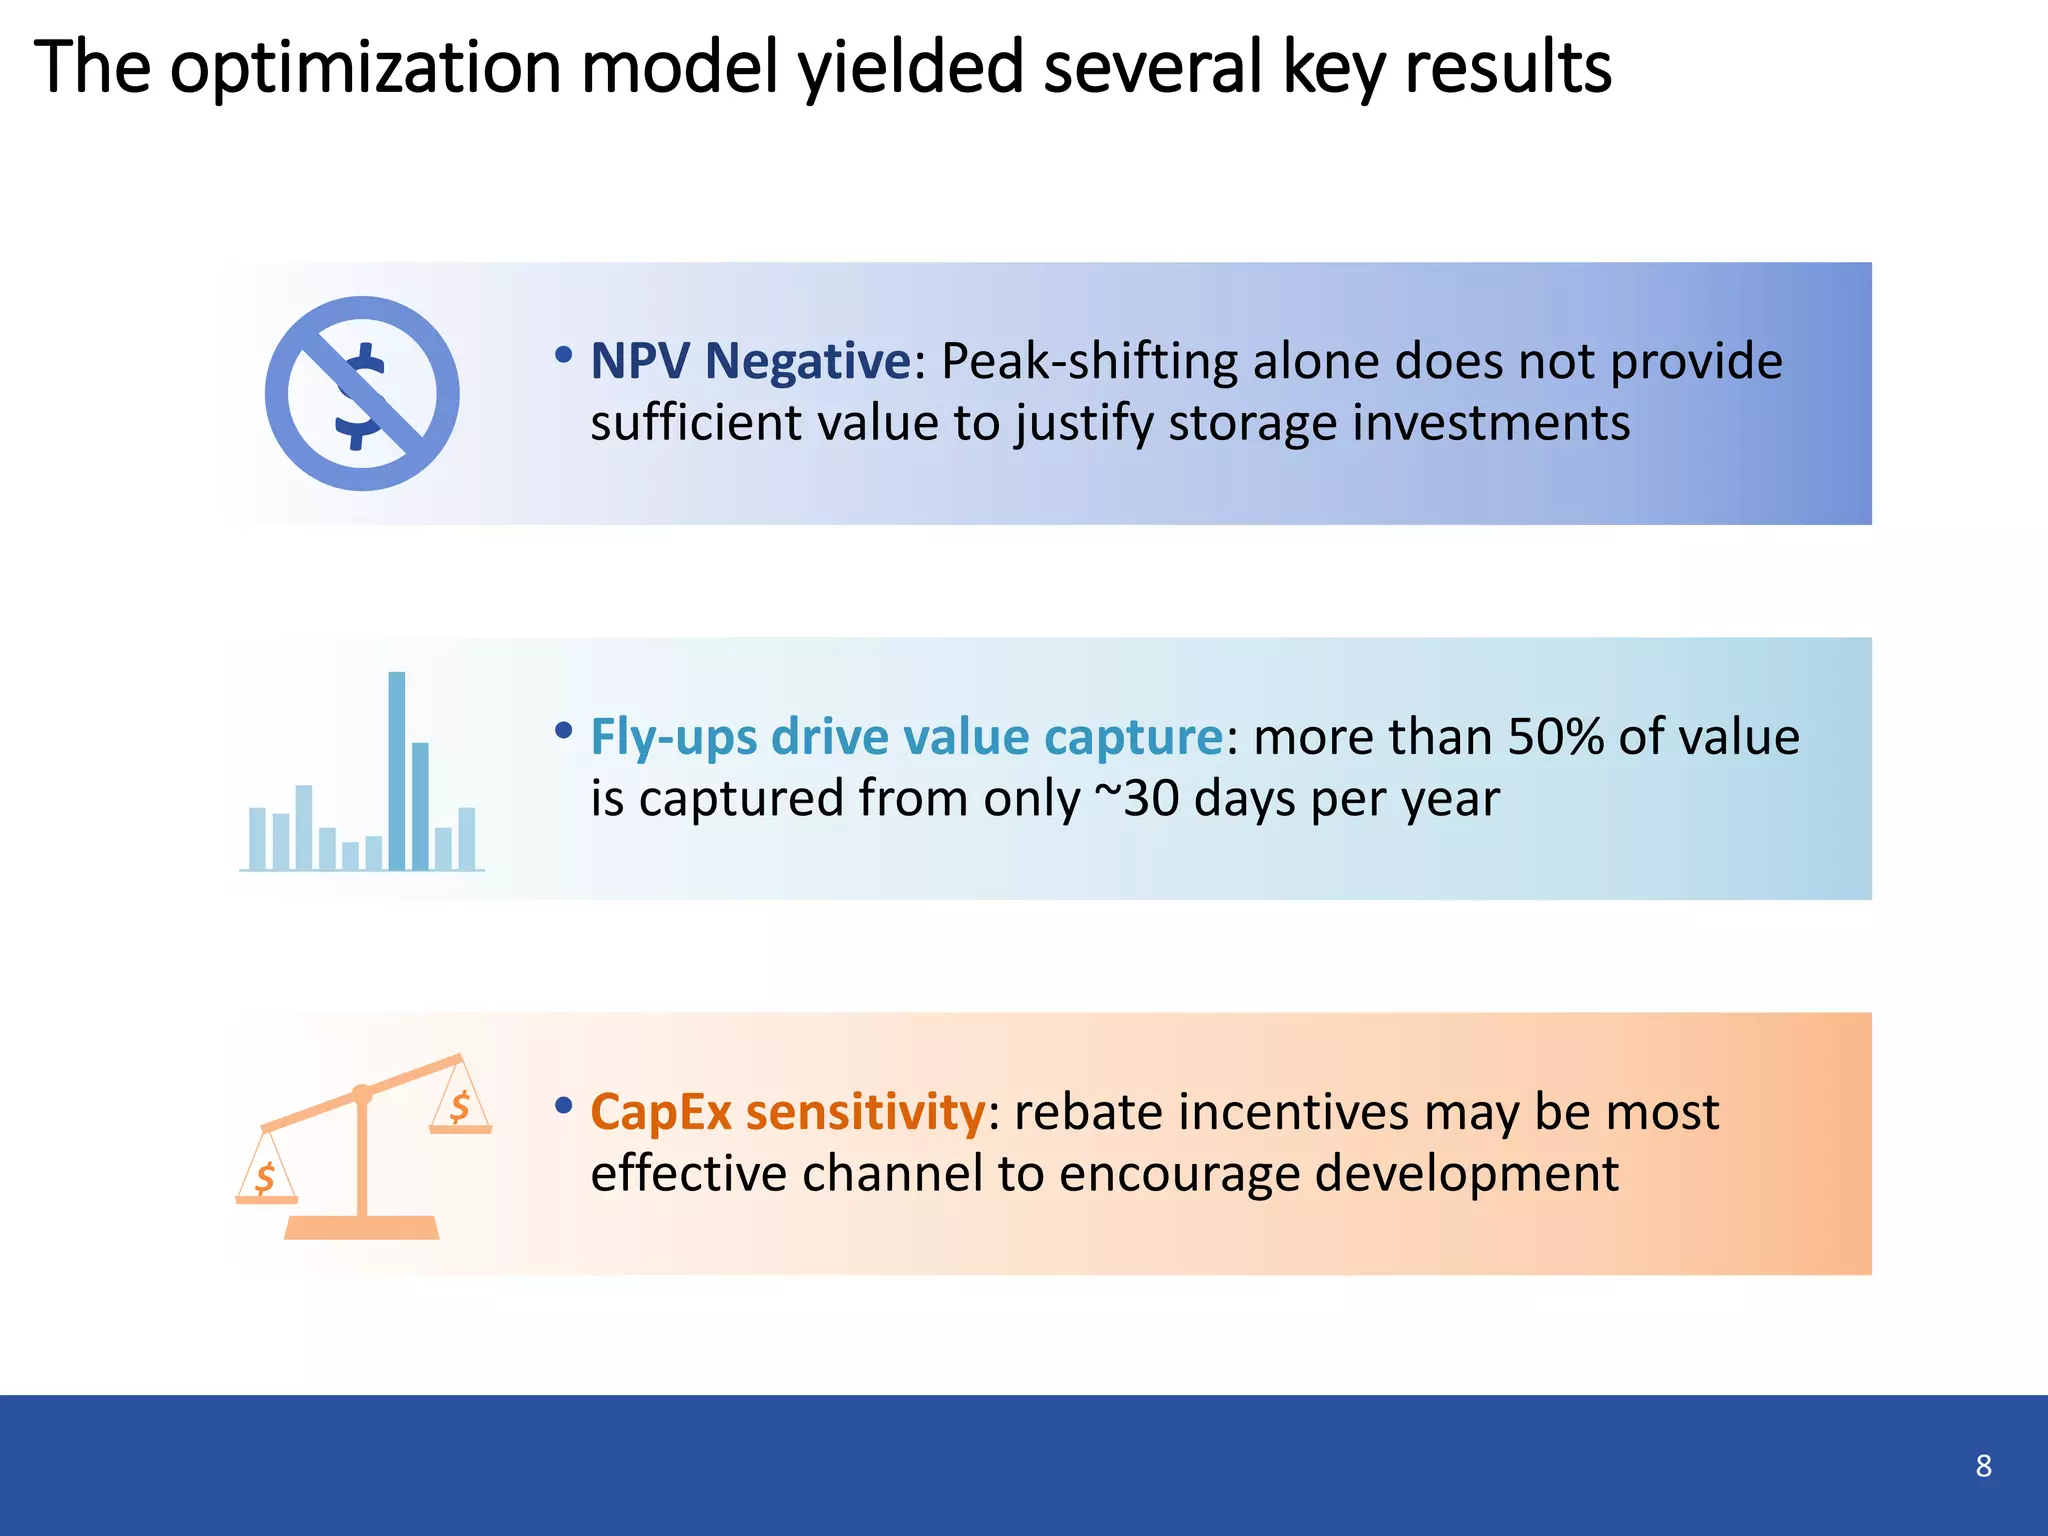
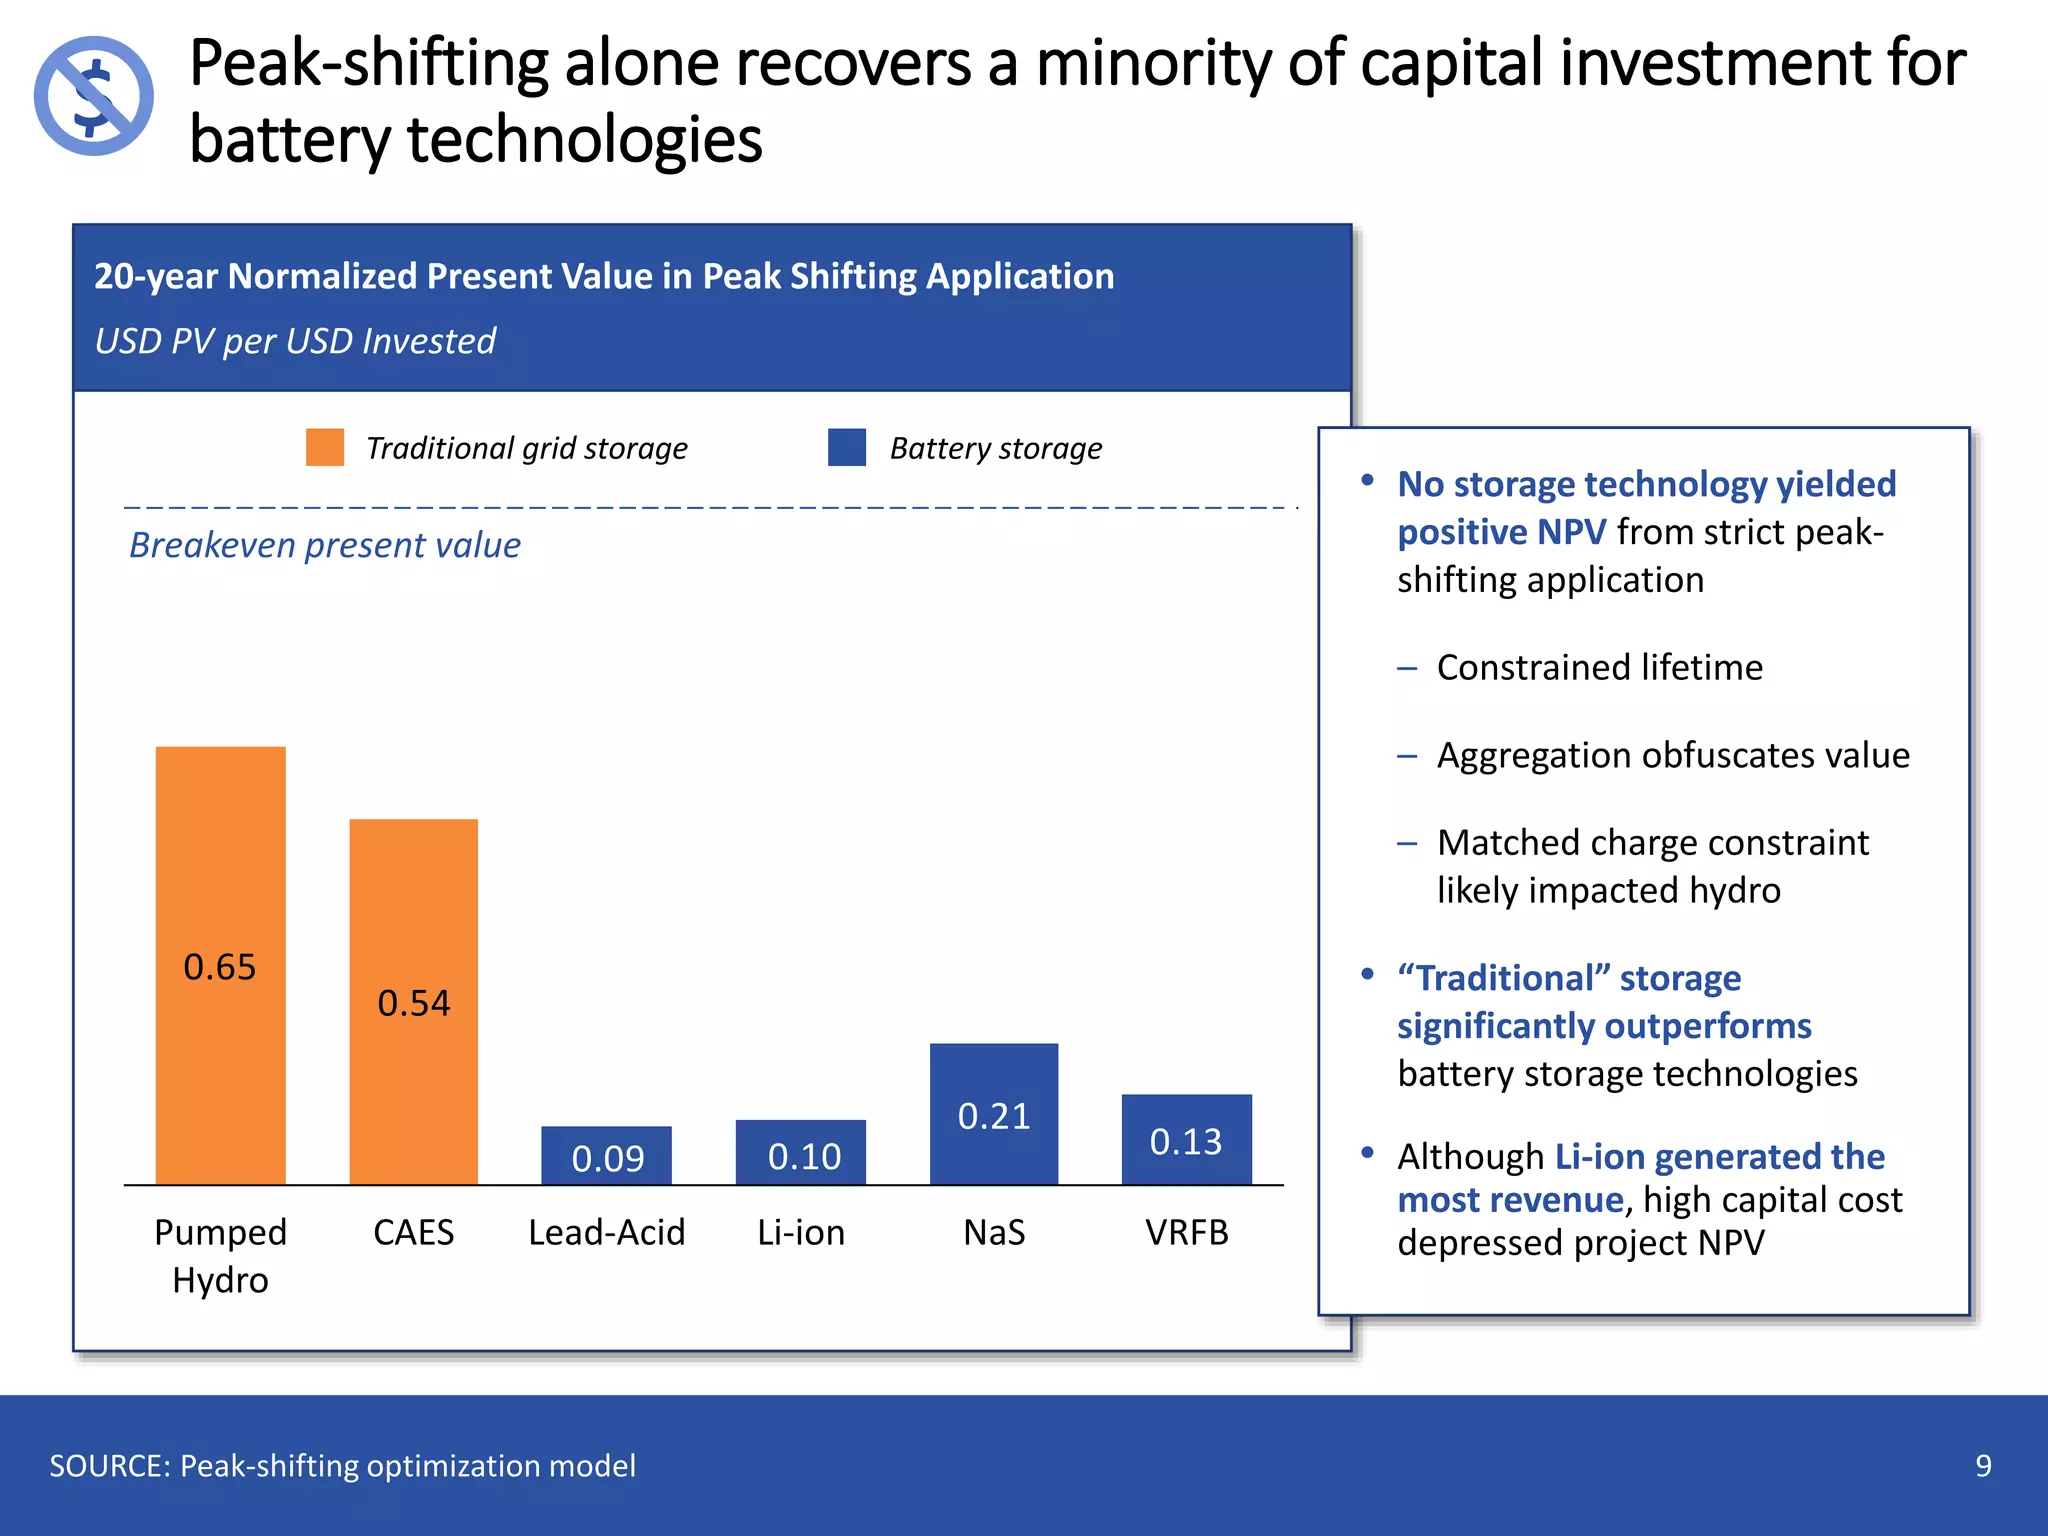
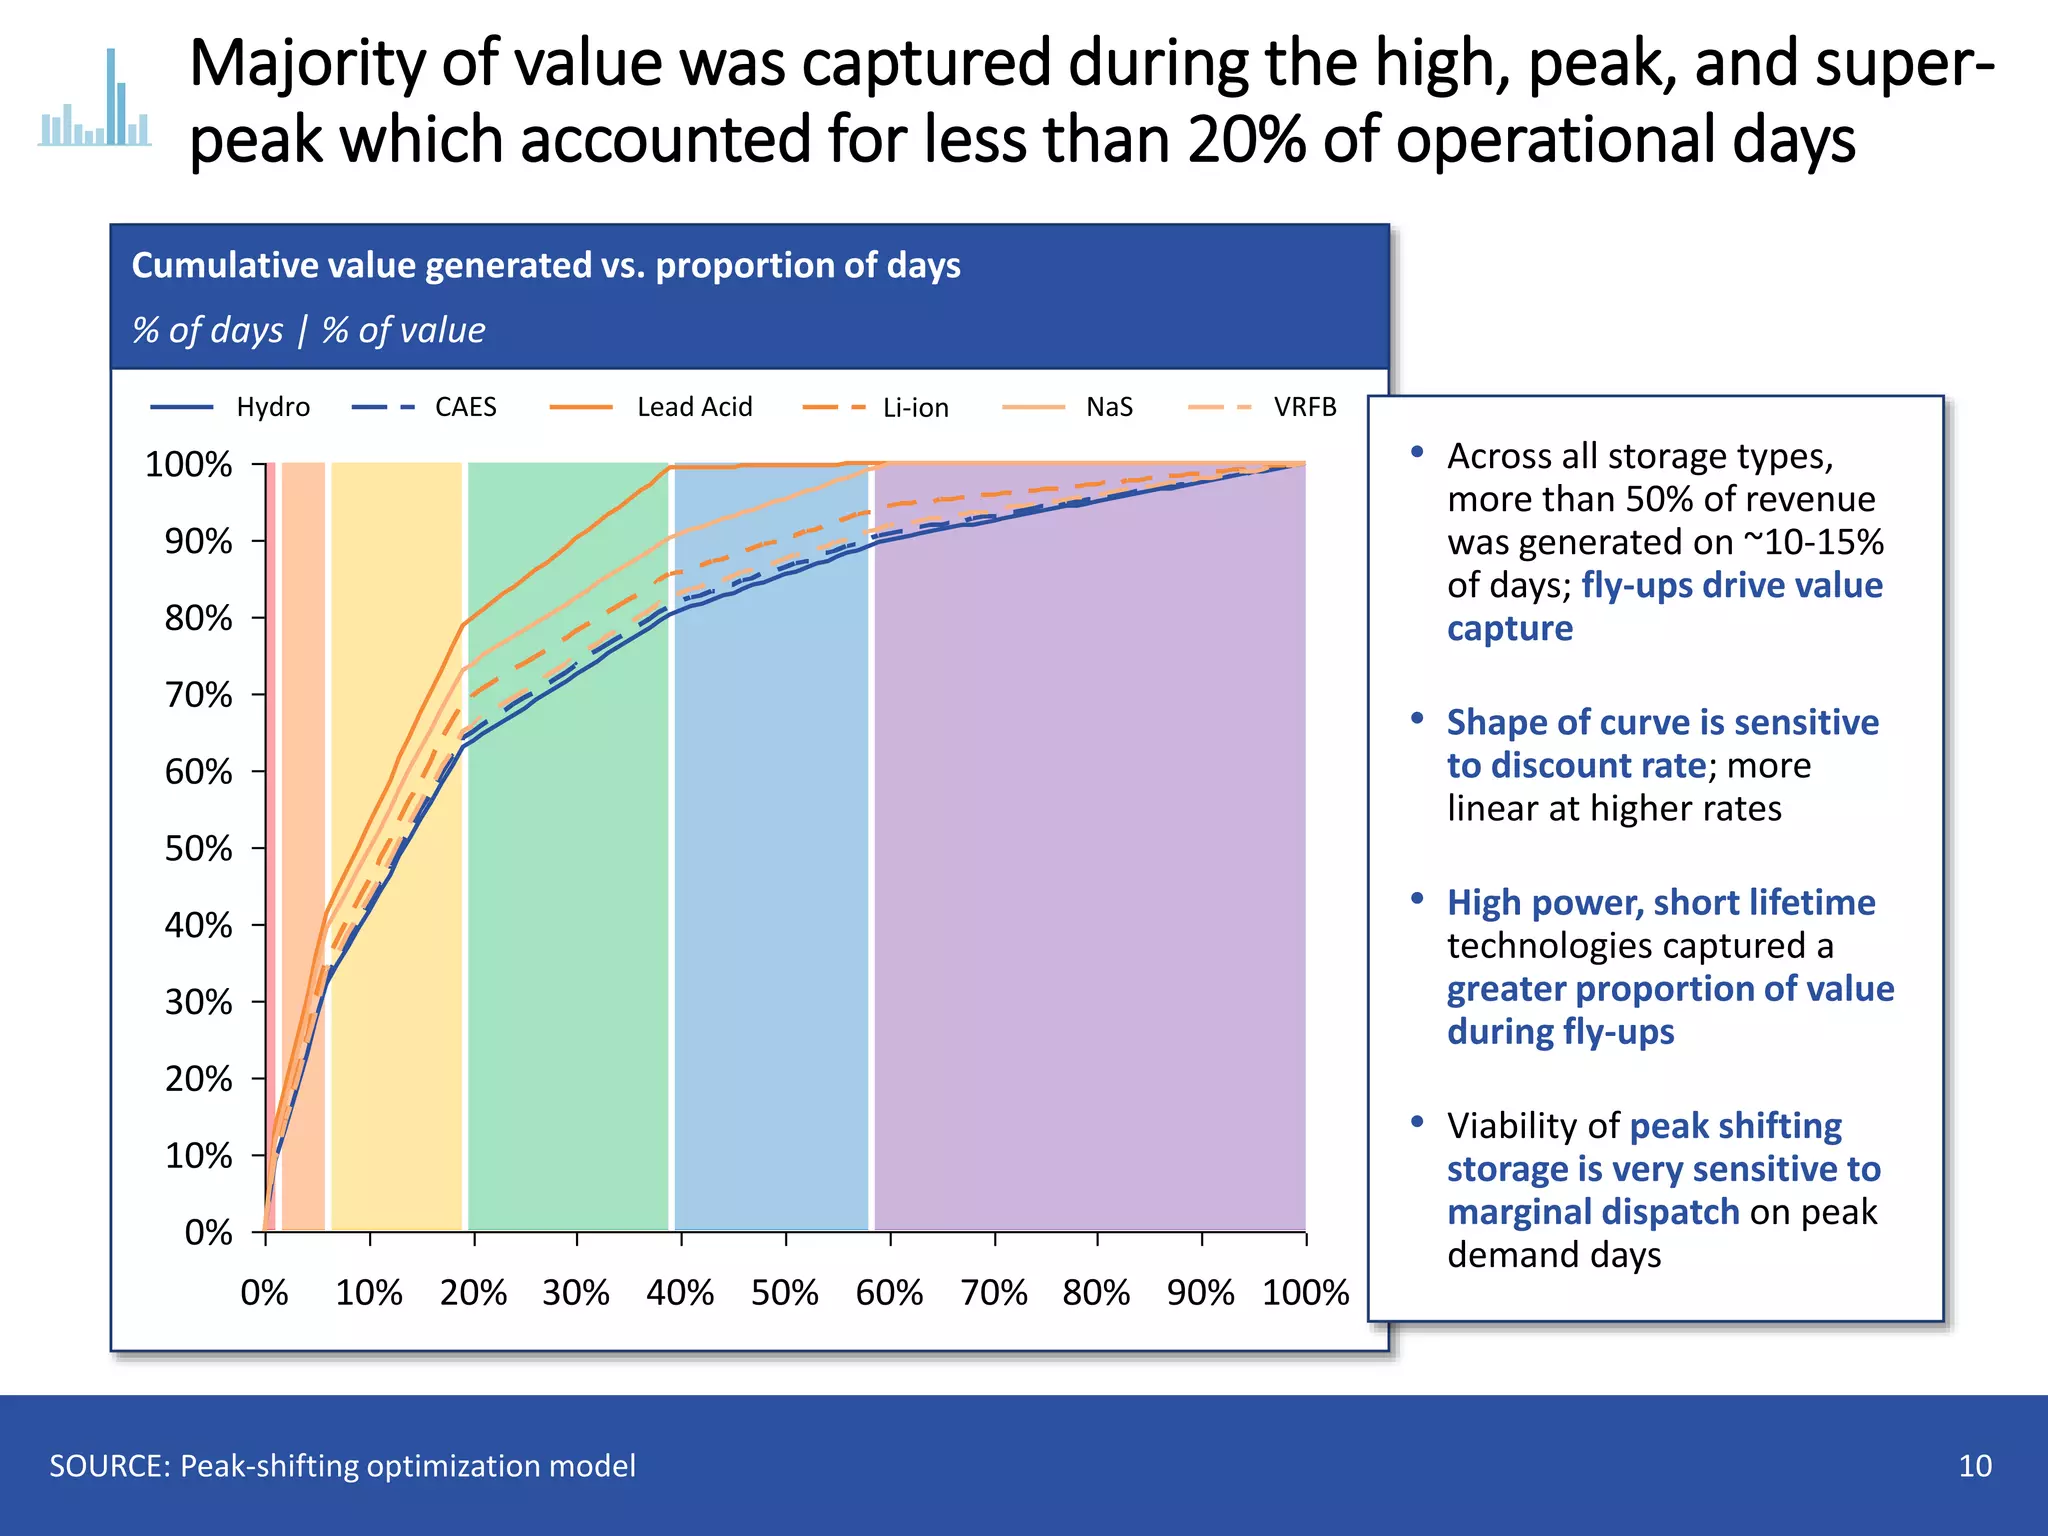
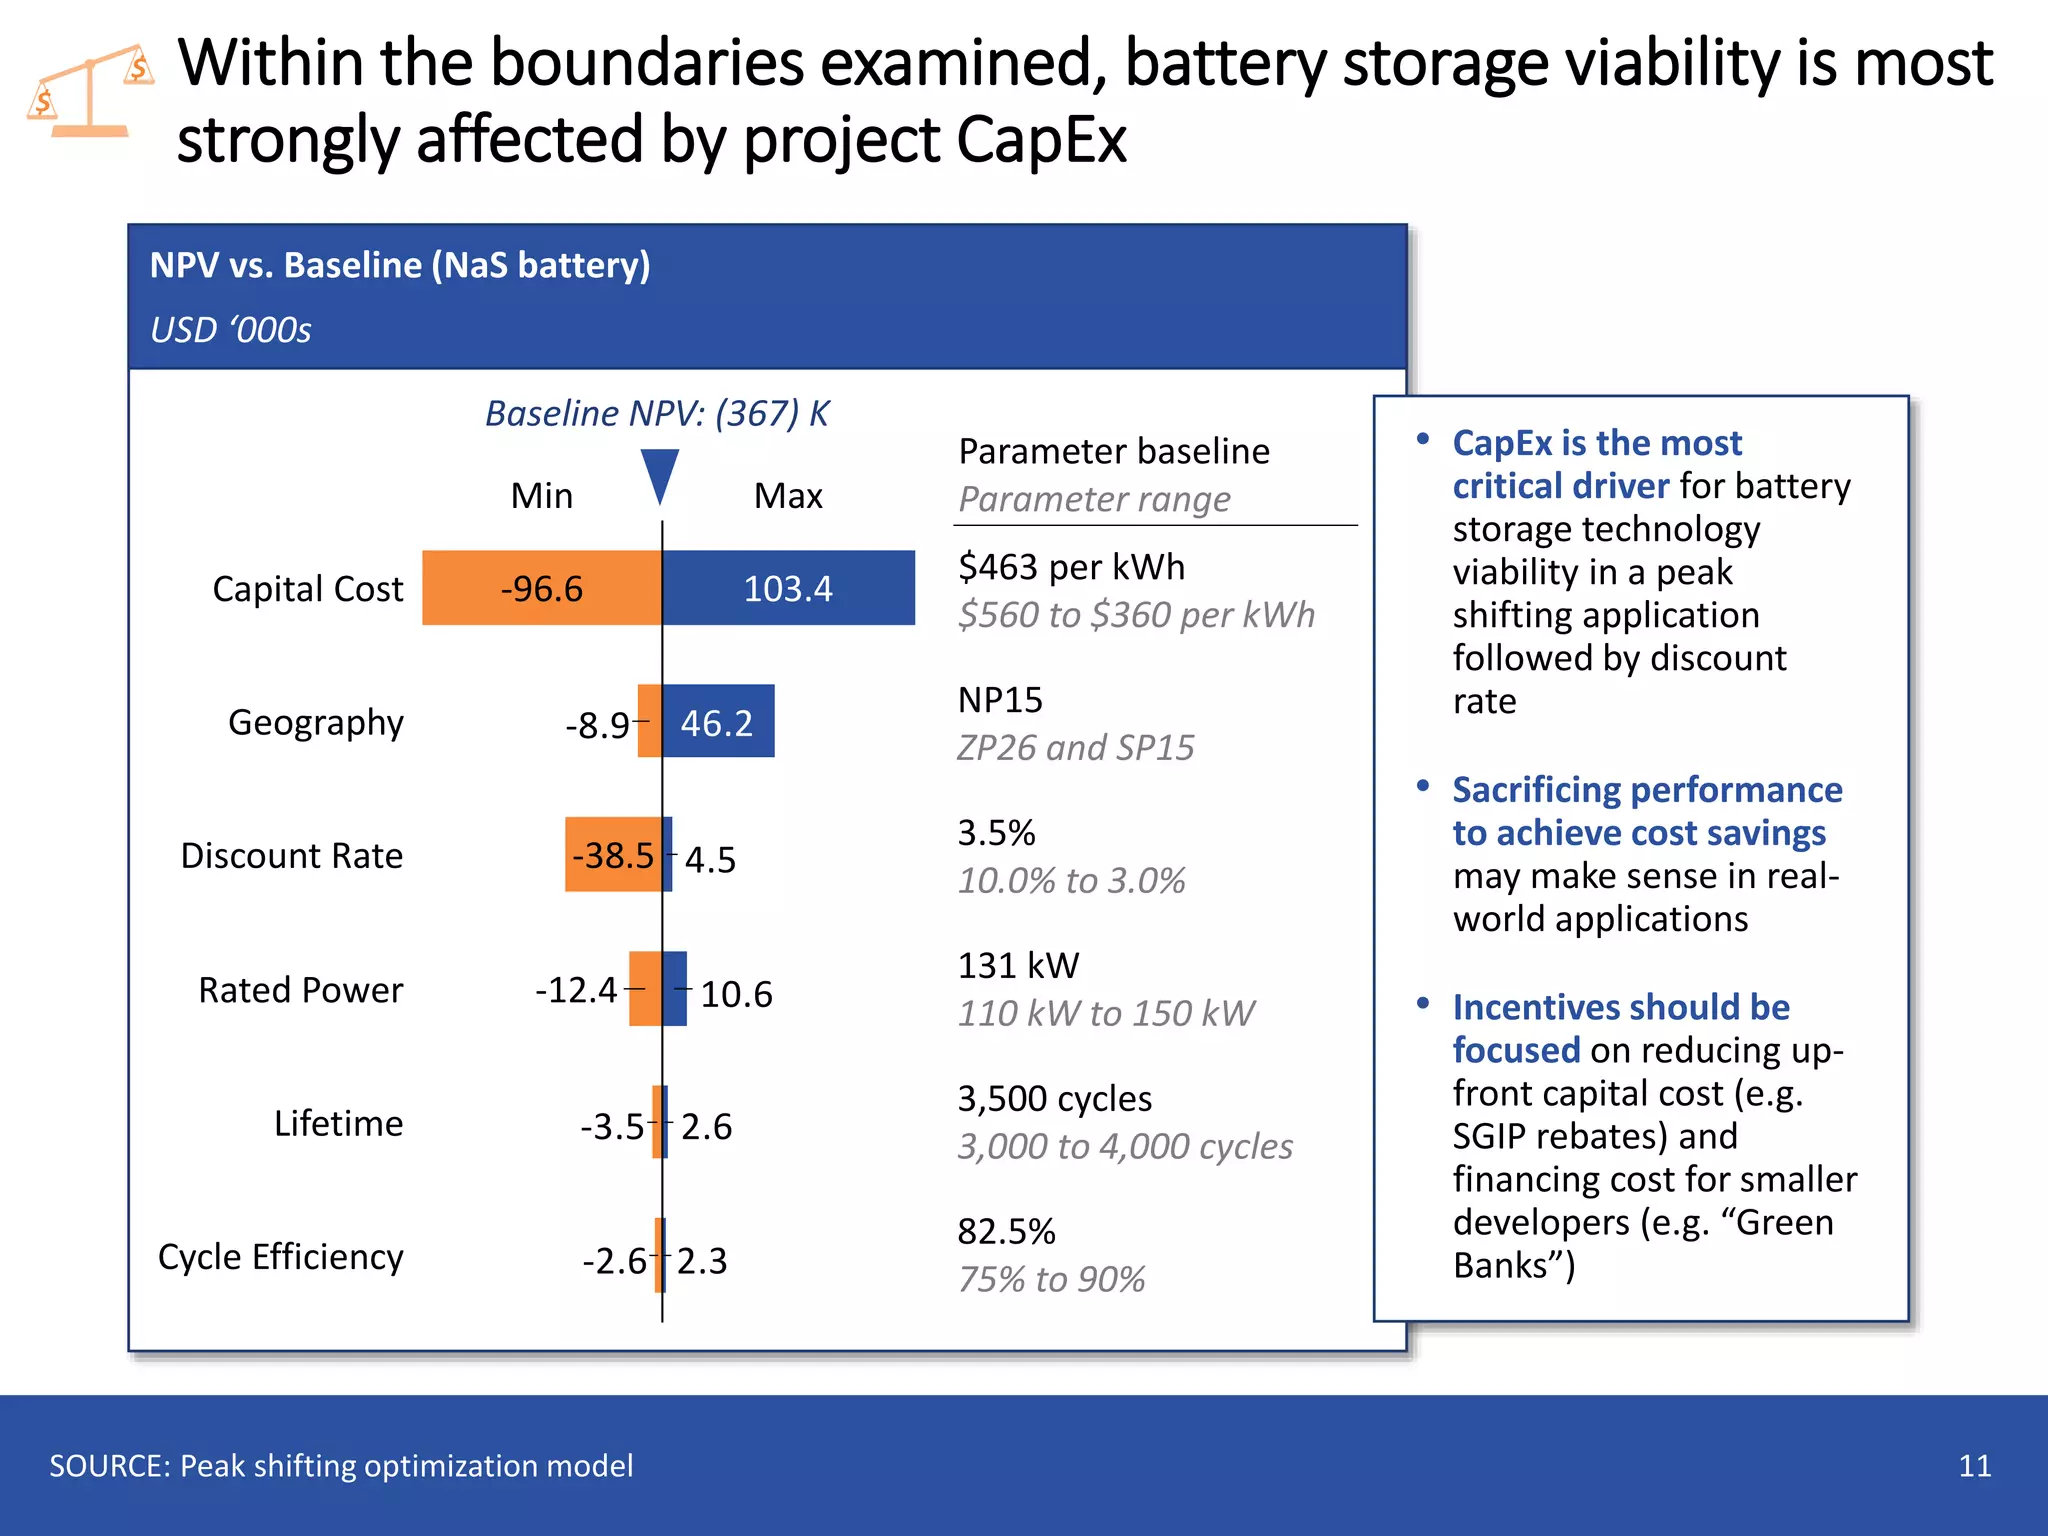
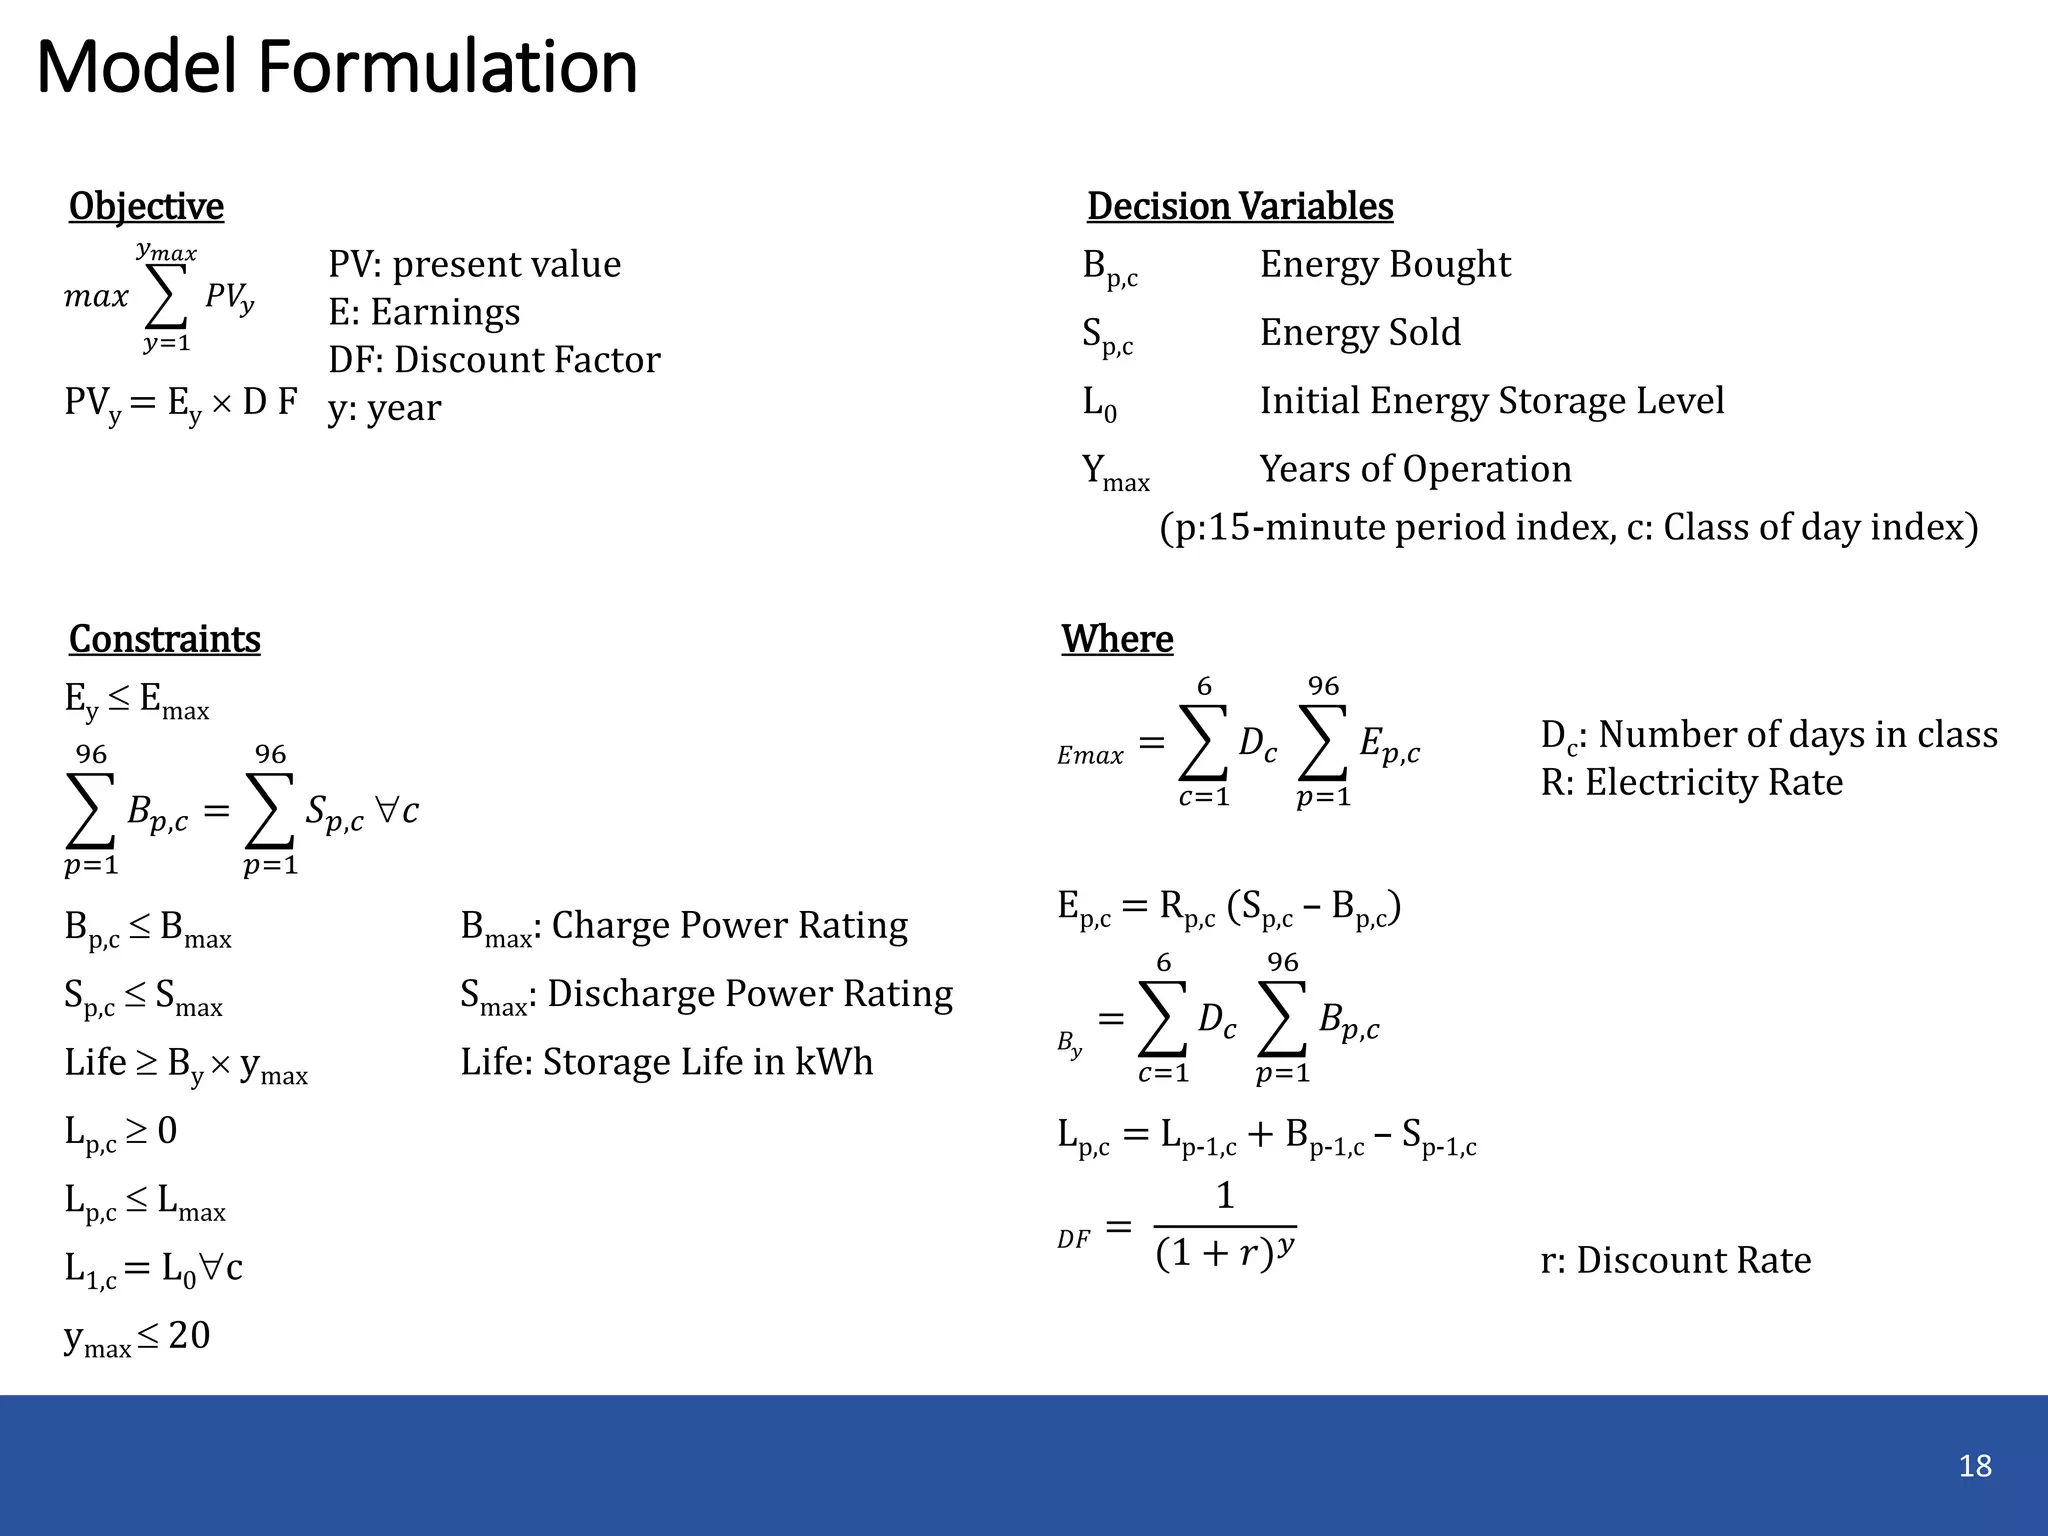
Valuation of Storage in Peak
Shifting Applications
December 12, 2016
Laura Gilson, Linda Jing, Kevin Schell,
Max Tuttman
Contents
2
• Introduction & methodology
• Optimization model results
• Next steps
Power is the only basic commodity which cannot be readily stored in
bulk; market and technology trends may be changing this
3
Market development Technology development
• “Duck pond” of net demand creates
large ramping requirements and
increases price fly-ups
• Declining inertia on the grid; more
demand for ancillary services
• Increased social barriers and financial
incentive to defer investment in new
transmission
• Large learning curve cost reductions
driven by non-grid applications of
batteries
• Basic research into aging processes
holds potential to significantly
extend battery lifetimes
• Improvements in cost and safety of
anode and cathode materials
Our calculations only focus on part of the value stream for batteries
4SOURCE: U.S. Solar Market Insight
Energy Cost
Reduction
T&D Cost Reduction
Ancillary Services and Wholesale
Market Cost Reductions
Reduced Peaking Capacity Requirements ~47%
~17%
~13%
~12%
~10%
Enhanced Distributed
Renewable Integration
% of Value Creation
Energy storage uses lower cost
energy at off-peak to replace
higher cost peak generation
• Reduced peak prices
• Reduced overall average
energy price
An optimization model was developed to analyze the value of storage
within a peak shifting application in the CAISO region
5
Optimization vs.
heuristic
Model
simplification
Constraint
formulation
• Simplified optimization was selected as the
initial methodology
• Optimization can be used to inform
heuristic which can handle larger data sets
• Value generation confined to wholesale,
peak shifting applications
• Days classified into sets based on price
variability
• Constraints were linearized to facilitate
optimization algorithm
• Idiosyncratic constraints required (e.g.
storage level same at hour 0 and 24)
The team applied the model to evaluate the viability six “traditional”
and battery storage technologies
6
Pumped Hydro Storage Compressed Air Energy Storage (CAES)
Lead acid batteries Lithium Ion Batteries (Li-ion)
Sodium-Sulfur Batteries (NaS) Redox Flow Batteries (VRFB)
SOURCE: Fraunhofer institute, EPRI
• Proven, economically viable
legacy technology
• ~127 GW installed globally
• Geographically constrained
• More loss than hydro due to
heating of pressurized air
• ~440 MW installed globally
• Geographically constrained
• Reliable and able to withstand
variable charging conditions
• O&M intensive
• Variable cycle lifetime
• High power & energy density
• Substantial manufacturing
base due to electronics
• Variable lifetime
• Most prolific battery in grid
applications
• ~316 MW installed globally
• High temp, can be unstable
• Energy can be scaled at low
cost relative to overall system
• Long cycle lifetimes
• Small install base
Contents
2
• Introduction & methodology
• Optimization model results
• Next steps
The optimization model yielded several key results
8
• NPV Negative: Peak-shifting alone does not provide
sufficient value to justify storage investments
• Fly-ups drive value capture: more than 50% of value
is captured from only ~30 days per year
• CapEx sensitivity: rebate incentives may be most
effective channel to encourage development
$
$
$
Peak-shifting alone recovers a minority of capital investment for
battery technologies
9
0.21
0.130.100.09
0.54
0.65
Li-ionLead-Acid NaS VRFB
1
Pumped
Hydro
CAES
20-year Normalized Present Value in Peak Shifting Application
USD PV per USD Invested
SOURCE: Peak-shifting optimization model
Traditional grid storage Battery storage
Breakeven present value
• No storage technology yielded
positive NPV from strict peak-
shifting application
– Constrained lifetime
– Aggregation obfuscates value
– Matched charge constraint
likely impacted hydro
• “Traditional” storage
significantly outperforms
battery storage technologies
• Although Li-ion generated the
most revenue, high capital cost
depressed project NPV
$
0%
40%
20%10%
60%
30%
80% 100%
90%
50%
80%
20%
70%
0%
90%
100%
70%
10%
60%50%40%30%
Cumulative value generated vs. proportion of days
% of days | % of value
Majority of value was captured during the high, peak, and super-
peak which accounted for less than 20% of operational days
10SOURCE: Peak-shifting optimization model
• Across all storage types,
more than 50% of revenue
was generated on ~10-15%
of days; fly-ups drive value
capture
• Shape of curve is sensitive
to discount rate; more
linear at higher rates
• High power, short lifetime
technologies captured a
greater proportion of value
during fly-ups
• Viability of peak shifting
storage is very sensitive to
marginal dispatch on peak
demand days
Hydro CAES Lead Acid Li-ion NaS VRFB
NPV vs. Baseline (NaS battery)
USD ‘000s
• CapEx is the most
critical driver for battery
storage technology
viability in a peak
shifting application
followed by discount
rate
• Sacrificing performance
to achieve cost savings
may make sense in real-
world applications
• Incentives should be
focused on reducing up-
front capital cost (e.g.
SGIP rebates) and
financing cost for smaller
developers (e.g. “Green
Banks”)
Within the boundaries examined, battery storage viability is most
strongly affected by project CapEx
11SOURCE: Peak shifting optimization model
2.3
2.6
10.6
4.5
46.2
-2.6
-3.5
-8.9
Max
Cycle Efficiency
Min
-38.5Discount Rate
Rated Power
Lifetime
-12.4
Capital Cost
Geography
-96.6 103.4
Baseline NPV: (367) K
Parameter baseline
Parameter range
3.5%
10.0% to 3.0%
$463 per kWh
$560 to $360 per kWh
131 kW
110 kW to 150 kW
82.5%
75% to 90%
3,500 cycles
3,000 to 4,000 cycles
$
$
NP15
ZP26 and SP15
Contents
2
• Introduction & methodology
• Optimization model results
• Next steps
The optimization model could be extended along several dimensions
to further understand energy storage viability
13
Heuristic
development
Ancillary market
value capture
Commercial
application
Renewable
integration
• Analyze optimization behavior; develop a set
of logical rules to approximate optimization
• More realistic; longer data tranches
• Approximate value from participation in
ancillary markets in addition to wholesale
peak shifting
• Apply commercial tariff structures to charge
cost; understand commercial financials
• Incentive to pair with generation, load
• Integrate commercial model with solar
• Economic synergies from avoiding T&D cost
to charge
$
14
APPENDIX
Hourly wholesale power cost vs. demand (CAISO NP15, PG&E)
MW | $ per MWh
An analysis of hourly price vs. demand suggests that regional marginal
cost of dispatch may not be primary driver of price fly ups
15SOURCE: CAISO real-time price and demand data
• Significant price fly-ups
do not appear to be
strongly correlated to
demand, even when
controlled for solar
influence
• If marginal dispatch was
primary driver of price
fly-ups, would expect a
hockey-stick shaped
chart
• Suggests that congestion
or localized imbalances
may be driving large
price deviations-100
0
100
200
300
400
500
600
700
800
900
1,000
12,000 16,00014,000 18,000 20,00010,000
Different regions have different market behavior and yielded different
technology valuations; NP15 was the “midpoint” region
16
0.31
0.19
0.21
SP15ZP26NP15
20-year Normalized PV by Geography
USD PV per USD Invested
• Northern California,
NP15, was selected as
the “baseline” region
• SP15, Southern
California, was the
highest value region;
almost 50% more
revenue generated
• SP15 likely experiences
a larger swing in prices
due to higher solar
penetration
SOURCE: Peak shifting optimization model
Overall model behavior, NaS batteries
17
Flat
Low
Mid
High
Peak
Super-Peak
-200
0
200
400
600
800
1,000
$150
$200
$0
$100
$250
$300
$50
20106 1484 16 22181220
-200
0
200
400
600
800
1,000
$400
$500
$600
$700
$0
$100
$200
$300
22201820 8 12 164 14106
-200
0
200
400
600
800
1,000 $1,000
$800
$200
$600
$0
$(200)
$400
106 8420 222018161412
-200
0
200
400
600
800
1,000 $1,000
$200
$400
$600
$800
$0
18 222016148 126 10420
0
200
400
600
800
1,000 $50
$40
$30
$20
$10
$0
0 2 2210864 181614 2012
-200
0
200
400
600
800
1,000
$60
$80
$120
$40
$20
$0
$100
201814121082 4 60 16 22
SOURCE: Peak shifting optimization model
Charge (Discharge) Rate (kW) Charge Level (kWh) Power price ($/kWh)
Model Formulation
18
Decision Variables
Bp,c Energy Bought
Sp,c Energy Sold
L0 Initial Energy Storage Level
Ymax Years of Operation
(p:15-minute period index, c: Class of day index)
Constraints
Ey  Emax
𝑝=1
96
𝐵𝑝,𝑐 =
𝑝=1
96
𝑆 𝑝,𝑐 𝑐
Bp,c  Bmax Bmax: Charge Power Rating
Sp,c  Smax Smax: Discharge Power Rating
Life  By  ymax Life: Storage Life in kWh
Lp,c  0
Lp,c  Lmax
L1,c = L0c
ymax  20
Objective
𝑚𝑎𝑥
𝑦=1
𝑦 𝑚𝑎𝑥
𝑃𝑉𝑦
PV: present value
E: Earnings
DF: Discount Factor
y: yearPVy = Ey  D F
Where
𝐸𝑚𝑎𝑥 =
𝑐=1
6
𝐷𝑐
𝑝=1
96
𝐸 𝑝,𝑐
Dc: Number of days in class
R: Electricity Rate
r: Discount Rate
Ep,c = Rp,c (Sp,c – Bp,c)
𝐵𝑦
=
𝑐=1
6
𝐷𝑐
𝑝=1
96
𝐵𝑝,𝑐
Lp,c = Lp-1,c + Bp-1,c – Sp-1,c
𝐷𝐹 =
1
(1 + 𝑟) 𝑦

Valuation of Storage in Peak Shifting Applications

  • 1.
    Valuation of Storagein Peak Shifting Applications December 12, 2016 Laura Gilson, Linda Jing, Kevin Schell, Max Tuttman
  • 2.
    Contents 2 • Introduction &methodology • Optimization model results • Next steps
  • 3.
    Power is theonly basic commodity which cannot be readily stored in bulk; market and technology trends may be changing this 3 Market development Technology development • “Duck pond” of net demand creates large ramping requirements and increases price fly-ups • Declining inertia on the grid; more demand for ancillary services • Increased social barriers and financial incentive to defer investment in new transmission • Large learning curve cost reductions driven by non-grid applications of batteries • Basic research into aging processes holds potential to significantly extend battery lifetimes • Improvements in cost and safety of anode and cathode materials
  • 4.
    Our calculations onlyfocus on part of the value stream for batteries 4SOURCE: U.S. Solar Market Insight Energy Cost Reduction T&D Cost Reduction Ancillary Services and Wholesale Market Cost Reductions Reduced Peaking Capacity Requirements ~47% ~17% ~13% ~12% ~10% Enhanced Distributed Renewable Integration % of Value Creation Energy storage uses lower cost energy at off-peak to replace higher cost peak generation • Reduced peak prices • Reduced overall average energy price
  • 5.
    An optimization modelwas developed to analyze the value of storage within a peak shifting application in the CAISO region 5 Optimization vs. heuristic Model simplification Constraint formulation • Simplified optimization was selected as the initial methodology • Optimization can be used to inform heuristic which can handle larger data sets • Value generation confined to wholesale, peak shifting applications • Days classified into sets based on price variability • Constraints were linearized to facilitate optimization algorithm • Idiosyncratic constraints required (e.g. storage level same at hour 0 and 24)
  • 6.
    The team appliedthe model to evaluate the viability six “traditional” and battery storage technologies 6 Pumped Hydro Storage Compressed Air Energy Storage (CAES) Lead acid batteries Lithium Ion Batteries (Li-ion) Sodium-Sulfur Batteries (NaS) Redox Flow Batteries (VRFB) SOURCE: Fraunhofer institute, EPRI • Proven, economically viable legacy technology • ~127 GW installed globally • Geographically constrained • More loss than hydro due to heating of pressurized air • ~440 MW installed globally • Geographically constrained • Reliable and able to withstand variable charging conditions • O&M intensive • Variable cycle lifetime • High power & energy density • Substantial manufacturing base due to electronics • Variable lifetime • Most prolific battery in grid applications • ~316 MW installed globally • High temp, can be unstable • Energy can be scaled at low cost relative to overall system • Long cycle lifetimes • Small install base
  • 7.
    Contents 2 • Introduction &methodology • Optimization model results • Next steps
  • 8.
    The optimization modelyielded several key results 8 • NPV Negative: Peak-shifting alone does not provide sufficient value to justify storage investments • Fly-ups drive value capture: more than 50% of value is captured from only ~30 days per year • CapEx sensitivity: rebate incentives may be most effective channel to encourage development $ $ $
  • 9.
    Peak-shifting alone recoversa minority of capital investment for battery technologies 9 0.21 0.130.100.09 0.54 0.65 Li-ionLead-Acid NaS VRFB 1 Pumped Hydro CAES 20-year Normalized Present Value in Peak Shifting Application USD PV per USD Invested SOURCE: Peak-shifting optimization model Traditional grid storage Battery storage Breakeven present value • No storage technology yielded positive NPV from strict peak- shifting application – Constrained lifetime – Aggregation obfuscates value – Matched charge constraint likely impacted hydro • “Traditional” storage significantly outperforms battery storage technologies • Although Li-ion generated the most revenue, high capital cost depressed project NPV $
  • 10.
    0% 40% 20%10% 60% 30% 80% 100% 90% 50% 80% 20% 70% 0% 90% 100% 70% 10% 60%50%40%30% Cumulative valuegenerated vs. proportion of days % of days | % of value Majority of value was captured during the high, peak, and super- peak which accounted for less than 20% of operational days 10SOURCE: Peak-shifting optimization model • Across all storage types, more than 50% of revenue was generated on ~10-15% of days; fly-ups drive value capture • Shape of curve is sensitive to discount rate; more linear at higher rates • High power, short lifetime technologies captured a greater proportion of value during fly-ups • Viability of peak shifting storage is very sensitive to marginal dispatch on peak demand days Hydro CAES Lead Acid Li-ion NaS VRFB
  • 11.
    NPV vs. Baseline(NaS battery) USD ‘000s • CapEx is the most critical driver for battery storage technology viability in a peak shifting application followed by discount rate • Sacrificing performance to achieve cost savings may make sense in real- world applications • Incentives should be focused on reducing up- front capital cost (e.g. SGIP rebates) and financing cost for smaller developers (e.g. “Green Banks”) Within the boundaries examined, battery storage viability is most strongly affected by project CapEx 11SOURCE: Peak shifting optimization model 2.3 2.6 10.6 4.5 46.2 -2.6 -3.5 -8.9 Max Cycle Efficiency Min -38.5Discount Rate Rated Power Lifetime -12.4 Capital Cost Geography -96.6 103.4 Baseline NPV: (367) K Parameter baseline Parameter range 3.5% 10.0% to 3.0% $463 per kWh $560 to $360 per kWh 131 kW 110 kW to 150 kW 82.5% 75% to 90% 3,500 cycles 3,000 to 4,000 cycles $ $ NP15 ZP26 and SP15
  • 12.
    Contents 2 • Introduction &methodology • Optimization model results • Next steps
  • 13.
    The optimization modelcould be extended along several dimensions to further understand energy storage viability 13 Heuristic development Ancillary market value capture Commercial application Renewable integration • Analyze optimization behavior; develop a set of logical rules to approximate optimization • More realistic; longer data tranches • Approximate value from participation in ancillary markets in addition to wholesale peak shifting • Apply commercial tariff structures to charge cost; understand commercial financials • Incentive to pair with generation, load • Integrate commercial model with solar • Economic synergies from avoiding T&D cost to charge $
  • 14.
  • 15.
    Hourly wholesale powercost vs. demand (CAISO NP15, PG&E) MW | $ per MWh An analysis of hourly price vs. demand suggests that regional marginal cost of dispatch may not be primary driver of price fly ups 15SOURCE: CAISO real-time price and demand data • Significant price fly-ups do not appear to be strongly correlated to demand, even when controlled for solar influence • If marginal dispatch was primary driver of price fly-ups, would expect a hockey-stick shaped chart • Suggests that congestion or localized imbalances may be driving large price deviations-100 0 100 200 300 400 500 600 700 800 900 1,000 12,000 16,00014,000 18,000 20,00010,000
  • 16.
    Different regions havedifferent market behavior and yielded different technology valuations; NP15 was the “midpoint” region 16 0.31 0.19 0.21 SP15ZP26NP15 20-year Normalized PV by Geography USD PV per USD Invested • Northern California, NP15, was selected as the “baseline” region • SP15, Southern California, was the highest value region; almost 50% more revenue generated • SP15 likely experiences a larger swing in prices due to higher solar penetration SOURCE: Peak shifting optimization model
  • 17.
    Overall model behavior,NaS batteries 17 Flat Low Mid High Peak Super-Peak -200 0 200 400 600 800 1,000 $150 $200 $0 $100 $250 $300 $50 20106 1484 16 22181220 -200 0 200 400 600 800 1,000 $400 $500 $600 $700 $0 $100 $200 $300 22201820 8 12 164 14106 -200 0 200 400 600 800 1,000 $1,000 $800 $200 $600 $0 $(200) $400 106 8420 222018161412 -200 0 200 400 600 800 1,000 $1,000 $200 $400 $600 $800 $0 18 222016148 126 10420 0 200 400 600 800 1,000 $50 $40 $30 $20 $10 $0 0 2 2210864 181614 2012 -200 0 200 400 600 800 1,000 $60 $80 $120 $40 $20 $0 $100 201814121082 4 60 16 22 SOURCE: Peak shifting optimization model Charge (Discharge) Rate (kW) Charge Level (kWh) Power price ($/kWh)
  • 18.
    Model Formulation 18 Decision Variables Bp,cEnergy Bought Sp,c Energy Sold L0 Initial Energy Storage Level Ymax Years of Operation (p:15-minute period index, c: Class of day index) Constraints Ey  Emax 𝑝=1 96 𝐵𝑝,𝑐 = 𝑝=1 96 𝑆 𝑝,𝑐 𝑐 Bp,c  Bmax Bmax: Charge Power Rating Sp,c  Smax Smax: Discharge Power Rating Life  By  ymax Life: Storage Life in kWh Lp,c  0 Lp,c  Lmax L1,c = L0c ymax  20 Objective 𝑚𝑎𝑥 𝑦=1 𝑦 𝑚𝑎𝑥 𝑃𝑉𝑦 PV: present value E: Earnings DF: Discount Factor y: yearPVy = Ey  D F Where 𝐸𝑚𝑎𝑥 = 𝑐=1 6 𝐷𝑐 𝑝=1 96 𝐸 𝑝,𝑐 Dc: Number of days in class R: Electricity Rate r: Discount Rate Ep,c = Rp,c (Sp,c – Bp,c) 𝐵𝑦 = 𝑐=1 6 𝐷𝑐 𝑝=1 96 𝐵𝑝,𝑐 Lp,c = Lp-1,c + Bp-1,c – Sp-1,c 𝐷𝐹 = 1 (1 + 𝑟) 𝑦

Editor's Notes

  • #3 - 70% Decrease in energy storage costs by 2030 (E-storage: Shifting from Cost to Value) - Storage Target Mandates California: 1.3 GW by 2020 Oregon: requires main electricity providers to have > 5MWh of energy storage by 2020 Massachusetts: 10 million energy storage initiative started in 2015 NYC: 100 MWh by 2020; with solar target of 1000 MW by 2030
  • #4 Also mention mechanical energy storage improvements Max
  • #5 Max
  • #6 Max
  • #7 Lead acid – Hawaii installation Laura
  • #8 - 70% Decrease in energy storage costs by 2030 (E-storage: Shifting from Cost to Value) - Storage Target Mandates California: 1.3 GW by 2020 Oregon: requires main electricity providers to have > 5MWh of energy storage by 2020 Massachusetts: 10 million energy storage initiative started in 2015 NYC: 100 MWh by 2020; with solar target of 1000 MW by 2030
  • #9 Laura
  • #10 Aggregation – averaging prices destroys some of the fly up value Geographic dependency Linda
  • #11 (lead-acid: 79%, VRFB: 65%) Mention profile is highly sensitive to discount rates - Discount rate used changes shape of this chart - High discount rate - more flat Low discount rate – more steep Linda
  • #12 Kevin
  • #13 - 70% Decrease in energy storage costs by 2030 (E-storage: Shifting from Cost to Value) - Storage Target Mandates California: 1.3 GW by 2020 Oregon: requires main electricity providers to have > 5MWh of energy storage by 2020 Massachusetts: 10 million energy storage initiative started in 2015 NYC: 100 MWh by 2020; with solar target of 1000 MW by 2030
  • #14 Mention that only 40% of the battery is used during a day Kevin