Download to read offline
![pertaining to this is shown below; the re-blocked realization
is shown in the top right graphic and the histogram
pertaining to this below. The figure demonstrates the key
features of up-scaling from punctual to block support under
the multigaussian model assumptions that underpin the CS
realization (see Journel and Alabert, 1989): the range and
skewness of the distribution is reduced, but the mean is
preserved.
In order to provide a series of abundant secondary sample
data-sets (Z2), ‘virtual’ samples were extracted from the
punctual ground truth. Multi-generational data sources often
overlap, but are rarely exactly coincident unless they
represent re-assay of older pulps or rejects. The Z2 data
locations were therefore made irregular and dislocated from
Z1 in order to provide a realistic representation of a multi-
generational drilling campaign (the displaced heterotopic
sample arrangement; see Wackernagel, 2003). Regular 25 m
× 25 m locations were adjusted by easting and northing
values drawn from a uniform distribution over [−3,3] to
provide the Z2 extraction locations. This geometry results in
Z2 to Z1 frequency of approximately 10:1.
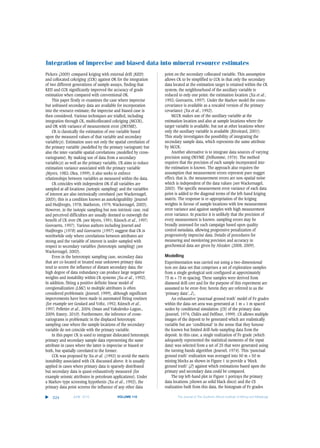
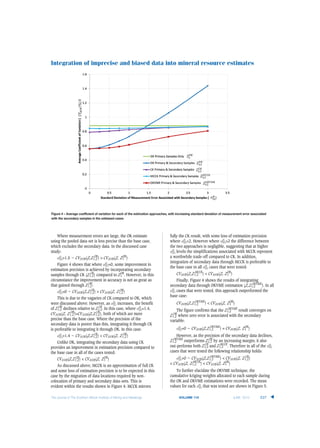
Six unbiased normal error distributions were applied to
the extracted Z2 samples with absolute error standard
deviation (σα
Z2) ranging between 0.25 and 3 (see Figure 2),
termed unbiased cases hereafter. Because the error distrib-
utions are symmetric and unbounded, imprecision has no
implication with respect to bias. In addition, six positively
biased error distributions centred upon absolute +1% were
applied, and six negatively biased distributions centred upon
absolute -1% were applied, each with the same range in σα
Z2
(termed biased cases hereafter).
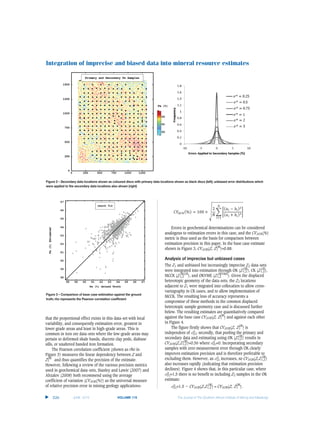
An OK block estimate incorporating the primary data only
represents the base case (Z1
OK
) and is compared against the
block ground truth in the scatter plot shown in Figure 3.
In bedded iron ore data-sets, the Fe distribution is
typically negatively skewed (see Figure 1), the data is charac-
teristically heteroscedastic (i.e. subsets of the data show
differences in variability), and the proportional effect usually
exists (local variability is related to the local mean; see
Journel and Huijbregts, 1978). Figure 3 indicates that the
variance of estimation error is least where the local mean is
greatest but increases as the local mean declines. This implies
Integration of imprecise and biased data into mineral resource estimates
525The Journal of The Southern African Institute of Mining and Metallurgy VOLUME 115 JUNE 2015
▲
Figure 1 – Conditional simulation of punctual ground truth (top left) with drill-hole locations shown as discs; punctual ground truth histogram (bottom left);
ground truth up-scaled to 50 m x 50 m blocks (top right); and block ground truth histogram (bottom right)](https://image.slidesharecdn.com/6028b578-ceb2-466b-b3be-03f7ef4d5955-150728091356-lva1-app6892/85/v115n06p523-3-320.jpg)
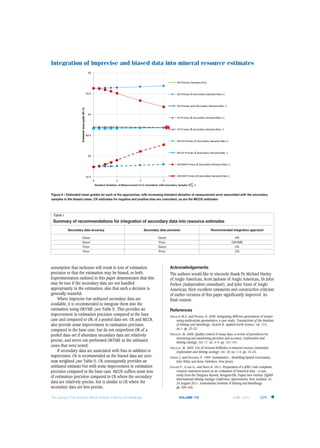


The document discusses methods for integrating imprecise or biased secondary data from multiple sources into mineral resource estimates. It examines techniques including cokriging (CK), multicollocated cokriging (MCCK), and ordinary kriging with variance of measurement error (OKVME). Where abundant imprecise but unbiased secondary data are available, the document recommends using OKVME, as it improves estimation precision over using the primary data alone or pooling the data and using ordinary kriging. For abundant imprecise and biased secondary data, CK is recommended as it provides an unbiased estimate and some improvement in precision relative to using only the primary data. The document evaluates these techniques using a case study iron