Download to read offline
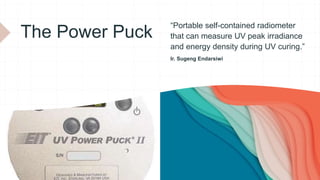
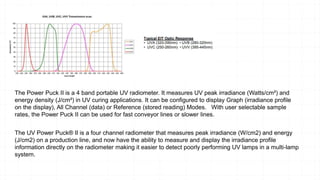


The Power Puck II is a portable UV radiometer designed for measuring UV peak irradiance and energy density in UV curing applications. This 4-band device can display various modes including irradiance profiles, making it easier to identify underperforming UV lamps. It is capable of measuring across different sample rates to accommodate both fast and slow conveyor lines.


