Download to read offline
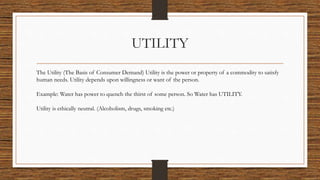


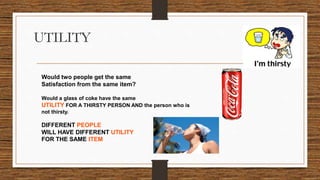
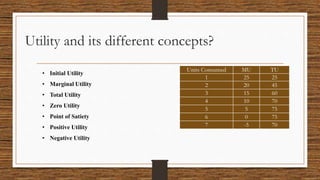
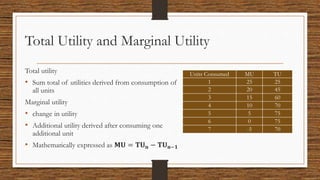


The document explains the concept of utility in consumer behavior, defining it as the satisfaction derived from a commodity based on individual needs and wants. It distinguishes between total utility and marginal utility, illustrating how total utility increases with positive marginal utility until reaching a maximum, after which it declines with negative marginal utility. Various scenarios are provided to demonstrate how different individuals may derive different levels of utility from the same item.


![UTILITY_ANALYSIS_HS_PPT[1] (1).pptx](https://cdn.slidesharecdn.com/ss_thumbnails/utilityanalysishsppt11-230228113525-64ae5526-thumbnail.jpg?width=640&height=640&fit=bounds)


![725Actual Session 126 (5) [Autosaved].pptx](https://cdn.slidesharecdn.com/ss_thumbnails/725actualsession1265autosaved-220908132926-94ed533e-thumbnail.jpg?width=640&height=640&fit=bounds)