Download to read offline
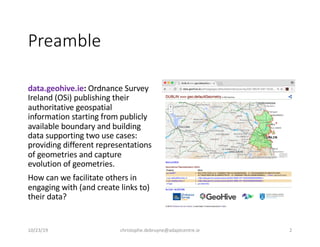


The document discusses the use of maps for interlinking geospatial linked data, emphasizing the importance of manually creating authoritative interlinks across datasets. The authors identify requirements for a user-friendly tool to search, display, and manage geospatial resources, and they developed a faceted browser for this purpose. An experiment was conducted to assess the tool's effectiveness with participants performing tasks related to linking resources in geospatial datasets.