This study presents the use of Evolutionary Polynomial Regression (EPR) in predicting the total sediment load of ten selected rivers in Malaysia. EPR is a data-driven hybrid technique, based on evolutionary computing. In order to apply the method, the extensive database of the Department of Irrigation and Drainage (DID), Ministry of Natural Resources & Environment, Malaysia was sought, and unrestricted access was granted. The EPR technique produced greatly improved results compared to other previous sediment load methods. A robustness study was performed in order to confirm the generalisation ability of the developed EPR model, and a sensitivity analysis was also conducted to determine the relative importance of model inputs. The performance of the EPR model demonstrates its predictive capability and generalisation ability to solve highly nonlinear problems of river engineering applications, such as sediment.
FORECASTING ENERGY CONSUMPTION USING FUZZY TRANSFORM AND LOCAL LINEAR NEURO F...ijsc
This paper proposes a hybrid approach based on local linear neuro fuzzy (LLNF) model and fuzzy transform (F-transform), termed FT-LLNF, for prediction of energy consumption. LLNF models are powerful in modelling and forecasting highly nonlinear and complex time series. Starting from an optimal
linear least square model, they add nonlinear neurons to the initial model as long as the model's accuracy is improved. Trained by local linear model tree learning (LOLIMOT) algorithm, the LLNF models provide maximum generalizability as well as the outstanding performance. Besides, the recently introduced technique of fuzzy transform (F-transform) is employed as a time series pre-processing method. The
technique of F-transform, established based on the concept of fuzzy partitions, eliminates noisy variations of the original time series and results in a well-behaved series which can be predicted with higher accuracy. The proposed hybrid method of FT-LLNF is applied to prediction of energy consumption in the
United States and Canada. The prediction results and comparison to optimized multi-layer perceptron (MLP) models and the LLNF itself, revealed the promising performance of the proposed approach for energy consumption prediction and its potential usage for real world applications.
Car-Following Parameters by Means of Cellular Automata in the Case of EvacuationCSCJournals
This study is attention to the car-following model, an important part in the micro traffic flow. Different from Nagel–Schreckenberg’s studies in which car-following model without agent drivers and diligent ones, agent drivers and diligent ones are proposed in the car-following part in this work and lane-changing is also presented in the model. The impact of agent drivers and diligent ones under certain circumstances such as in the case of evacuation is considered. Based on simulation results, the relations between evacuation time and diligent drivers are obtained by using different amounts of agent drivers; comparison between previous (Nagel–Schreckenberg) and proposed model is also found in order to find the evacuation time. Besides, the effectiveness of reduction the evacuation time is presented for various agent drivers and diligent ones.
EFFICACY OF NEURAL NETWORK IN RAINFALL-RUNOFF MODELLING OF BAGMATI RIVER BASINIAEME Publication
In this paper, rainfall-runoff model of Bagmati river basin has been developed
using the ANN Technique. Three-layered fced forward network structure with back
propagation algorithm was used to train the ANN model. Different combinations of
rainfall and runoff were considered as input to the network and trained by BP
algorithm with different error tolerance, learning parameter, number of cycles and
number of hidden layers. The sensitivity of the prediction accuracy to the number of
hidden layer neurons in a back error propagation algorithm was used for the study.
The monthly rainfall and runoff data from 2000 to 2009 of Bagmati river basin has
been considered for the development of ANN model. Performance evaluation of the
model has been done by using statistical parameters. Three sets of data have been
used to make several combination of year keeping in view the highest peaks of
hydrographs. First set of data used was from 2000 to 2006 for the calibration and
from 2007 to 2009 for validation. The second set of data was from 2004 to 2009 for
calibration and from 2000 to 2003 for validation. The Third set of data was from 2000
to 2009 for calibration and from 2007 to 2009 for validation. It was found that the
third set of data gave better result than other two sets of data. The study demonstrates
the applicability of ANN approach in developing effective non-linear models of
Rainfall-Runoff process without the need to explicitly representing the internal
hydraulic structure of the watershed
Iaetsd ones method for finding an optimalIaetsd Iaetsd
The document proposes a new method called Ones Method for finding an optimal solution to transportation problems directly. The method involves constructing a transportation table and allocating units to cells starting with the minimum demand/supply. Units are allocated to cells with the maximum number of ones until all demands are satisfied and supplies exhausted. The method is illustrated on sample problems and shown to find the same optimal solutions as existing methods but in a simpler way. It provides a systematic procedure that is easy to apply to transportation problems.
This document summarizes a study of traffic flow characteristics for heterogeneous traffic in India. Speed, flow, and time headway data were collected from a six-lane urban road and analyzed. Headways between different vehicle combinations were found to best fit several statistical distributions. Speed-flow curves were plotted to determine the speed at which optimal flow occurs, though the study was limited by only using one hour of data. The results provide insight into modeling headways and understanding traffic flow in heterogeneous, mixed traffic conditions.
Recent research in finding the optimal path by ant colony optimizationjournalBEEI
The computation of the optimal path is one of the critical problems in graph theory. It has been utilized in various practical ranges of real world applications including image processing, file carving and classification problem. Numerous techniques have been proposed in finding optimal path solutions including using ant colony optimization (ACO). This is a nature-inspired metaheuristic algorithm, which is inspired by the foraging behavior of ants in nature. Thus, this paper study the improvement made by many researchers on ACO in finding optimal path solution. Finally, this paper also identifies the recent trends and explores potential future research directions in file carving.
Robust Counterpart Open Capacitated Vehicle Routing (RC-OCVRP) Model in Opti...IJECEIAES
In this paper, the Robust Counterpart Open Capacitation Vehicle Rounting Problem (RC-OCVRP) Model has been established to optimize waste transport in districts Sako and districts Sukarami, Palembang City. This model is completed with the aid of LINGO 13.0 by using Branch and Bound solver to get the optimum route. For Sako districs, the routes are as follows: working area 1 is TPS 1-TPS 2-TPS 3-TPA with distance 53.39 km, working area 2 is TPS 1-TPS 2-TPS 3-TPA with distance 48.14 km, working area 3 is TPS 1-TPA with a distance of 22.98 km, and working area 4 is TPS 1-TPS 2TPS 3-TPS 4-TPA with 45.45 km distance, and obtained the optimum route in Sukarami districts is as follows: working area 1 is TPS 1-TPS 2-TPA 44.39 km, working area 2 is TPS 1-TPS 2-TPS 3-TPA with distance 49.32 km, working area 3 is TPS 1-TPS 3-TPA-TPS 2-TPA with distance 58.57 km, and working area 4 is TPS 1-TPA with a distance of 24.07 km, working area 5 is TPS 1-TPS 3-TPA-TPS 2-TPS 4-TPA with a distance of 77.66 km, and working area 6 is a TPS 1-TPS 2-TPS 3-TPA with a distante 44.94 km.
A review of advanced linear repetitive scheduling methods and techniquesAsadullah Malik
ABSTRACT
Over the past two decades, significant attention has been focused on the development of advanced scheduling methods for repetitive/linear construction projects. Several approaches have been proposed by various research groups in order to solve specific problems in the scheduling of repetitive/linear construction projects such as high-rise buildings, bridges, pipelines, and highways. Some of these approaches represent milestones in the authors’ researches, and others provide a thorough solution implemented in computer software. This paper is a review of several articles related to this topic, which have been published in specialized journals since 1998. The solution methods for repetitive/linear scheduling problems are various, extending from simple graphical techniques to complex computational and optimization methods, such as genetic algorithms. The methods underlying the different solutions can be divided into three groups: exact, heuristic and metaheuristic. This paper presents an introduction into the different repetitive/linear scheduling problems, outlines the optimization methods proposed, classifies the different approach methods utilized and, finally, areas for future research are suggested.
Keywords: linear scheduling, construction management, repetitive units, optimization, genetic algorithms.
This document describes a study that used multi-criteria decision analysis (MCDA) to select suitable sites for nuclear power plants in Egypt. Six constraints and twenty-two factors related to safety, environment, and socioeconomics were considered. Three MCDA models were applied: 1) binary overlay to identify candidate areas by eliminating constrained lands, 2) weighted linear combination to produce potential site maps based on factor weights, and 3) analytic hierarchy process to rank four candidate sites on the northwest and Red Sea coasts. The study found El Dabaa site to be most suitable followed by East El Negila site.
This document summarizes the application of computational intelligence techniques like genetic algorithms and particle swarm optimization for solving economic load dispatch problems. It first applies a real-coded genetic algorithm to minimize generation costs for a 6-generator test system with continuous fuel cost equations, showing superiority over quadratic programming. It then uses particle swarm optimization to minimize costs for a 10-generator system with each generator having discontinuous fuel options, showing better results than other published methods. The document provides background on economic load dispatch problems and optimization techniques like quadratic programming, genetic algorithms, and particle swarm optimization.
Research Inventy : International Journal of Engineering and Scienceinventy
Research Inventy : International Journal of Engineering and Science is published by the group of young academic and industrial researchers with 12 Issues per year. It is an online as well as print version open access journal that provides rapid publication (monthly) of articles in all areas of the subject such as: civil, mechanical, chemical, electronic and computer engineering as well as production and information technology. The Journal welcomes the submission of manuscripts that meet the general criteria of significance and scientific excellence. Papers will be published by rapid process within 20 days after acceptance and peer review process takes only 7 days. All articles published in Research Inventy will be peer-reviewed.
A comparative study of initial basic feasible solution methodsAlexander Decker
This document compares three methods for finding an initial basic feasible solution for transportation problems: Vogel's Approximation Method (VAM), a Proposed Approximation Method (PAM), and a new Minimum Transportation Cost Method (MTCM). It presents the algorithms for each method and applies them to a sample transportation problem. The MTCM provides not only the minimum transportation cost but also an optimal solution, unlike VAM and PAM which sometimes only find a close to optimal solution. The document aims to evaluate which initial basic feasible solution method works best.
An Application of Genetic Algorithm for Non-restricted Space and Pre-determin...drboon
The use of a genetic algorithm is presented to solve a facility layout problem in the situation where there is non-restricted space but the ratio of plant length and width is pre-determined. A two-leveled chromosome is constructed. Six rules are established to translate the chromosome to facility design. An approach of solving a facility layout problem is proposed. A numerical example is employed to illustrate the approach.
The document analyzes crop yield data from spatial locations in Guntur District, Andhra Pradesh, India using hybrid data mining techniques. It first applies k-means clustering to the dataset, producing 5 clusters. It then applies the J48 classification algorithm to the clustered data, resulting in a decision tree that predicts cluster membership based on attributes like crop type, irrigated area, and latitude. Analysis found irrigated areas of cotton and chilies increased from 2007-2008 to 2011-2012. Association rule mining on the clustered data also found relationships between productivity and location attributes. The hybrid approach of clustering followed by classification effectively analyzed the spatial agricultural data.
Effect of inertia weight functions of pso in optimization of water distributi...IAEME Publication
The document summarizes research that optimized a water distribution network using Particle Swarm Optimization (PSO) with different inertia weight functions. Eight inertia weight functions were tested to study their effect on network cost. The minimum cost solution of Rs 419,000 was obtained using a logarithmic inertia weight function with a swarm size of 50 over 15 runs. Results closely matched those from a previous study that optimized the same benchmark network, validating the developed PSO program.
Performance is a process of assessment of the algorithm. Speed and security is the performance to be achieved in determining which algorithm is better to use. In determining the optimum route, there are two algorithms that can be used for comparison. The Genetic and Primary algorithms are two very popular algorithms for determining the optimum route on the graph. Prim can minimize circuit to avoid connected loop. Prim will determine the best route based on active vertex. This algorithm is especially useful when applied in a minimum spanning tree case. Genetics works with probability properties. Genetics cannot determine which route has the maximum value. However, genetics can determine the overall optimum route based on appropriate parameters. Each algorithm can be used for the case of the shortest path, minimum spanning tree or traveling salesman problem. The Prim algorithm is superior to the speed of Genetics. The strength of the Genetic algorithm lies in the number of generations and population generated as well as the selection, crossover and mutation processes as the resultant support. The disadvantage of the Genetic algorithm is spending to much time to get the desired result. Overall, the Prim algorithm has better performance than Genetic especially for a large number of vertices.
APPLICATION OF GENE EXPRESSION PROGRAMMING IN FLOOD FREQUENCY ANALYSISMohd Danish
This document discusses different methods for flood frequency analysis, including Gumbel's method, artificial neural networks (ANN), and gene expression programming (GEP). Gumbel's method is widely used in India to predict flood peaks. ANN and GEP are artificial intelligence techniques that have been applied to hydraulic engineering problems in recent decades. The document focuses on applying GEP to flood frequency analysis of the Ganga River at Hardwar, India. GEP is implemented to derive a relationship between peak flood discharge and return period. The results of GEP are promising and suggest it is a useful alternative to more conventional flood frequency analysis methods.
Application Methods artificial neural network(Ann) Back propagation structure...irjes
This document describes a study that used an artificial neural network with backpropagation (ANN-BP) to predict Manning's roughness coefficient.
- The ANN-BP model was trained on 352 data points from laboratory experiments measuring flow parameters. It used a 7-10-1 network architecture with 10 neurons in the input layer, 10 neurons in the hidden layer, and 1 neuron in the output layer.
- The model achieved a correlation coefficient of 0.980 when comparing predicted and simulated roughness coefficients. The mean squared error was 0.00000177 and the Nash-Sutcliffe efficiency value was 0.597, indicating good model performance.
This document discusses forecasting daily runoff using artificial neural networks (ANN). It presents research applying ANN models to the Gunjwani watershed in India. The document describes developing ANN and multiple linear regression models using rainfall, runoff, evaporation, humidity and temperature data from the watershed. It evaluates the models based on statistical performance criteria like mean square error, mean absolute error and correlation coefficient. The results show that the multi-layer perceptron ANN model provided a better forecast of runoff compared to the multiple linear regression models.
The document summarizes a study that used artificial neural networks (ANN) to predict chemical oxygen demand (COD) levels in an anaerobic wastewater treatment system. Four ANN backpropagation training algorithms - Levenberg-Marquardt, gradient descent with adaptive learning, gradient descent with momentum, and resilient backpropagation - were tested on a model using COD input data. The Levenberg-Marquardt algorithm produced the best results with the lowest mean squared error of 0.533 and highest regression value of 0.991, accurately predicting COD levels. The study demonstrates ANNs can effectively model and predict values in nonlinear wastewater treatment processes.
This document describes research using genetic programming (GP) and artificial neural networks (ANN) to develop short-term air quality forecast models for Pune, India. 36 models were developed using daily average meteorological and pollutant concentration data from 2005-2008 to predict concentrations of SOx, NOx, and particulate matter one day in advance. The models were designed to be robust in situations where complete input data is unavailable. Performance of the GP and ANN models was evaluated based on correlation, error, and other statistical measures. The research found that the GP models generally performed better than the ANN models, especially in cases with incomplete data, and had the advantage of generating equation-based forecasts.
This document describes research using an artificial neural network (ANN) model to predict the length of hydraulic jumps on rough beds. The ANN model takes the Froude number and relative roughness as inputs and predicts the non-dimensional jump length as the output. Experimental data from previous studies was used to train, validate and test the ANN model. The ANN model was found to predict jump length with higher accuracy than an existing empirical equation, with a coefficient of determination of 0.9596, mean absolute percentage error of 6.9231, and root mean square error of 3.2438. A sensitivity analysis showed that the Froude number has a greater influence on jump length prediction than relative roughness.
The document describes a study that uses artificial neural networks (ANN), fuzzy inference systems (FIS), and adaptive neuro-fuzzy inference systems (ANFIS) to model and predict groundwater levels in the Thurinjapuram watershed in Tamil Nadu, India. Monthly rainfall and water level data from 1985 to 2008 were used as inputs, with one month ahead water level as the output. ANFIS performed best with lower error rates and higher correlation than ANN and FIS models according to statistical evaluations. Validation with unused 2009-2010 data showed ANFIS predictions were 80% accurate.
Performance improvement of a Rainfall Prediction Model using Particle Swarm O...ijceronline
The performances of the statistical methods of time series forecast can be improved by precise selection of their parameters. Various techniques are being applied to improve the modeling accuracy of these models. Particle swarm optimization is one such technique which can be conveniently used to determine the model parameters accurately. This robust optimization technique has already been applied to improve the performance of artificial neural networks for time series prediction. This study uses particle swarm optimization technique to determine the parameters of an exponential autoregressive model for time series prediction. The model is applied for annual rainfall prediction and it shows a fairly good performance in comparison to the statistical ARIMA model
Optimal operation of a multi reservoir system and performance evaluationIAEME Publication
This document summarizes an article from the International Journal of Advanced Research in Engineering and Technology that discusses optimal operation of a multi-reservoir system in India. The article develops an efficient algorithm using Discrete Differential Dynamic Programming to determine optimal policies for reservoir release from the Damodar Valley reservoir system, which consists of 4 reservoirs. The objective is to minimize deficits in water supply for irrigation, municipal, and industrial use. Two types of objective functions are used and evaluated: one that penalizes only deficits, and one that penalizes both deficits and surpluses. Performance is evaluated using reliability parameters to analyze the initial and optimal solutions.
ANN Modeling of Monthly and Weekly Behaviour of the Runoff of Kali River Catc...IOSR Journals
Model is a system, by whose operation; the characteristics of other similar systems can be ascertained. Experimental observation made on a model bear a definite relationship with prototype. So, the model analysis or modeling is actually an experimental method of finding solution of complex flow problems like surface water modeling, sub-surface water modeling etc. Many flow situations are not amenable to theoretical analysis. Modeling is a valuable means of obtaining better understanding of particular situation. Inspired by the functioning of the brain and biological nervous system, Artificial Neural Networks (ANNs) has been applied to various hydrological problems in last two decades. In this study, two ANN models using feed forward – back propagation network are developed to correlate a relationship between rainfall and runoff on monthly and weekly basis for Kali river catchment up to Supa dam in Uttara Kannada District of Karnataka State, India. The developed two models are compared and evaluated using standard statistical parameters to know strength and weaknesses. This performance can be further refined by incorporating more input parameters of catchment properties like soil moisture index; land use and land cover details etc.
Calculation of solar radiation by using regression methodsmehmet şahin
Abstract. In this study, solar radiation was estimated at 53 location over Turkey with
varying climatic conditions using the Linear, Ridge, Lasso, Smoother, Partial least, KNN
and Gaussian process regression methods. The data of 2002 and 2003 years were used to
obtain regression coefficients of relevant methods. The coefficients were obtained based on
the input parameters. Input parameters were month, altitude, latitude, longitude and landsurface
temperature (LST).The values for LST were obtained from the data of the National
Oceanic and Atmospheric Administration Advanced Very High Resolution Radiometer
(NOAA-AVHRR) satellite. Solar radiation was calculated using obtained coefficients in
regression methods for 2004 year. The results were compared statistically. The most
successful method was Gaussian process regression method. The most unsuccessful method
was lasso regression method. While means bias error (MBE) value of Gaussian process
regression method was 0,274 MJ/m2, root mean square error (RMSE) value of method was
calculated as 2,260 MJ/m2. The correlation coefficient of related method was calculated as
0,941. Statistical results are consistent with the literature. Used the Gaussian process
regression method is recommended for other studies.
A Class of Continuous Implicit Seventh-eight method for solving y’ = f(x, y) ...AI Publications
In this article, we develop a continuous implicit seventh-eight method using interpolation and collocation of the approximate solution for the solution of y’ = f(x, y) with a constant step-size. The method uses power series as the approximate solution in the derivation of the method. The independent solution was then derived by adopting block integrator. The properties of the method was investigated and found to be zero stable, consistent and convergent. The integrator was tested on numerical examples ranging from linear problem, Prothero-Robinson Oscillatory, Growth Model and Sir Model. The results show that the computed solution is closer to the exact solution and also, the absolutes errors perform better than the existing methods.
The document compares the use of artificial neural networks and sediment rating curve models for estimating suspended sediment in the Lokapavani River basin in India. It finds that an artificial neural network using multilayer perceptron with water discharge, accumulated discharge, and accumulated rainfall as inputs achieved an R2 value of 0.88 for estimating suspended sediment, outperforming a sediment rating curve model which achieved an R2 of 0.846. However, the artificial neural network was not as accurate at estimating peak sediment values. Overall, the study found artificial neural networks to be an acceptable method for suspended sediment estimation in this basin, though they have limitations in predicting peaks.
The document describes a study that used artificial neural networks (ANN) to predict chemical oxygen demand (COD) levels in wastewater from an anaerobic reactor. Four different backpropagation algorithms - Levenberg-Marquardt, gradient descent with adaptive learning rate, gradient descent with momentum, and resilient backpropagation - were used to train a three-layer feedforward ANN model. The model trained with the Levenberg-Marquardt algorithm performed best with a mean squared error of 0.533 and regression coefficient of 0.991, accurately predicting COD levels. The Levenberg-Marquardt algorithm provided the most accurate ANN model for predicting COD in effluent from the ana
The document compares the use of artificial neural networks (ANNs) and model trees (MTs) for rainfall-runoff modelling. It tests these techniques on a European catchment to predict runoff 1, 3, and 6 hours ahead. The results show that both ANNs and MTs produced excellent results for 1-hour ahead prediction, acceptable results for 3-hour prediction, and conditional acceptable results for 6-hour prediction. While the performance of ANNs and MTs was similar for 1-hour predictions, ANNs performed slightly better for longer lead times. However, MTs have the advantage of producing more understandable and adjustable models of varying complexity and accuracy.
This document discusses comparing the accuracy of artificial neural networks (ANN) and multiple linear regression (MLR) models for predicting shear stress in an Eicher 11.10 truck chassis frame. It first reviews past research comparing ANN and MLR models in other applications. It then provides theoretical background on MLR and ANN models. The document describes developing both MLR and ANN models to predict shear stress based on chassis frame design parameters obtained from finite element analysis. The results of the MLR model are shown, and the document indicates that the ANN model will be compared to the MLR model to determine which provides a more accurate prediction of shear stress for the truck chassis frame.
Sewer systems are used to convey sewage and/or storm water to sewage treatment
plants for disposal by a network of buried sewer pipes, gutters, manholes and pits.
Unfortunately, the sewer pipe deteriorates with time leading to the collapsing of the
pipe with traffic disruption or clogging of the pipe causing flooding and
environmental pollution. Thus, the management and maintenance of the buried pipes
are important tasks that require information about the changes of the current and
future sewer pipes conditions. In this research, the study was carried on in Baghdad,
Iraq and two deteriorations model’s multinomial logistic regression and neural
network deterioration model NNDM are used to predict sewers future conditions. The
results of the deterioration models' application showed that NNDM gave the highest
overall prediction efficiency of 93.6% by adapting the confusion matrix test, while
multinomial logistic regression was inconsistent with the data. The error in prediction
of related model was due to its inability to reflect the dependent variable (condition
classes) ordered nature.
This document summarizes an international journal article that proposes a two-phase algorithm for face recognition in the frequency domain using discrete cosine transform (DCT) and discrete Fourier transform (DFT). The algorithm works in two phases: the first phase uses Euclidean distance to determine the K nearest neighbor training samples of a test sample. The second phase represents the test sample as a linear combination of the K nearest neighbors and classifies the sample based on which class representation has the smallest deviation from the test sample. Experimental results on FERET and ORL face databases show the two-phase algorithm based on DCT and DFT outperforms other methods like two-phase sparse representation and PCA/LDA in terms of classification accuracy.
Integration Method of Local-global SVR and Parallel Time Variant PSO in Water...TELKOMNIKA JOURNAL
Flood is one type of natural disaster that can’t be predicted, one of the main causes of flooding is the continuous rain (natural events). In terms of meteorology, the cause of flood is come from high rainfall and the high tide of the sea, resulting in increased the water level. Rainfall and water level analysis in each period, still not able to solve the existing problems. Therefore in this study, the proposed integration method of Parallel Time Variant PSO (PTVPSO) and Local-Global Support Vector Regression (SVR) is used to forecast water level. Implementation in this study combine SVR as regression method for forecast the water level, Local-Global concept take the role for the minimization for the computing time, while PTVPSO used in the SVR to obtain maximum performance and higher accurate result by optimize the parameters of SVR. Hopefully this system will be able to solve the existing problems for flood early warning system due to erratic weather.
Similar to Use of Evolutionary Polynomial Regression (EPR) for Prediction of Total Sediment Load of Malaysian Rivers (20)
How to Setup Warehouse & Location in Odoo 17 InventoryCeline George
In this slide, we'll explore how to set up warehouses and locations in Odoo 17 Inventory. This will help us manage our stock effectively, track inventory levels, and streamline warehouse operations.
বাংলাদেশের অর্থনৈতিক সমীক্ষা ২০২৪ [Bangladesh Economic Review 2024 Bangla.pdf] কম্পিউটার , ট্যাব ও স্মার্ট ফোন ভার্সন সহ সম্পূর্ণ বাংলা ই-বুক বা pdf বই " সুচিপত্র ...বুকমার্ক মেনু 🔖 ও হাইপার লিংক মেনু 📝👆 যুক্ত ..
আমাদের সবার জন্য খুব খুব গুরুত্বপূর্ণ একটি বই ..বিসিএস, ব্যাংক, ইউনিভার্সিটি ভর্তি ও যে কোন প্রতিযোগিতা মূলক পরীক্ষার জন্য এর খুব ইম্পরট্যান্ট একটি বিষয় ...তাছাড়া বাংলাদেশের সাম্প্রতিক যে কোন ডাটা বা তথ্য এই বইতে পাবেন ...
তাই একজন নাগরিক হিসাবে এই তথ্য গুলো আপনার জানা প্রয়োজন ...।
বিসিএস ও ব্যাংক এর লিখিত পরীক্ষা ...+এছাড়া মাধ্যমিক ও উচ্চমাধ্যমিকের স্টুডেন্টদের জন্য অনেক কাজে আসবে ...
Main Java[All of the Base Concepts}.docxadhitya5119
This is part 1 of my Java Learning Journey. This Contains Custom methods, classes, constructors, packages, multithreading , try- catch block, finally block and more.
Chapter wise All Notes of First year Basic Civil Engineering.pptxDenish Jangid
Chapter wise All Notes of First year Basic Civil Engineering
Syllabus
Chapter-1
Introduction to objective, scope and outcome the subject
Chapter 2
Introduction: Scope and Specialization of Civil Engineering, Role of civil Engineer in Society, Impact of infrastructural development on economy of country.
Chapter 3
Surveying: Object Principles & Types of Surveying; Site Plans, Plans & Maps; Scales & Unit of different Measurements.
Linear Measurements: Instruments used. Linear Measurement by Tape, Ranging out Survey Lines and overcoming Obstructions; Measurements on sloping ground; Tape corrections, conventional symbols. Angular Measurements: Instruments used; Introduction to Compass Surveying, Bearings and Longitude & Latitude of a Line, Introduction to total station.
Levelling: Instrument used Object of levelling, Methods of levelling in brief, and Contour maps.
Chapter 4
Buildings: Selection of site for Buildings, Layout of Building Plan, Types of buildings, Plinth area, carpet area, floor space index, Introduction to building byelaws, concept of sun light & ventilation. Components of Buildings & their functions, Basic concept of R.C.C., Introduction to types of foundation
Chapter 5
Transportation: Introduction to Transportation Engineering; Traffic and Road Safety: Types and Characteristics of Various Modes of Transportation; Various Road Traffic Signs, Causes of Accidents and Road Safety Measures.
Chapter 6
Environmental Engineering: Environmental Pollution, Environmental Acts and Regulations, Functional Concepts of Ecology, Basics of Species, Biodiversity, Ecosystem, Hydrological Cycle; Chemical Cycles: Carbon, Nitrogen & Phosphorus; Energy Flow in Ecosystems.
Water Pollution: Water Quality standards, Introduction to Treatment & Disposal of Waste Water. Reuse and Saving of Water, Rain Water Harvesting. Solid Waste Management: Classification of Solid Waste, Collection, Transportation and Disposal of Solid. Recycling of Solid Waste: Energy Recovery, Sanitary Landfill, On-Site Sanitation. Air & Noise Pollution: Primary and Secondary air pollutants, Harmful effects of Air Pollution, Control of Air Pollution. . Noise Pollution Harmful Effects of noise pollution, control of noise pollution, Global warming & Climate Change, Ozone depletion, Greenhouse effect
Text Books:
1. Palancharmy, Basic Civil Engineering, McGraw Hill publishers.
2. Satheesh Gopi, Basic Civil Engineering, Pearson Publishers.
3. Ketki Rangwala Dalal, Essentials of Civil Engineering, Charotar Publishing House.
4. BCP, Surveying volume 1
Gender and Mental Health - Counselling and Family Therapy Applications and In...PsychoTech Services
A proprietary approach developed by bringing together the best of learning theories from Psychology, design principles from the world of visualization, and pedagogical methods from over a decade of training experience, that enables you to: Learn better, faster!
ISO/IEC 27001, ISO/IEC 42001, and GDPR: Best Practices for Implementation and...PECB
Denis is a dynamic and results-driven Chief Information Officer (CIO) with a distinguished career spanning information systems analysis and technical project management. With a proven track record of spearheading the design and delivery of cutting-edge Information Management solutions, he has consistently elevated business operations, streamlined reporting functions, and maximized process efficiency.
Certified as an ISO/IEC 27001: Information Security Management Systems (ISMS) Lead Implementer, Data Protection Officer, and Cyber Risks Analyst, Denis brings a heightened focus on data security, privacy, and cyber resilience to every endeavor.
His expertise extends across a diverse spectrum of reporting, database, and web development applications, underpinned by an exceptional grasp of data storage and virtualization technologies. His proficiency in application testing, database administration, and data cleansing ensures seamless execution of complex projects.
What sets Denis apart is his comprehensive understanding of Business and Systems Analysis technologies, honed through involvement in all phases of the Software Development Lifecycle (SDLC). From meticulous requirements gathering to precise analysis, innovative design, rigorous development, thorough testing, and successful implementation, he has consistently delivered exceptional results.
Throughout his career, he has taken on multifaceted roles, from leading technical project management teams to owning solutions that drive operational excellence. His conscientious and proactive approach is unwavering, whether he is working independently or collaboratively within a team. His ability to connect with colleagues on a personal level underscores his commitment to fostering a harmonious and productive workplace environment.
Date: May 29, 2024
Tags: Information Security, ISO/IEC 27001, ISO/IEC 42001, Artificial Intelligence, GDPR
-------------------------------------------------------------------------------
Find out more about ISO training and certification services
Training: ISO/IEC 27001 Information Security Management System - EN | PECB
ISO/IEC 42001 Artificial Intelligence Management System - EN | PECB
General Data Protection Regulation (GDPR) - Training Courses - EN | PECB
Webinars: https://pecb.com/webinars
Article: https://pecb.com/article
-------------------------------------------------------------------------------
For more information about PECB:
Website: https://pecb.com/
LinkedIn: https://www.linkedin.com/company/pecb/
Facebook: https://www.facebook.com/PECBInternational/
Slideshare: http://www.slideshare.net/PECBCERTIFICATION
This document provides an overview of wound healing, its functions, stages, mechanisms, factors affecting it, and complications.
A wound is a break in the integrity of the skin or tissues, which may be associated with disruption of the structure and function.
Healing is the body’s response to injury in an attempt to restore normal structure and functions.
Healing can occur in two ways: Regeneration and Repair
There are 4 phases of wound healing: hemostasis, inflammation, proliferation, and remodeling. This document also describes the mechanism of wound healing. Factors that affect healing include infection, uncontrolled diabetes, poor nutrition, age, anemia, the presence of foreign bodies, etc.
Complications of wound healing like infection, hyperpigmentation of scar, contractures, and keloid formation.
Walmart Business+ and Spark Good for Nonprofits.pdfTechSoup
"Learn about all the ways Walmart supports nonprofit organizations.
You will hear from Liz Willett, the Head of Nonprofits, and hear about what Walmart is doing to help nonprofits, including Walmart Business and Spark Good. Walmart Business+ is a new offer for nonprofits that offers discounts and also streamlines nonprofits order and expense tracking, saving time and money.
The webinar may also give some examples on how nonprofits can best leverage Walmart Business+.
The event will cover the following::
Walmart Business + (https://business.walmart.com/plus) is a new shopping experience for nonprofits, schools, and local business customers that connects an exclusive online shopping experience to stores. Benefits include free delivery and shipping, a 'Spend Analytics” feature, special discounts, deals and tax-exempt shopping.
Special TechSoup offer for a free 180 days membership, and up to $150 in discounts on eligible orders.
Spark Good (walmart.com/sparkgood) is a charitable platform that enables nonprofits to receive donations directly from customers and associates.
Answers about how you can do more with Walmart!"
Use of Evolutionary Polynomial Regression (EPR) for Prediction of Total Sediment Load of Malaysian Rivers
1. Nadiatul A. Abdul Ghani, Mohamed A. Shahin & Hamid R. Nikraz
International Journal of Engineering (IJE), Volume (6) : Issue (5) : 2012 262
Use of Evolutionary Polynomial Regression (EPR) for Prediction
of Total Sediment Load of Malaysian Rivers
Nadiatul A. Abdul Ghani nadiatuladilah@yahoo.com
Faculty of Civil Engineering & Earth Resources,
University Malaysia Pahang,
Lebuhraya Tun Razak, Gambang,
Kuantan,26300 Pahang, Malaysia
Assc. Prof. Mohamed A. Shahin m.shahin@curtin.edu.au
Department of Civil Engineering,
Curtin University,
GPO Box U1987 Perth,
Western Australia 6845,Australia
Professor Hamid R. Nikraz h.nikraz@curtin.edu.au
Department of Civil Engineering,
Curtin University,
GPO Box U1987 Perth,
Western Australia 6845,Australia
Abstract
This study investigates the use of Evolutionary Polynomial Regression (EPR) for predicting the
total sediment load of Malaysian rivers. EPR is a data-driven modelling hybrid technique, based
on evolutionary computing, that has been recently used successfully in solving many problems in
civil engineering. In order to apply the method for modelling the total sediment of Malaysian
rivers, an extensive database obtained from the Department of Irrigation and Drainage (DID),
Ministry of Natural Resources & Environment, Malaysia was sought, and unrestricted access was
granted. A robustness study was performed in order to confirm the generalisation ability of the
developed EPR model, and a sensitivity analysis was also conducted to determine the relative
importance of model inputs. The results obtained from the EPR model were compared with those
obtained from six other available sediment load prediction models. The performance of the EPR
model demonstrates its predictive capability and generalisation ability to solve highly nonlinear
problems of river engineering applications, such as sediment. Moreover, the EPR model
produced reasonably improved results compared to those obtained from the other available
sediment load methods.
Keywords: Evolutionary polynomial regression, sediment, rivers, Malaysia, prediction.
1. INTRODUCTION
Sedimentation is a process that changes the rivers shape and embankments in the form of
altering the cross-section, longitudinal profile, course of flow and patterns of rivers. In order to
sustain the cultural and economic developments along alluvial rivers, the principles of sediment
transport should be carefully studied and solutions for its engineering and environmental
problems need to be developed. Currently, there are a few models that can be used to identify
the sedimentation process in the form of estimating the total sediment load. Some of the available
models include Engelund & Hansen [1], Graf [2], Ackers & White [3], Yang & Molinas [4], Van Rijn
[5], Karim [6] and Nagy et al. [7], among others. However, most of these models have been
developed based on flume data from western countries, including America and Western Europe,
and have not been widely used or evaluated in other parts of the world [8]. Since the 1990’s,
2. Nadiatul A. Abdul Ghani, Mohamed A. Shahin & Hamid R. Nikraz
International Journal of Engineering (IJE), Volume (6) : Issue (5) : 2012 263
some Malaysian researchers have developed models based on the Malaysian conditions (e.g. [8];
[9]; [10]). However, these models failed to achieve consistent success in relation to accurate
sediment prediction; hence, there is a need for more accurate sediment models.
In this paper, Evolutionary Polynomial Regression (EPR) was used to develop a more accurate
model for predicting the total sediment load for rivers in Malaysia. EPR is an artificial intelligence
technique that has the advantage of combining the genetic algorithms with traditional numerical
regression [12]. The data used for model calibration and validation were collected from the
Department of Irrigation and Drainage (DID), Ministry of Natural Resources & Environment,
Malaysia (hereinafter referred to as the DID). The database comprises 338 data cases (from
1998 through to 2007) that represent ten different rivers across Malaysia for four river catchment
areas, namely Kinta, Kerayong, Langat and Kulim (Figure 1). The first set of data was collected
for Pari River in Taman Merdeka and Kerayong River in Kuala Lumpur from 1998 to 1999. The
second set of data was undertaken at the Kinta River catchment, which consists of four rivers
including Kinta River, Raia River, Pari River and Kampar River. The third set of data took place
over the period 2000 to 2002, at the Langat River catchment area, comprising Langat River, Lui
River and Semenyih River. The fourth and final set of data was completed at Kulim River in 2007.
The available data were divided into two sets: a training set for model calibration and an
independent validation set for model verification. In order to test the performance of the
developed model, consideration was given not only to the model predictive statistical accuracy in
the training and validation set but also to the robustness and interpretive ability of the model.
This was carried out by performing a parametric study to investigate the generalization ability
(robustness) of the model and a sensitivity analysis to quantify the relative importance of the
model inputs to the corresponding outputs (i.e. interpretive ability). Predictions from the
developed EPR model were compared with those obtained from six other available models.
FIGURE 1: Map of river catchments of the study area. [13]
3. Nadiatul A. Abdul Ghani, Mohamed A. Shahin & Hamid R. Nikraz
International Journal of Engineering (IJE), Volume (6) : Issue (5) : 2012 264
2. OVERVIEW OF EVOLUTIONARY POLYNOMIAL REGRESSION (EPR)
EPR is a data-driven hybrid regression technique, based on evolutionary computing, that was
developed by Giustolisi and Savic [14]. EPR has been used successfully in solving several
problems in civil engineering (e.g. [15]; [16]; [17]). It constructs symbolic models by integrating the
soundest features of numerical regression [18] with genetic programming and symbolic
regression [19]. This strategy provides the information in symbolic form expressions, as usually
defined and referred to in the mathematical literature [20]. The following two steps roughly
describe the underlying features of EPR, aimed to search for polynomial structures representing a
system. In the first step, the selection of exponents for polynomial expressions is carried out,
employing an evolutionary searching strategy by means of genetic algorithms [21]. In the second
step, numerical regression using the least square method is conducted, aiming to compute the
coefficients of the previously selected polynomial terms. The general form of expression in EPR
can be presented as follows [14]:
∑ +=
=
m
j
oj aaXfXFy
1
)),(,(
(1)
where: y is the estimated vector of output of the process; m is the number of terms of the target
expression; F is a function constructed by the process; X is the matrix of input variables; f is a
function defined by the user; and aj is a constant. A typical example of EPR pseudo-polynomial
expression that belongs to the class of Eq. (1) is as follows [14]:
( ) ( )[ ])2,()1,(
1
),()1,(
1
^
)......(............)(. kjES
k
kjES
m
ij
kjES
k
jES
jo XXfXXaaY
+
=
∑+=
(2)
where:
^
Y is the vector of target values; m is the length of the expression; aj is the value of the
constants; Xi is the vector(s) of the k candidate inputs; ES is the matrix of exponents; and f is a
function selected by the user.
EPR is suitable for modelling physical phenomena, based on two features [15]: (i) the introduction
of prior knowledge about the physical system/process – to be modelled at three different times,
namely: before, during and after EPR modelling calibration; and (ii) the production of symbolic
formulae, enabling data mining to discover patterns which describe the desired parameters. In the
first EPR feature (i) above, before the construction of the EPR model, the modeller selects the
relevant inputs and arranges them in a suitable format according to their physical meaning.
During the EPR model construction, model structures are determined by following user-defined
settings such as general polynomial structure, user-defined function types (e.g. natural
logarithms, exponentials, tangential hyperbolics) and searching strategy parameters. The EPR
starts from true polynomials and also allows for the development of non-polynomial expressions
containing user-defined functions (e.g. natural logarithms). After EPR model calibration, an
optimum model can be selected from among the series of returned models. The optimum model
is selected based on the modeller’s judgement, in addition to statistical performance indicators
such as the coefficient of determination (CoD). A typical flow diagram of the EPR procedure is
shown in Figure 2, and detailed description of the technique can be found in [14].
The EPR symbolic approach can be seen as opposite to those numerical regressions performed
in Artificial Neural Networks. According to the classification of modelling techniques based on
colour, whereby meaning is related to three levels of prior information required [22], EPR can be
classified as a “grey box” technique (conceptualisation of physical phenomena), and Figure 3
shows a pictorial representation of this classification where the greater the physical knowledge
used during the development of the model, the better the physical interpretation of the
4. Nadiatul A. Abdul Ghani, Mohamed A. Shahin & Hamid R. Nikraz
International Journal of Engineering (IJE), Volume (6) : Issue (5) : 2012 265
phenomena by the user. EPR is a technqique based on observed data; however, the
mathematical structure it returns is symbolic and usually uncomplicated in its constitution [14].
FIGURE 2: Typical flow diagram of EPR procedure. [31]
5. Nadiatul A. Abdul Ghani, Mohamed A. Shahin & Hamid R. Nikraz
International Journal of Engineering (IJE), Volume (6) : Issue (5) : 2012 266
FIGURE 3: Graphical classification of EPR among modelling techniques. [17]
3. DEVELOPMENT OF SEDIMENT TRANSPORT MODEL USING EPR
In this study, the EPR model was developed based on a set of 338 data records collected from
the DID, containing information on total sediment load. The collected data represent the sediment
transport features of ten different rivers across Malaysia, as mentioned earlier. In modeling
environmental phenomena, such as sediment, care has to be given to the data used. Incomplete
sampled data always exist and analysis should provide new insights into the phenomena, give
accurate forecasting of the output for a range of inputs. Another additional problem when dealing
with environmental data is related to discontinuities, i.e. gaps often present in the data records,
and reconstructing the information contained in the missing data, without influencing the
construction of models, is needed [11]. The EPR model was developed using the available
software package, EPR Toolbox Version 2 [23].
The first important step in the development of the EPR model was to identify the potential model
inputs and corresponding outputs. Based on previous studies carried out by many researchers
(e.g. [8]), for the purpose of this study, eight inputs were utilised, having deemed them to be the
most significant factors affecting the sediment transport. These inputs include the hydraulic radius
(R), flow depth (Yo), flow velocity (V), median diameter of sediment load (d50), stream width (B),
water surface slope (So), fall velocity (ωs) and flow discharge (Q). The only output is the total
sediment load (Tj).
The next step taken in the development of the EPR model was the data division. In this study, the
data were randomly divided into two sets: a training set for model calibration and an independent
validation set for model verification. In dividing the data into their sets, the training and testing
sets were selected to be statistically consistent, thus, represent the same statistical population, as
recommended by Shahin et al. [24]. In total, 271 data cases (80%) of the available 338 data
cases were used for training, and 67 data cases (20%) were used for validation. The statistics of
the data cases used for the training and validation sets are given in Table 1, including the mean,
standard deviation, minimum, maximum and range. It should be noted that the extreme values of
the data cases were included in the training set.
6. Nadiatul A. Abdul Ghani, Mohamed A. Shahin & Hamid R. Nikraz
International Journal of Engineering (IJE), Volume (6) : Issue (5) : 2012 267
TABLE 1: EPR input and output variables used and their statistics.
The following step in the development of the EPR model was selecting the related internal
parameters for evolving the model. This was carried out by a trial-and-error approach in which a
number of EPR models were trained, using the parameters given in Table 2, until the optimum
model was obtained. A more detailed description of the modelling parameters used in Table 2
can be found in the EPR Toolbox manual [23].
Parameter EPR setting
Regression type Statistical
Polynomial structure Y = sum(ai×X1×X2×f(X1)×f(X2))+ao
Function type Exponent
Term [1:5]
Range of exponents [0, 0.5, 1, 2]
Generation 10
Offset (ao) Yes
Constant estimation method Least Square
TABLE 2: Internal parameters used in the EPR modeling.
Model
variables &
data sets
Statistical parameters
Mean Standard Deviation Minimum Maximum Range
Flow discharge, Q (m
3
/s)
Training set
Testing set
7.28
7.96
6.62
7.28
0.74
1.19
47.90
35.91
47.16
34.72
Flow depth, yo (m)
Training set
Testing set
0.57
0.60
0.27
0.30
0.22
0.24
1.87
1.61
1.65
1.37
Flow velocity, V (m/s)
Training set
Testing set
0.62
0.64
0.20
0.19
0.19
0.26
1.26
1.10
1.07
0.84
Median diameter of bed material, d50
Training set
Testing set
0.0014
0.0016
0.0008
0.0010
0.0004
0.0005
0.0040
0.0039
0.0036
0.0034
Hydraulic radius, R (m)
Training set
Testing set
0.54
0.56
0.24
0.25
0.21
0.23
1.77
1.39
1.56
1.16
Stream width, B (m)
Training set
Testing set
17.85
17.92
3.70
3.89
13.50
13.80
28.00
28.00
14.50
14.20
Bed slope, So (m)
Training set
Testing set
0.0034
0.0033
0.0027
0.0027
0.0003
0.0010
0.01
0.01
0.01
0.01
Fall velocity, ωs (m
2
/s)
Training set
Testing set
0.22
0.23
0.29
0.26
0.04
0.06
1.74
1.34
1.69
1.28
Total Load, Tj (kg/s)
Training set
Testing set
2.76
3.08
3.57
3.62
0.11
0.18
28.52
17.85
28.41
17.66
7. Nadiatul A. Abdul Ghani, Mohamed A. Shahin & Hamid R. Nikraz
International Journal of Engineering (IJE), Volume (6) : Issue (5) : 2012 268
3.1 Performance indicators
As mentioned earlier, the optimum EPR model was obtained by a trial-and-error approach in
which a number of EPR models were trained with different internal modelling parameters, and
three models were found to give the best results, as shown in Table 3. It can be seen that five
performance measures that evaluate the relationship between the measured and predicted total
loads were used, namely: the coefficient of correlation, r, coefficient of efficiency, E, root mean
squared error, RMSE, discrepancy ratio, DR, and Akaike information criterion, AIC. The
coefficient of correlation, r, is the performance measure that is widely used in civil engineering but
sometimes can be biased in reflecting higher or lower values, leading to misleading model
performance. The coefficient of efficiency, E, is an unbiased performance estimate and provides
an assessment of the overall model performance, which can range from minus infinity to 1.0, with
higher values indicating better agreement [25]. The RMSE has the advantage in that large errors
receive much greater attention than small errors, as indicated by Shahin et al. [26]. The
discrepancy ratio, DR, is the ratio between the predicted and measured total sediment loads, and
a model is considered to be suitable if its discrepancy ratio falls within the range of 0.5−2.0, as
indicated by Sinnakaudan et al. [8]. The AIC gives an estimate of the expected relative distance
between the fitted model and the unknown true model. The smallest value of AIC is considered to
be the most favourable amongst the set of candidate models [27].
Table 3 shows that the three best EPR models have r, E, RMSE and DR close to each other and
that all three models have consistent performance in both the training and testing sets. However,
based on the AIC results, Table 3 shows that Model 1 is superior to the other models and can be
considered to be optimal.
Performance
measurement
Model 1 Model 2 Model 3
Correlation coefficient, r
Training 0.72 0.72 0.73
Validation 0.74 0.74 0.74
Coefficient of efficiency, E
Training 0.52 0.52 0.52
Validation 0.55 0.55 0.55
RMSE
Training 2.46 2.46 2.46
Validation 2.41 2.41 2.41
Discrepancy ratio, DR
Training 0.68 0.69 0.69
Validation 0.64 0.66 0.66
AIC
Training 0.00 4.10 4.00
Validation 0.00 5.20 5.20
TABLE 3: Performance results of the EPR models in the training and testing sets.
As can be seen in the following equations (i.e. Eqns. 3 5), Model 1 has only 6 input variables
(Eqn. 3), whereas both Model 2 (Eqn. 4) and Model 3 (Eqn. 5) have 8 input variables each. It
should be noted that the performance results of these models are considered to be acceptable in
representing the sediment transport problem compared to those of most available methods, as
will be seen in the next section. The symbolic formulae obtained from the EPR Models are as
follows:
8. Nadiatul A. Abdul Ghani, Mohamed A. Shahin & Hamid R. Nikraz
International Journal of Engineering (IJE), Volume (6) : Issue (5) : 2012 269
Tj = 226356.81 V d50
2
+ 18.37 Q 0.5
Yo So
0.5
e 0.5V
+ 0.000012 Q d50
0.5
e0.5B
(3)
Tj = 222250.88 V d50
2
+ 18.17 Q 0.5
Yo So
0.5
e0.5V
+ 0.000012 Q d50
0.5
e0.5B
+1.23 Q Yo WS
2
R2
SO e2Ws+2R
(4)
Tj = 162.24 B2
Yo Ws
2
R2
So
2
+ 222624.92 V d50
2
+ 18.15 Q 0.5
Yo So
0.5
e0.5V
+ 0.000012Qd50
0.5
e0.5B
+
0.000023 Q2
Ws R2
e2R
(5)
where: Tj is the total sediment load, V is the flow velocity, d50 is the median diameter of sediment
load, Q is the flow discharge, Yo is the flow depth, So is the water surface slope, B is the stream
width, R is the hydraulic radius and ωs is the fall velocity.
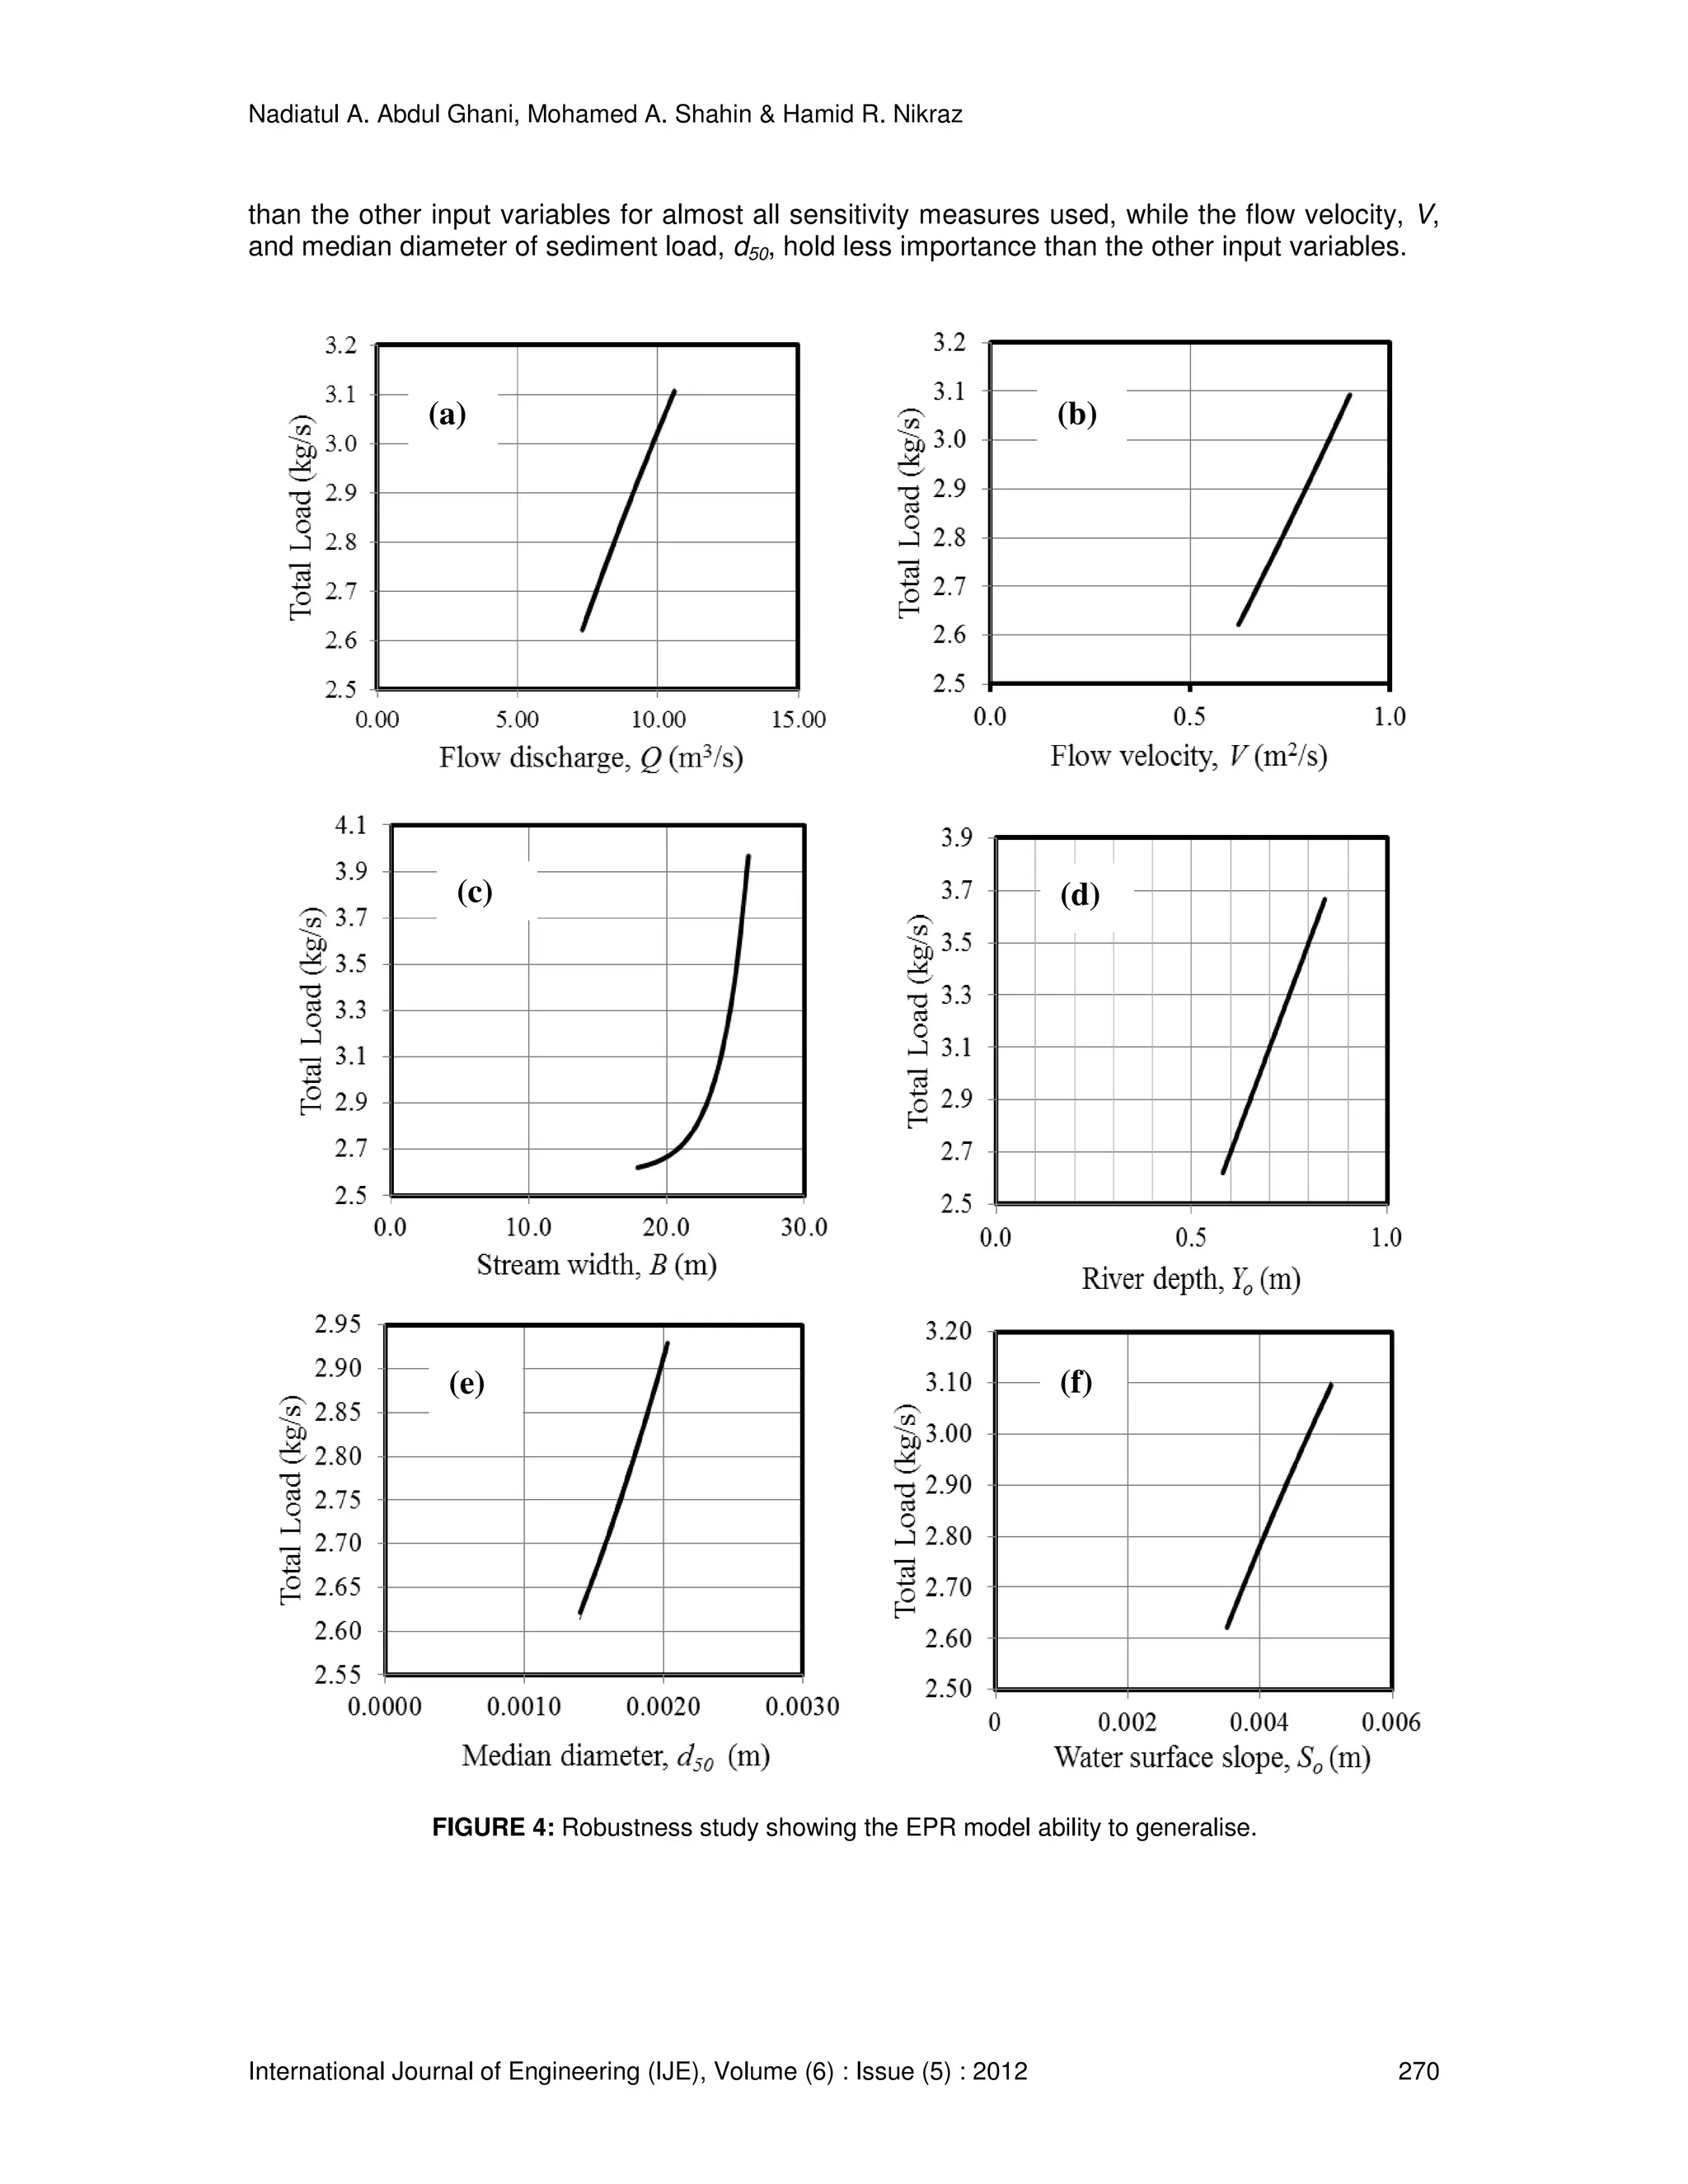
3.2 Robustness study
In order to confirm the robustness of the EPR model to generalise within the range of the data
used for model training, an additional validation approach was utilised, as proposed by Shahin et
al. [26]. The approach consists of carrying out a parametric study, part of which includes
investigating the response of the EPR model output to changes in its inputs. All input variables,
except one, were fixed to the mean values used for training, and a set of synthetic data (between
the minimum and maximum values used for model training), was generated for the input that was
not set to a fixed value. The synthetic data set was generated by increasing its values in
increments equal to 5% of the total range between the minimum and maximum values, and the
model response was then examined. This process was repeated using another input variable until
the model response has been tested for all input variables. The robustness of the model was
tested by examining how well the trends of the total sediment loads, over the range of the inputs
examined, are in agreement with the underlying physical meaning of sediment problem. The
results of the robustness study are shown in Figure 4, which agree with hypothetical expectations
based on the known physical behaviour of the total sediment load. Figures 4 (a f) shows that the
predicted total sediment load increases in a relatively consistent and smooth fashion, as the
discharge, velocity, width, river depth, median diameter, slope, hydraulic radius and fall velocity
increase.
3.3 Interpretive ability of EPR model
When evaluating the EPR model, consideration must be given not only to its predictive accuracy
but also to the interpretive ability of the model. This can be made by carrying out a sensitivity
analysis that quantifies the relative importance of model inputs to the corresponding outputs. In
this study, the relative importance was determined using three different sensitivity measures,
namely the range (ra), gradient (ga) and variance (va), as follows [28]:
)min()max( aaa yyr −=
(6)
)1/(
2
1,, −∑ −=
=
− Lyyg
L
j
jajaa
(7)
)1/()(
2
2
, −∑ −=
=
Lyyv
L
j
ajaa
(8)
For all of the above metrics, the higher the value the more relevant is the input. Thus, the relative
importance (Ra) can be given as follows [29]:
∑ ×=
=
I
i
iaa ssR
1
(%)100/
(9)
where: ya,j is the sensitivity response for xa,j and s is the sensitivity measure (i.e. r, g or v). Figure
5 shows the graphical representation of the relative importance measures in the form of bar
charts. It can be seen from Figure 5 that the river depth, Yo, seems to provide greater importance
9. Nadiatul A. Abdul Ghani, Mohamed A. Shahin & Hamid R. Nikraz
International Journal of Engineering (IJE), Volume (6) : Issue (5) : 2012 270
than the other input variables for almost all sensitivity measures used, while the flow velocity, V,
and median diameter of sediment load, d50, hold less importance than the other input variables.
FIGURE 4: Robustness study showing the EPR model ability to generalise.
(a) (b)
(c) (d)
(e) (f)
10. Nadiatul A. Abdul Ghani, Mohamed A. Shahin & Hamid R. Nikraz
International Journal of Engineering (IJE), Volume (6) : Issue (5) : 2012 271
3.4 Comparison of optimum EPR model with available models
In order to examine the accuracy of the developed EPR model against other available models,
the EPR model predictions were compared with those obtained from six available sediment
transport models, including Engelund & Hansen [1], Graf [2], Ariffin [9], Chan et al. [10],
Sinnakaudan et al. [8], Zakaria et al. [30] and Aminuddin et al. [33]. A summary of the sediment
parameters for other available methods used for comparison is given in Table 4. Statistical
analyses, in relation to the 67 cases of the validation set, were carried out and the results are
given numerically in Table 5 and represented graphically in Figure 6.
FIGURE 5: Sensitivity analysis showing the relative importance of the EPR model inputs.
Range (ra)
Variance (va)
Gradient (ga)
11. Nadiatul A. Abdul Ghani, Mohamed A. Shahin & Hamid R. Nikraz
International Journal of Engineering (IJE), Volume (6) : Issue (5) : 2012 272
Model Input parameters used
Engelund–Hansen [1] 5.1
5050
2
)/(,)/(/,, dgdV wswss γγτγγγ −
Graf [2] 3
5050 )1(/,/)1( dSgVRCRSdS svos −−
Ariffin [9]
os gyVVUωUdR /,/,/,/ 2**
50
Chan et al. [10]
5050 )1(/,/)1( dSgVRCRSdS svos −−
Sinnakaudan et al. [8]
VRdSgdRVS sso /)1(,/,/
3
5050 −ω
Zakaria et al. [30] Q, V, B, Yo, R, So, Ws,d50
Ab. Ghani et al. [32] Q, V, B, Yo, A, P, So
γs = unit weight of sediment; V = flow velocity; d50 = median diameter of sediment load; g = acceleration of
gravity; γw = unit weight of water; τ = mean bed shear stress; Ss = specific gravity of sediment; R = hydraulic
radius; Cv = volumetric sediment concentration; U* = shear velocity, ωs = fall velocity, Q = flow discharge; B
= stream width, Yo = flow depth, So = water surface slope; A = river cross sectional area, P = river perimeter.
TABLE 4: Summary of sediment parameters used in available methods.
It can be seen from Table 5 that the EPR model outperforms the other available methods in all
performance measures used. It can also be seen that the model developed by Sinnakaudan et al.
[8] comes second in order of best model performance. The graphical results also indicate that
both the EPR model and Sinnakaudan et al. [8] have the least scattering around the line of
equality between the predicted and measured sediment total loads, and this observation is
confirmed numerically by the efficiency values, E, obtained in Table 5.
Model
Performance measure
R RMSE E DR AIC
Engelund & Hansen [1] 0.59 17.72 -23.28 0.21 94.8
Graf [2] 0.39 23.46 -8088.71 0.19 258.9
Ariffin [9] 0.47 3.63 -0.02 0.46 0.0
Chan et al. [10] 0.39 13.75 -13.62 0.15 75.1
Sinnakaudan et al. [8] 0.64 2.97 0.32 0.53 12.2
Zakaria et al. [30] 0.40 4.33 -0.45 0.24 39.2
Current study (EPR) 0.74 2.41 0.55 0.64 0.0
TABLE 5: Comparison of EPR model and other available methods (validation set – 67 data cases).
12. Nadiatul A. Abdul Ghani, Mohamed A. Shahin & Hamid R. Nikraz
International Journal of Engineering (IJE), Volume (6) : Issue (5) : 2012 273
Ariffin (2004)
Engelund & Hansen (1967)
Chan et al. (2005)
Graf (1971)
Sinnakaudan et al. (2006) Zakaria et al. (2010)
13. Nadiatul A. Abdul Ghani, Mohamed A. Shahin & Hamid R. Nikraz
International Journal of Engineering (IJE), Volume (6) : Issue (5) : 2012 274
FIGURE 6: Predicted vs measured total sediment load for EPR and other methods.
4. CONCLUSIONS
This study investigated the use of the Evolutionary Polynomial Regression (EPR) technique in
developing a new model for predicting sediment transport in Malaysian rivers. The data used for
model calibration and validation involved 338 cases that were collected from the Department of
Irrigation and Drainage (DID), Ministry of Natural Resources & Environment, Malaysia. The data
were divided into 80% for model calibration (training) and 20% for model validation (testing). The
EPR models were trained with eight input variables that thought to be significant including the
hydraulic radius (R), flow depth (Yo), flow velocity (V), median diameter of sediment load (d50),
stream width (B), water surface slope (So), fall velocity (ωs) and flow discharge (Q). The only
output is the total sediment load (Tj). Robustness study to investigate the generalisation ability of
the developed EPR model was conducted, and a sensitivity analysis was also carried out to
check the relative importance of model inputs to the corresponding output. Predictions from the
developed EPR model were compared with those obtained from six available methods including:
Engelund & Hansen [1], Graf [2], Ariffin [9], Chan et al. [10], Sinnakaudan et al. [8] and Zakaria et
al. [30]. The statistical analyses used for comparison of performance of models included the
coefficient of correlation, r, root mean squared error, RMSE, coefficient of efficiency, E,
discrepancy ratio, DR, and Akaike information criterion, AIC.
The results indicate that the EPR model with six input variables (i.e. R, Yo, d50, B, So and Q)
provided the best performance and was thus considered to be optimal. This optimum EPR model
showed better performance, in relation to the validation set, than the other methods used for
comparison with less scattering around the line of equality between the measured and predicted
total sediment loads. For the EPR model: r, RMSE, E, DR and AIC were found to be equal to
0.74, 2.41, 0.55, 0.64 and 0.0, respectively. These measures were found to outperform those of
the other available methods. The EPR model was also found to be robust in terms of its
generalisation ability as its behaviour was found to be in agreement with the underlying physical
meaning of sediment transport. The sensitivity analysis indicated that the river depth, Yo, provided
greater importance than the other input variables, while the flow velocity, V, and median diameter
of sediment load, d50, and hold less importance than the other input variables. The above results
indicate a high potential for using the EPR model over available methods for predicting the total
sediment load of Malaysian rivers.
Current Study (EPR)
14. Nadiatul A. Abdul Ghani, Mohamed A. Shahin & Hamid R. Nikraz
International Journal of Engineering (IJE), Volume (6) : Issue (5) : 2012 275
5. REFERENCES
[1] Engelund F. and Hansen. A monograph on sediment transport in alluvial streams.
Denmark: Copenhagen. Teknisk Forlag, 1967.
[2] Graf W.H. Hydraulics of sediment transport. New York: McGraw Hill, 1971.
[3] Ackers P. and White W.R. (1973) “Sediment transport: new approach and analysis.”
Journal of the Hydraulics Division. ASCE, vol. 99(11), pp. 2041-2060, 1973.
[4] Yang C.T and Molinas A. “ Sediment transport and unit stream power function”, Journal
of Hydraulic Engineering, ASCE, vol. 108(6), pp. 774-793, 1982.
[5] Van Rijn L.C. “Mathematical modelling of suspended sediment in non-uniform flows.”
Journal of Hydraulic Engineering, ASCE, vol. 112(6), pp. 433-455, 1986.
[6] Karim F. “Bed material discharge prediction for non-uniform bed sediments.” Journal of
Hydraulic Engineering, ASCE, vol. 124(6), pp. 597-604, 1998.
[7] Nagy H.M., Watanabe K. and Hirano M. “Prediction of sediment load concentration in
rivers using artificial neural network model.” Journal of Hydraulic Engineering, ASCE, vol.
128(6), pp. 558-595, 2002.
[8] Sinnakaudan S.K., Ab.Ghani A., Ahmad M.S. and Zakaria N.A. “Multiple linear regression
model for total bed material load prediction.” Journal of Hydraulic Engineering, ASCE,
vol. 132(5), pp. 521−528, 2006.
[9] Ariffin J. “Development of sediment transport models for rivers in Malaysia using
regression analysis and artificial neural networks.” PhD Thesis, Universiti Sains Malaysia,
Malaysia, 2004.
[10] Chan C.K., Ab. Ghani, A., Zakaria N.A., Abu Hasan Z. and Abdullah R. “Sediment
transport equation assessment for selected rivers in Malaysia.” International Journal of
River Basin Management, vol. 3(3), pp. 203−208, 2005.
[11] Giustolisi O., Doglioni A., Savic D.A. and Webb, B.W. “A multi-model approach to
analysis of environmental phenomena.” Environmental Modelling & Software Journal. vol,
22 pp. 674−682, 2007.
[12] Giustolisi, O., Savic, D.A., “Evolutionary Polynomial Regression (EPR): Development and
Application.” Report 2003/1. School of Engineering, Computer Science and
Mathemathics, Centre for Water Systems, University of Exeter, 2003.
[13] Azamathulla, H. Md., Chang, C.K., Ab. Ghani. A., Ariffin, J., Zakaria, N.A. and Abu
Hassan, Z. “An ANFIS-based approach for predicting the bed load for moderately sized
rivers.” Journal of Hydro-environmental Research”, vol. 3, pp. 35-44, 2009.
[14] Giustolisi, O. and Savic D.A. “A symbolic data driven technique based on Evolutionary
Polynomial Regression.” Journal of Hydroinformatics, vol. 8(3), pp. 207−222, 2006.
[15] Savic D.A., Giutolisi O., Berardi L., Shepherd W., Djordjevic S. and Saul A. “Modelling
sewer failure by evolutionary computing.” Proceeding of the Institution of Civil Engineers,
Water Management, vol. 159(2), pp. 111−118, 2006.
15. Nadiatul A. Abdul Ghani, Mohamed A. Shahin & Hamid R. Nikraz
International Journal of Engineering (IJE), Volume (6) : Issue (5) : 2012 276
[16] Berardi L., Giustolisi O., Kapelan Z. and Savic, D.A. “Development of pipe
deterioration models for water distribution systems using EPR.” Journal of Hydro
Informatics, vol. 10(2), pp. 113−126, 2008.
[17] Giustolisi O., Doglioni A., Savic D.A. and Pierro F. “An evolutionary multiobjective
strategy for the effective management of groundwater resources.” Water Resources
Research Journal, vol. 44(W01403), pp. 1−14, 2008.
[18] Draper N.R., and Smith H. Applied regression analysis. New York: John Wiley and Sons,
1998.
[19] Koza J.R. Genetic programming: on the programming of computers by means of natural
selection. MIT Press, Massachusetts, 1992.
[20] Watson A., Parmee I. “System identification using genetic programming” Proceedings of
ACEDC’96, University of Plymouth, United Kingdom, 1996.
[21] Goldberg D.E. Genetic algorithms in search, optimization and machine learning,
Massachussets: Addison Wesley, 1989.
[22] Giustolisi, O. and Savic D.A. “A novel strategy to perform genetic programming:
Evolutionary Polynomial Regression. “Sixth International Conference on
Hydroinformatics, Singapore, 2004, pp. 787-794.
[23] Laucelli D., Berardi L. and Dogliono A. Evolutionary polynomial regression (EPR) −
toolbox, Version 2.0 SA, Department of Civil and Environmental Engineering, Technical
University of Bari, Italy, 2009.
[24] Shahin M.A., Maier H.R. and Jaksa M.B. “Data division for developing neural networks
applied to geotechnical engineering.” Journal of Computing in Civil Engineering, ASCE,
vol. 18(2), pp.105−114, 2004.
[25] Legates D.R. and McCabe Jr. G.J. “Evaluating the use of “Goodness-of-Fit” measures in
hydrologic and hydroclimatic model validation.” Water Resources Research, vol. 35(1),
pp. 233−241, 1999.
[26] Shahin M.A., Maier H.R. and Jaksa M.B. “Investigation into the robustness of artificial
neural networks for a case study in civil engineering.” International Congress on
Modelling and Simulation: Melbourne, 2004.
[27] Shaqlaih A., White L. and Zaman M. “Resilient modulus modeling with information theory
approach.” International Journal of Geomechanics, in press.
[28] Kewley R., Embrechts M. and Breneman C.”Data strip mining for the virtual design of
pharmaceuticals with neural networks.” IEEE Trans Neural Networks, vol. 11(3), pp. 668-
679, 2000.
[29] Cortez P., Cerdeira A., Almeida F., Matos T., and Reis J. “Modeling wine preferences by
data mining from physicochemical properties.” Decision Support Systems, vol. 47(4), pp.
547-553, 2009.
[30] Zakaria N.A, Azamathulla H.Md, Chang C.K. and Ab. Ghani A. “Gene expression
programming for total bed material load estimation-a case study.” Journal of Science of
the Total Environment, vol. 408(21), pp. 5078-5085, 2010.
16. Nadiatul A. Abdul Ghani, Mohamed A. Shahin & Hamid R. Nikraz
International Journal of Engineering (IJE), Volume (6) : Issue (5) : 2012 277
[31] Rezania M., Faramarzi A. and Javadi A. “An evolutionary based approach for
assessment of earthquake-induced soil liquefaction and lateral displacement.”
Engineering Applications of Artificial Intelligence, vol. 24(1), pp. 142-153, 2011.
[32] Ab. Ghani, A., Azamathulla, H.Md., Chang, C.K., Zakaria, N.A., Hassan, Z.A. “ Prediction
of total material load for rivers in Malaysia: A case study of Langat, Muda and Kurau
Rivers.” Environ Fluid Mech, vol. 11, pp. 307-318, 2011.