Download to read offline

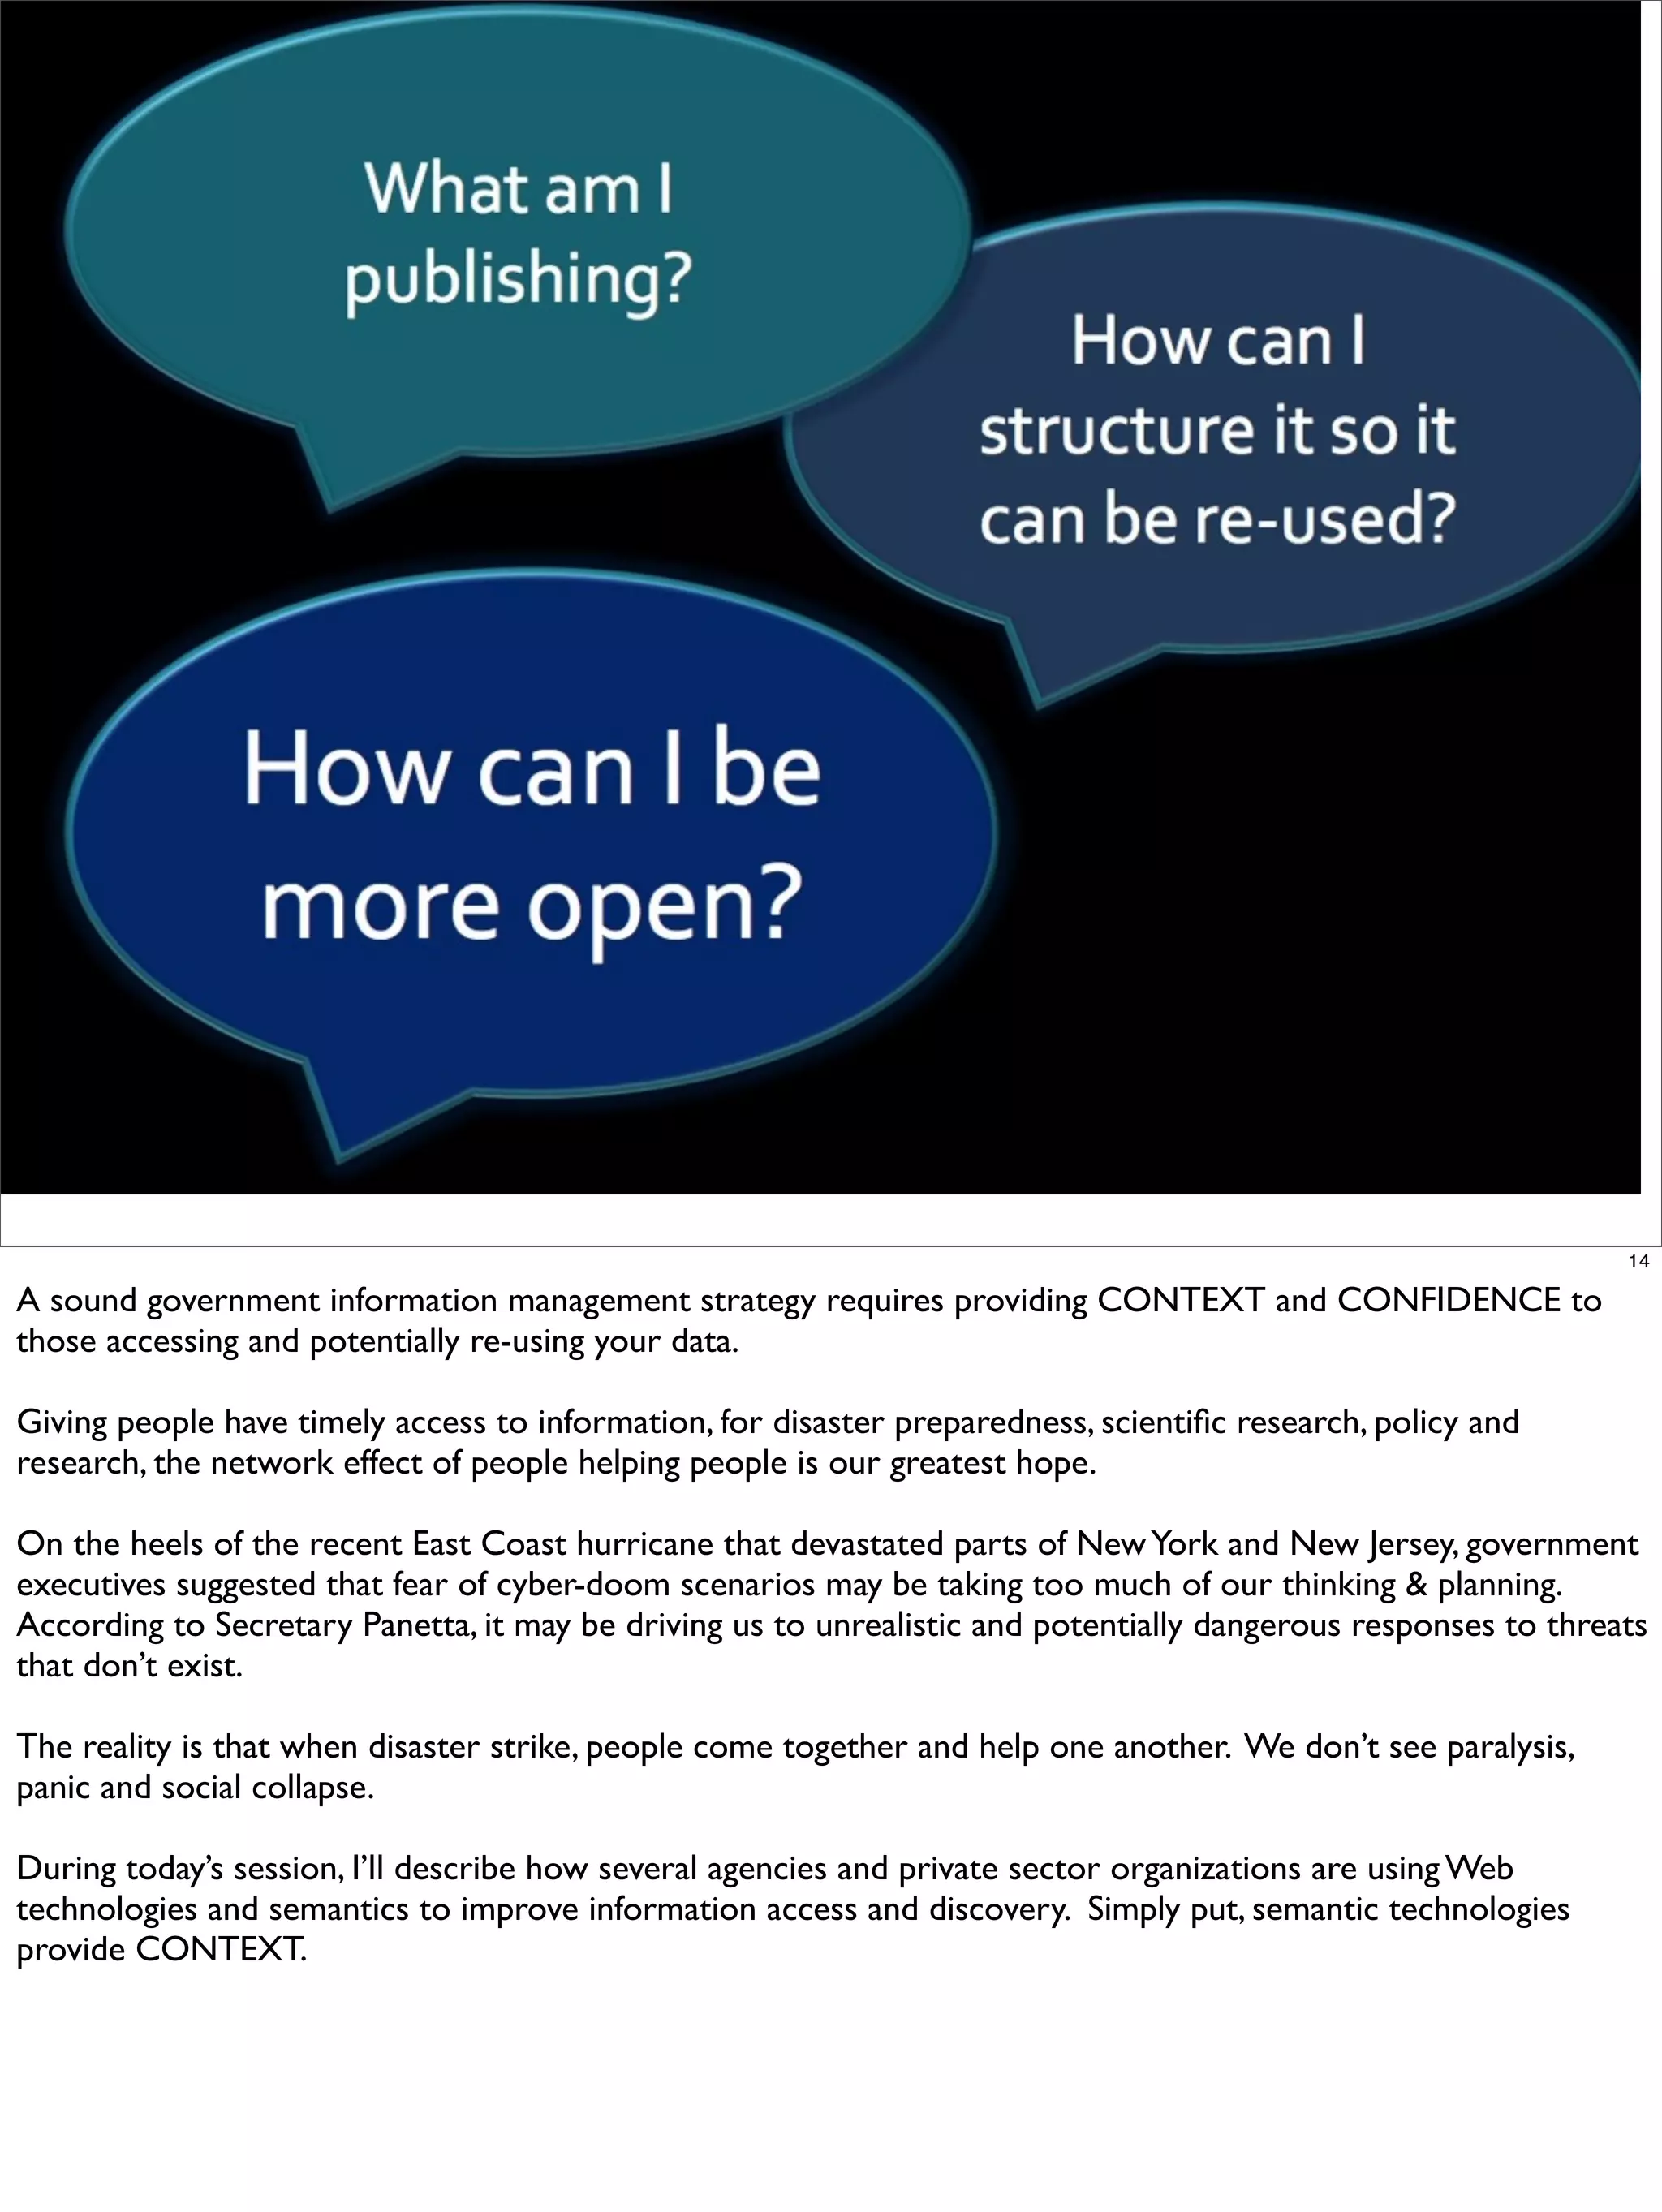
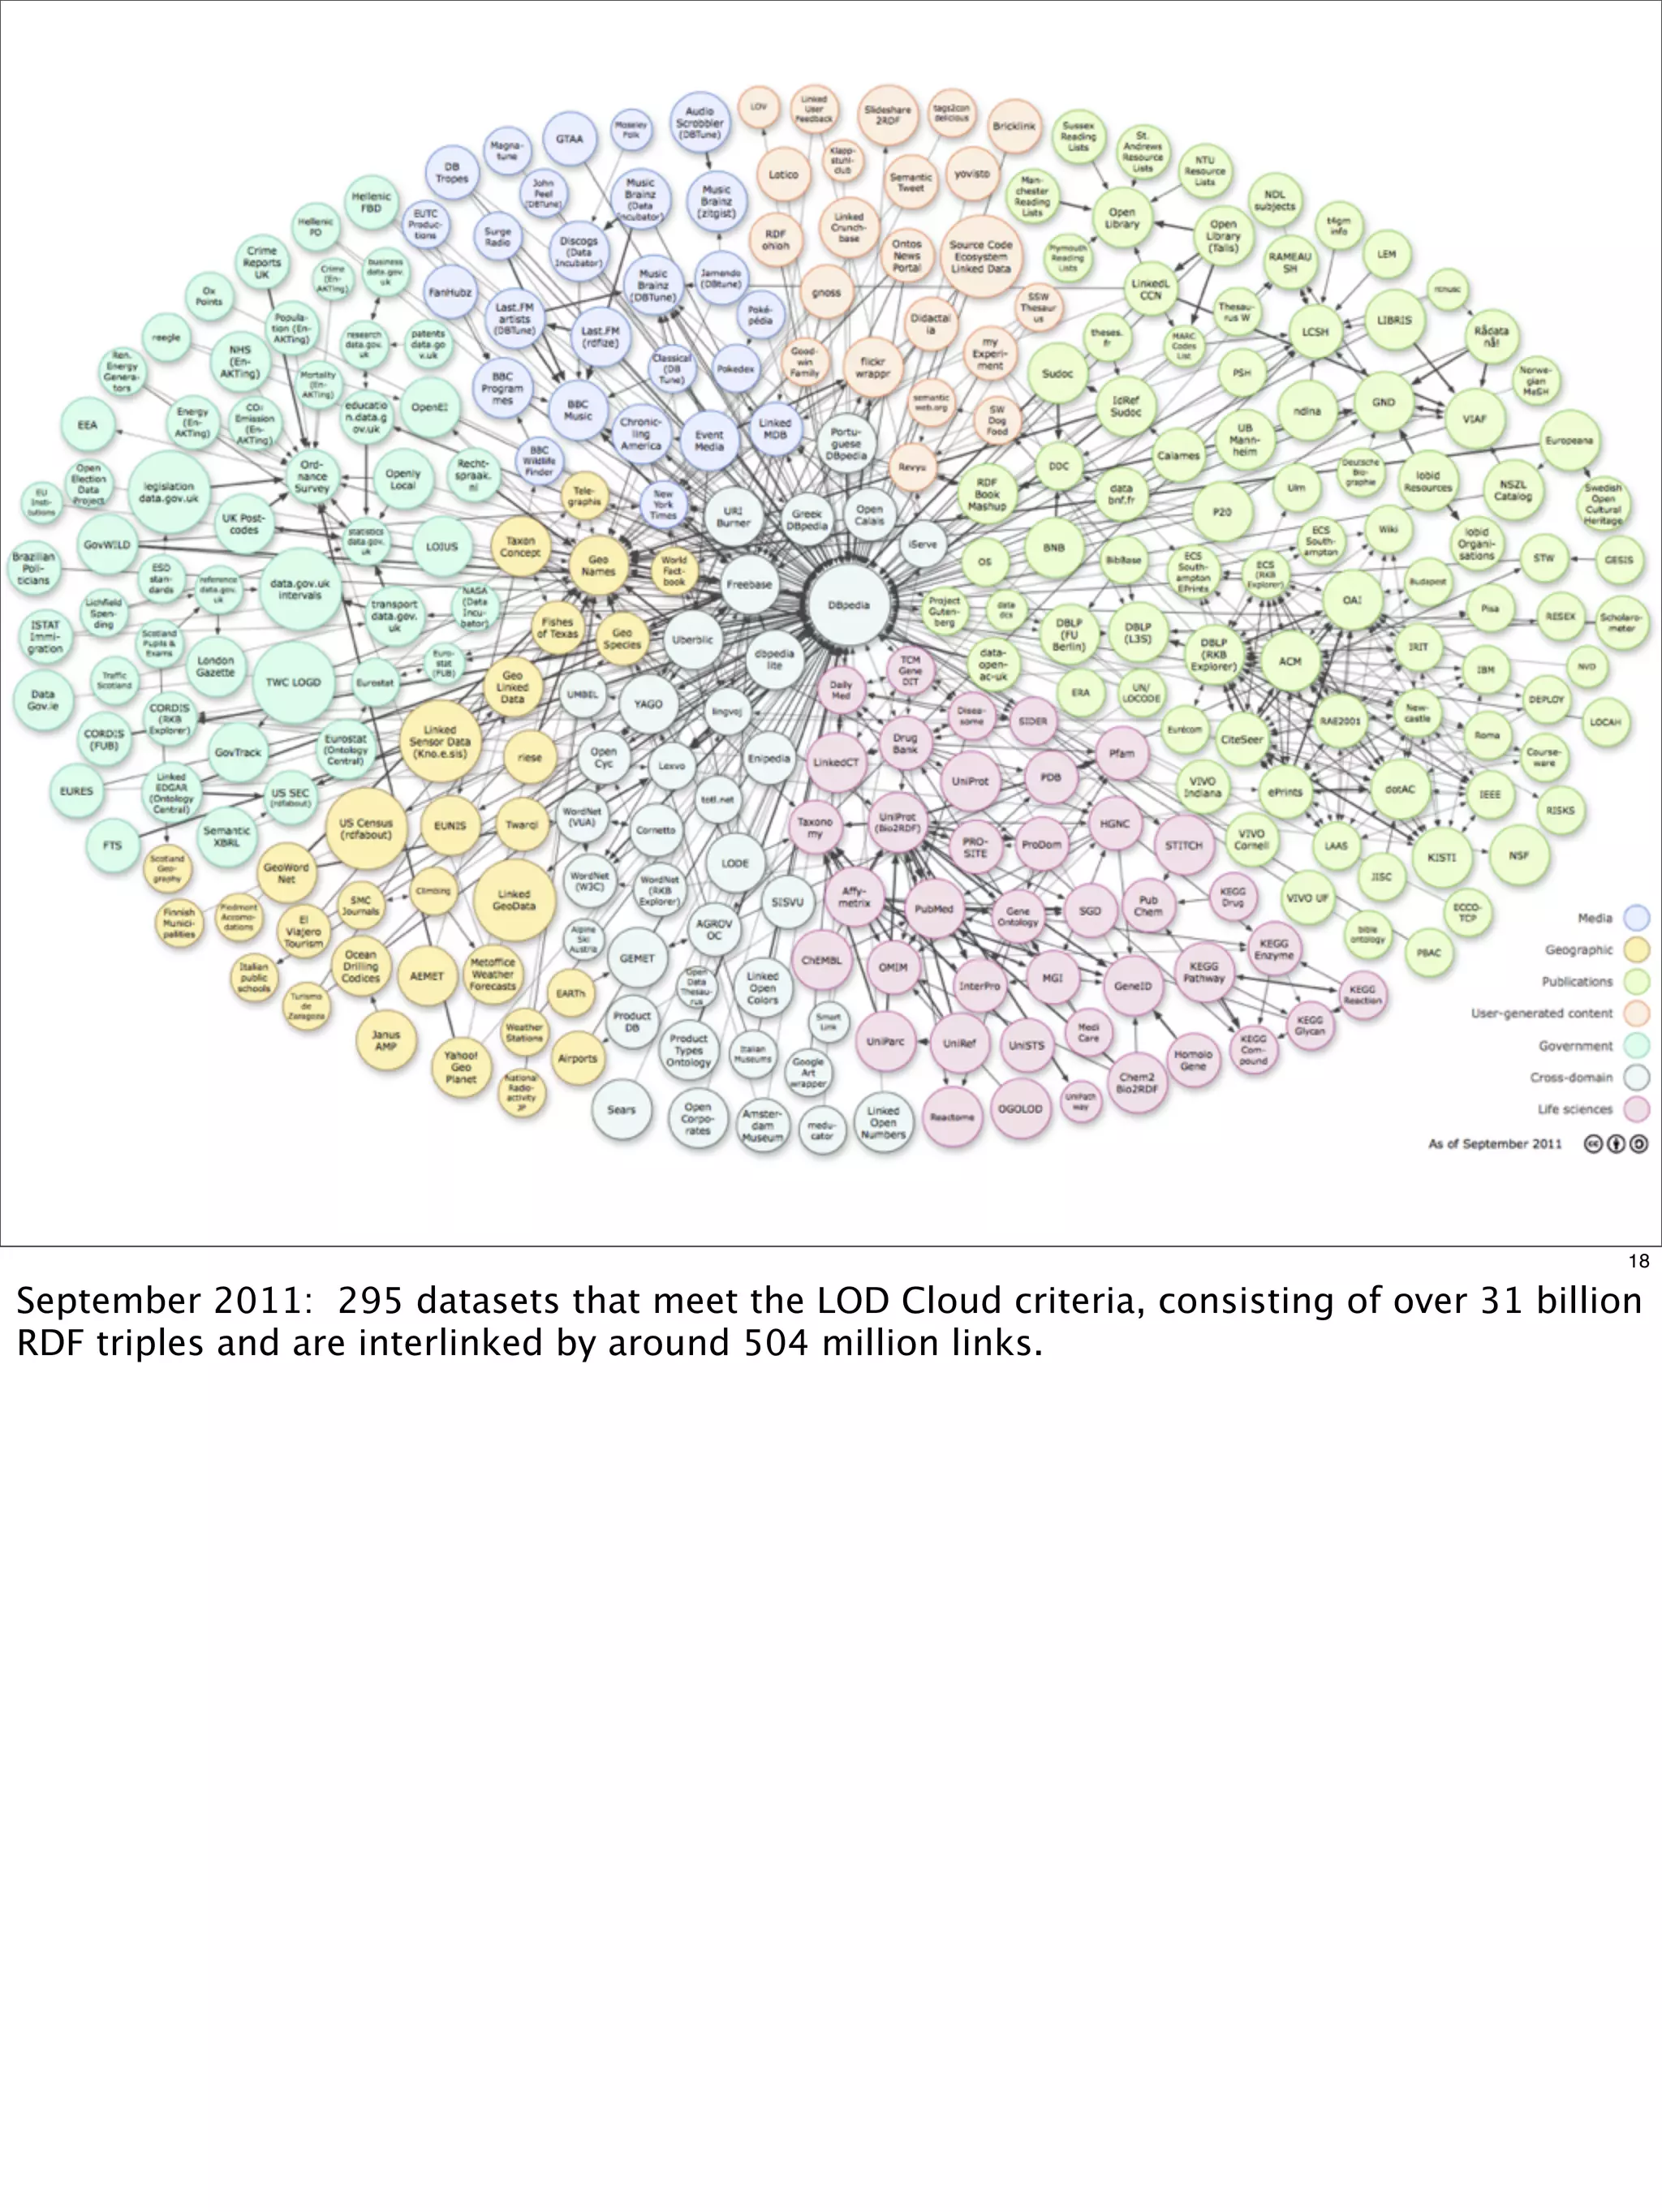
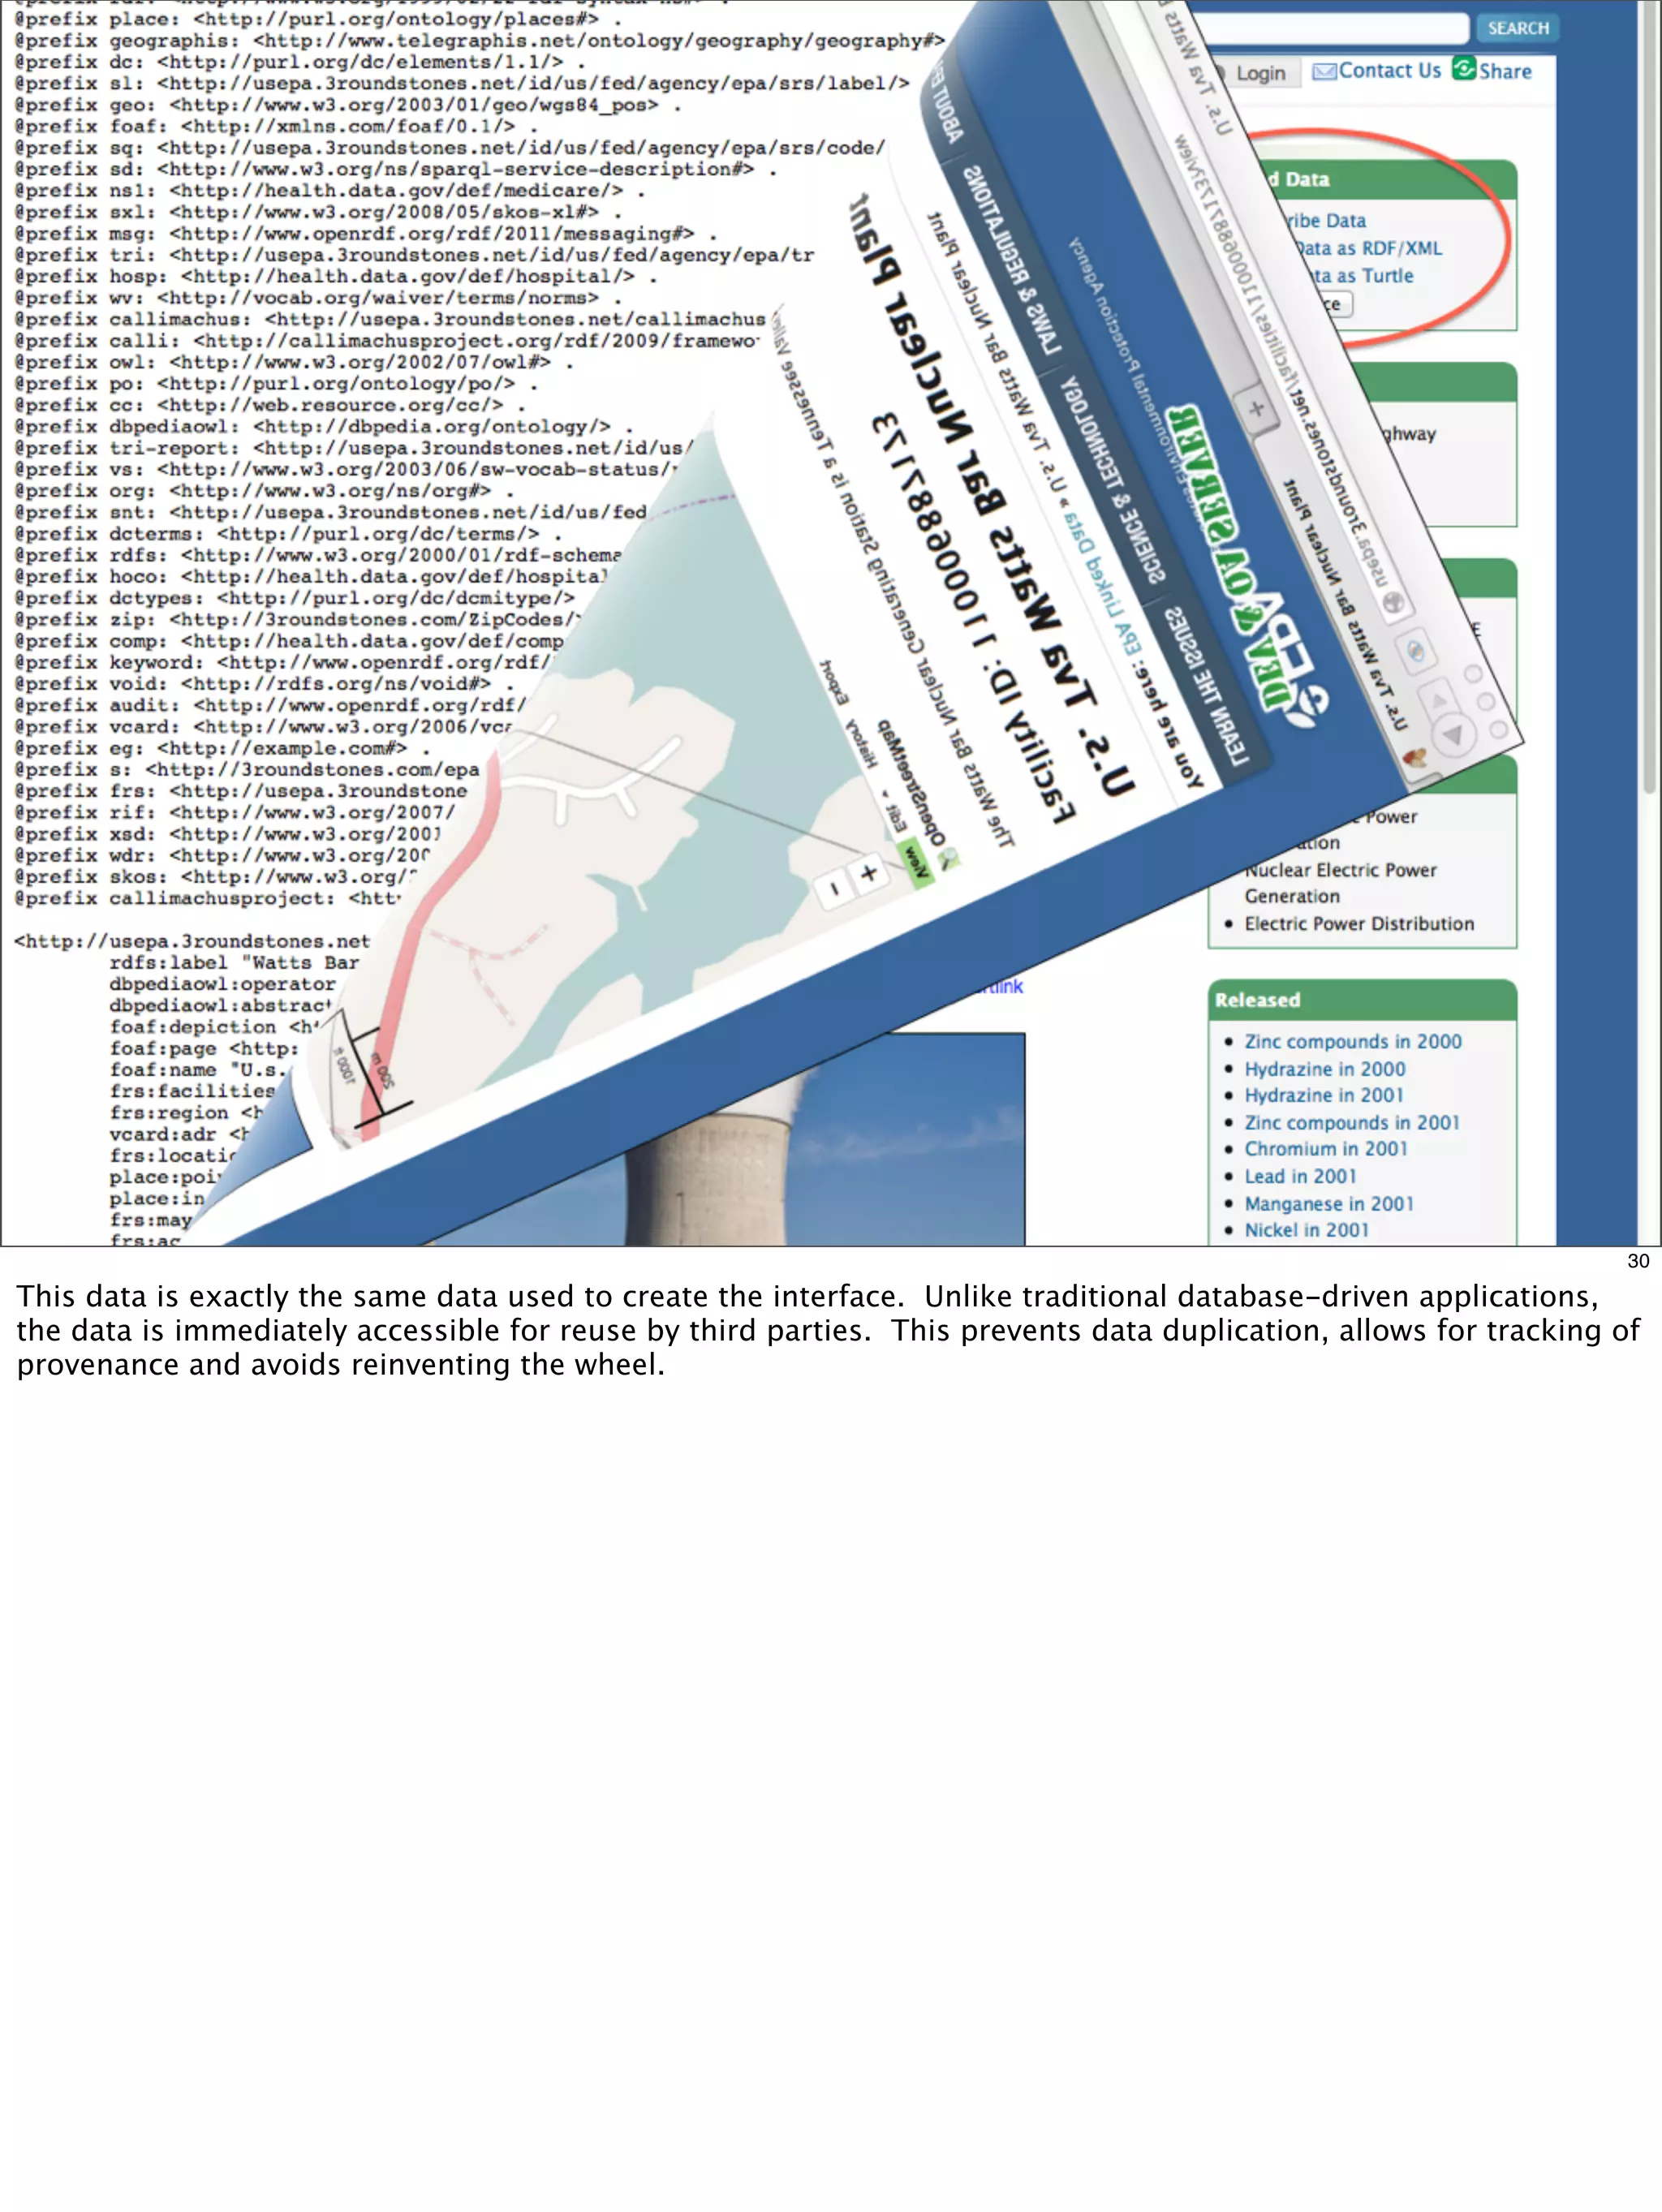
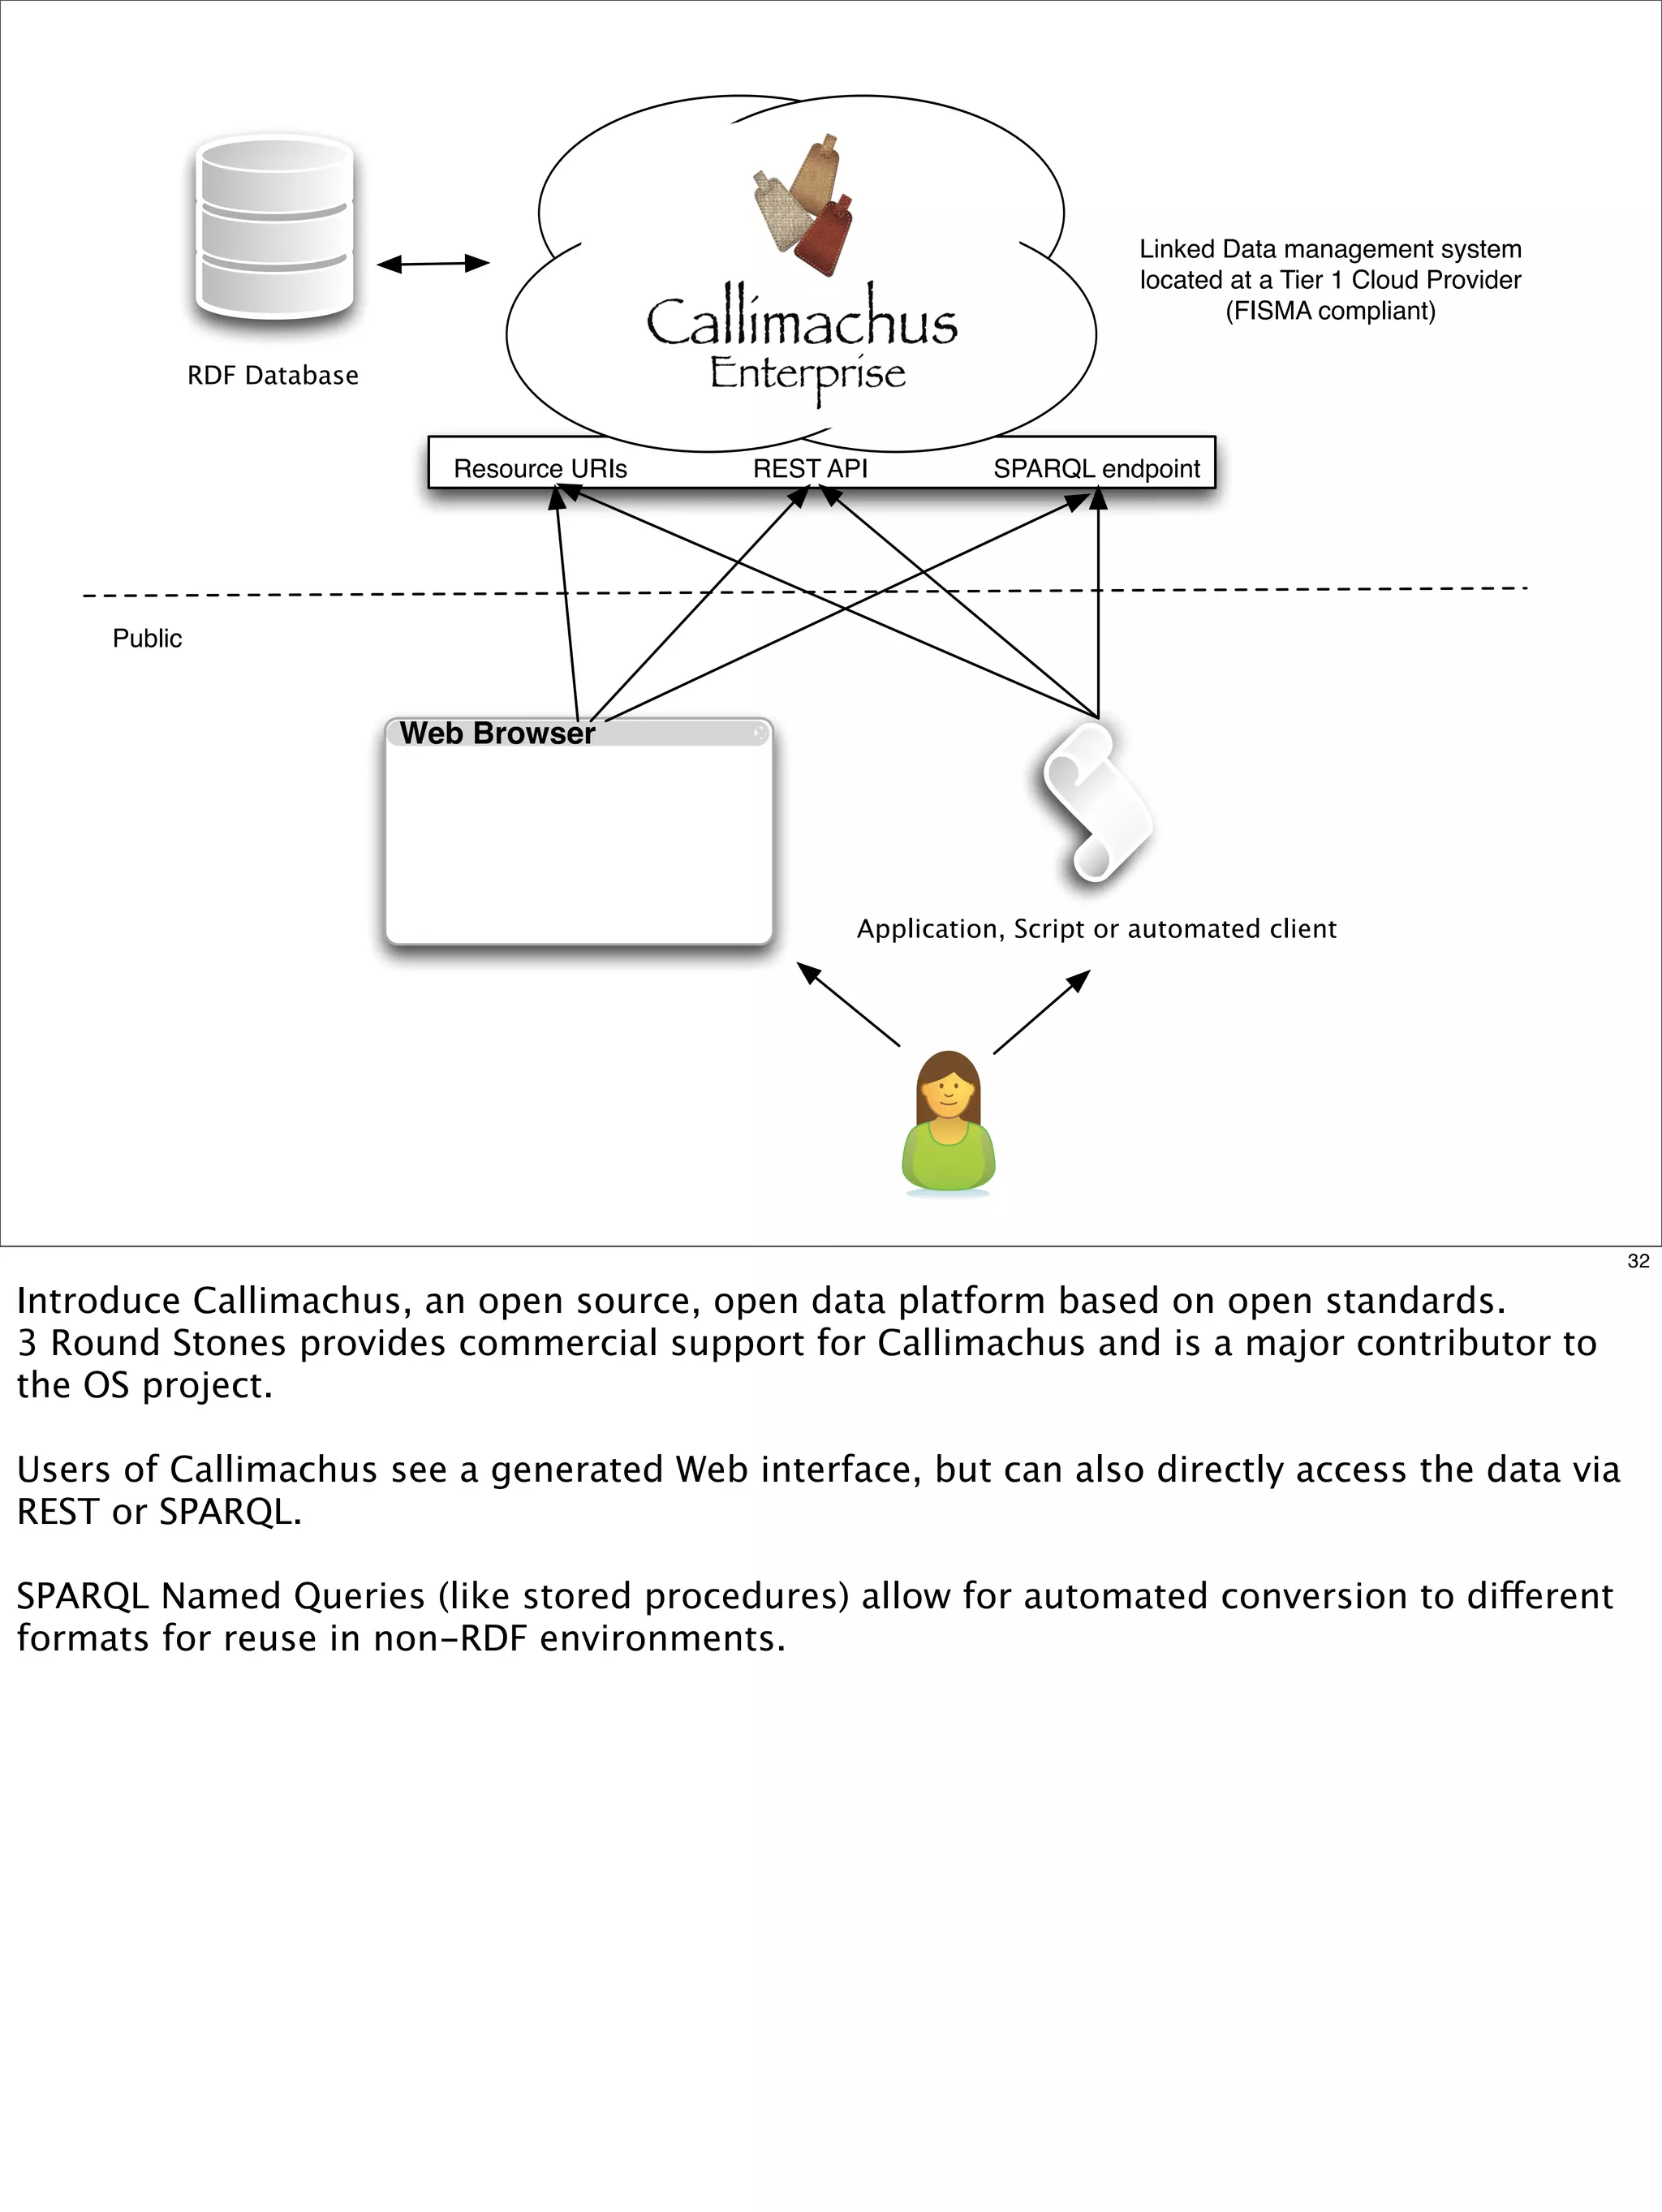
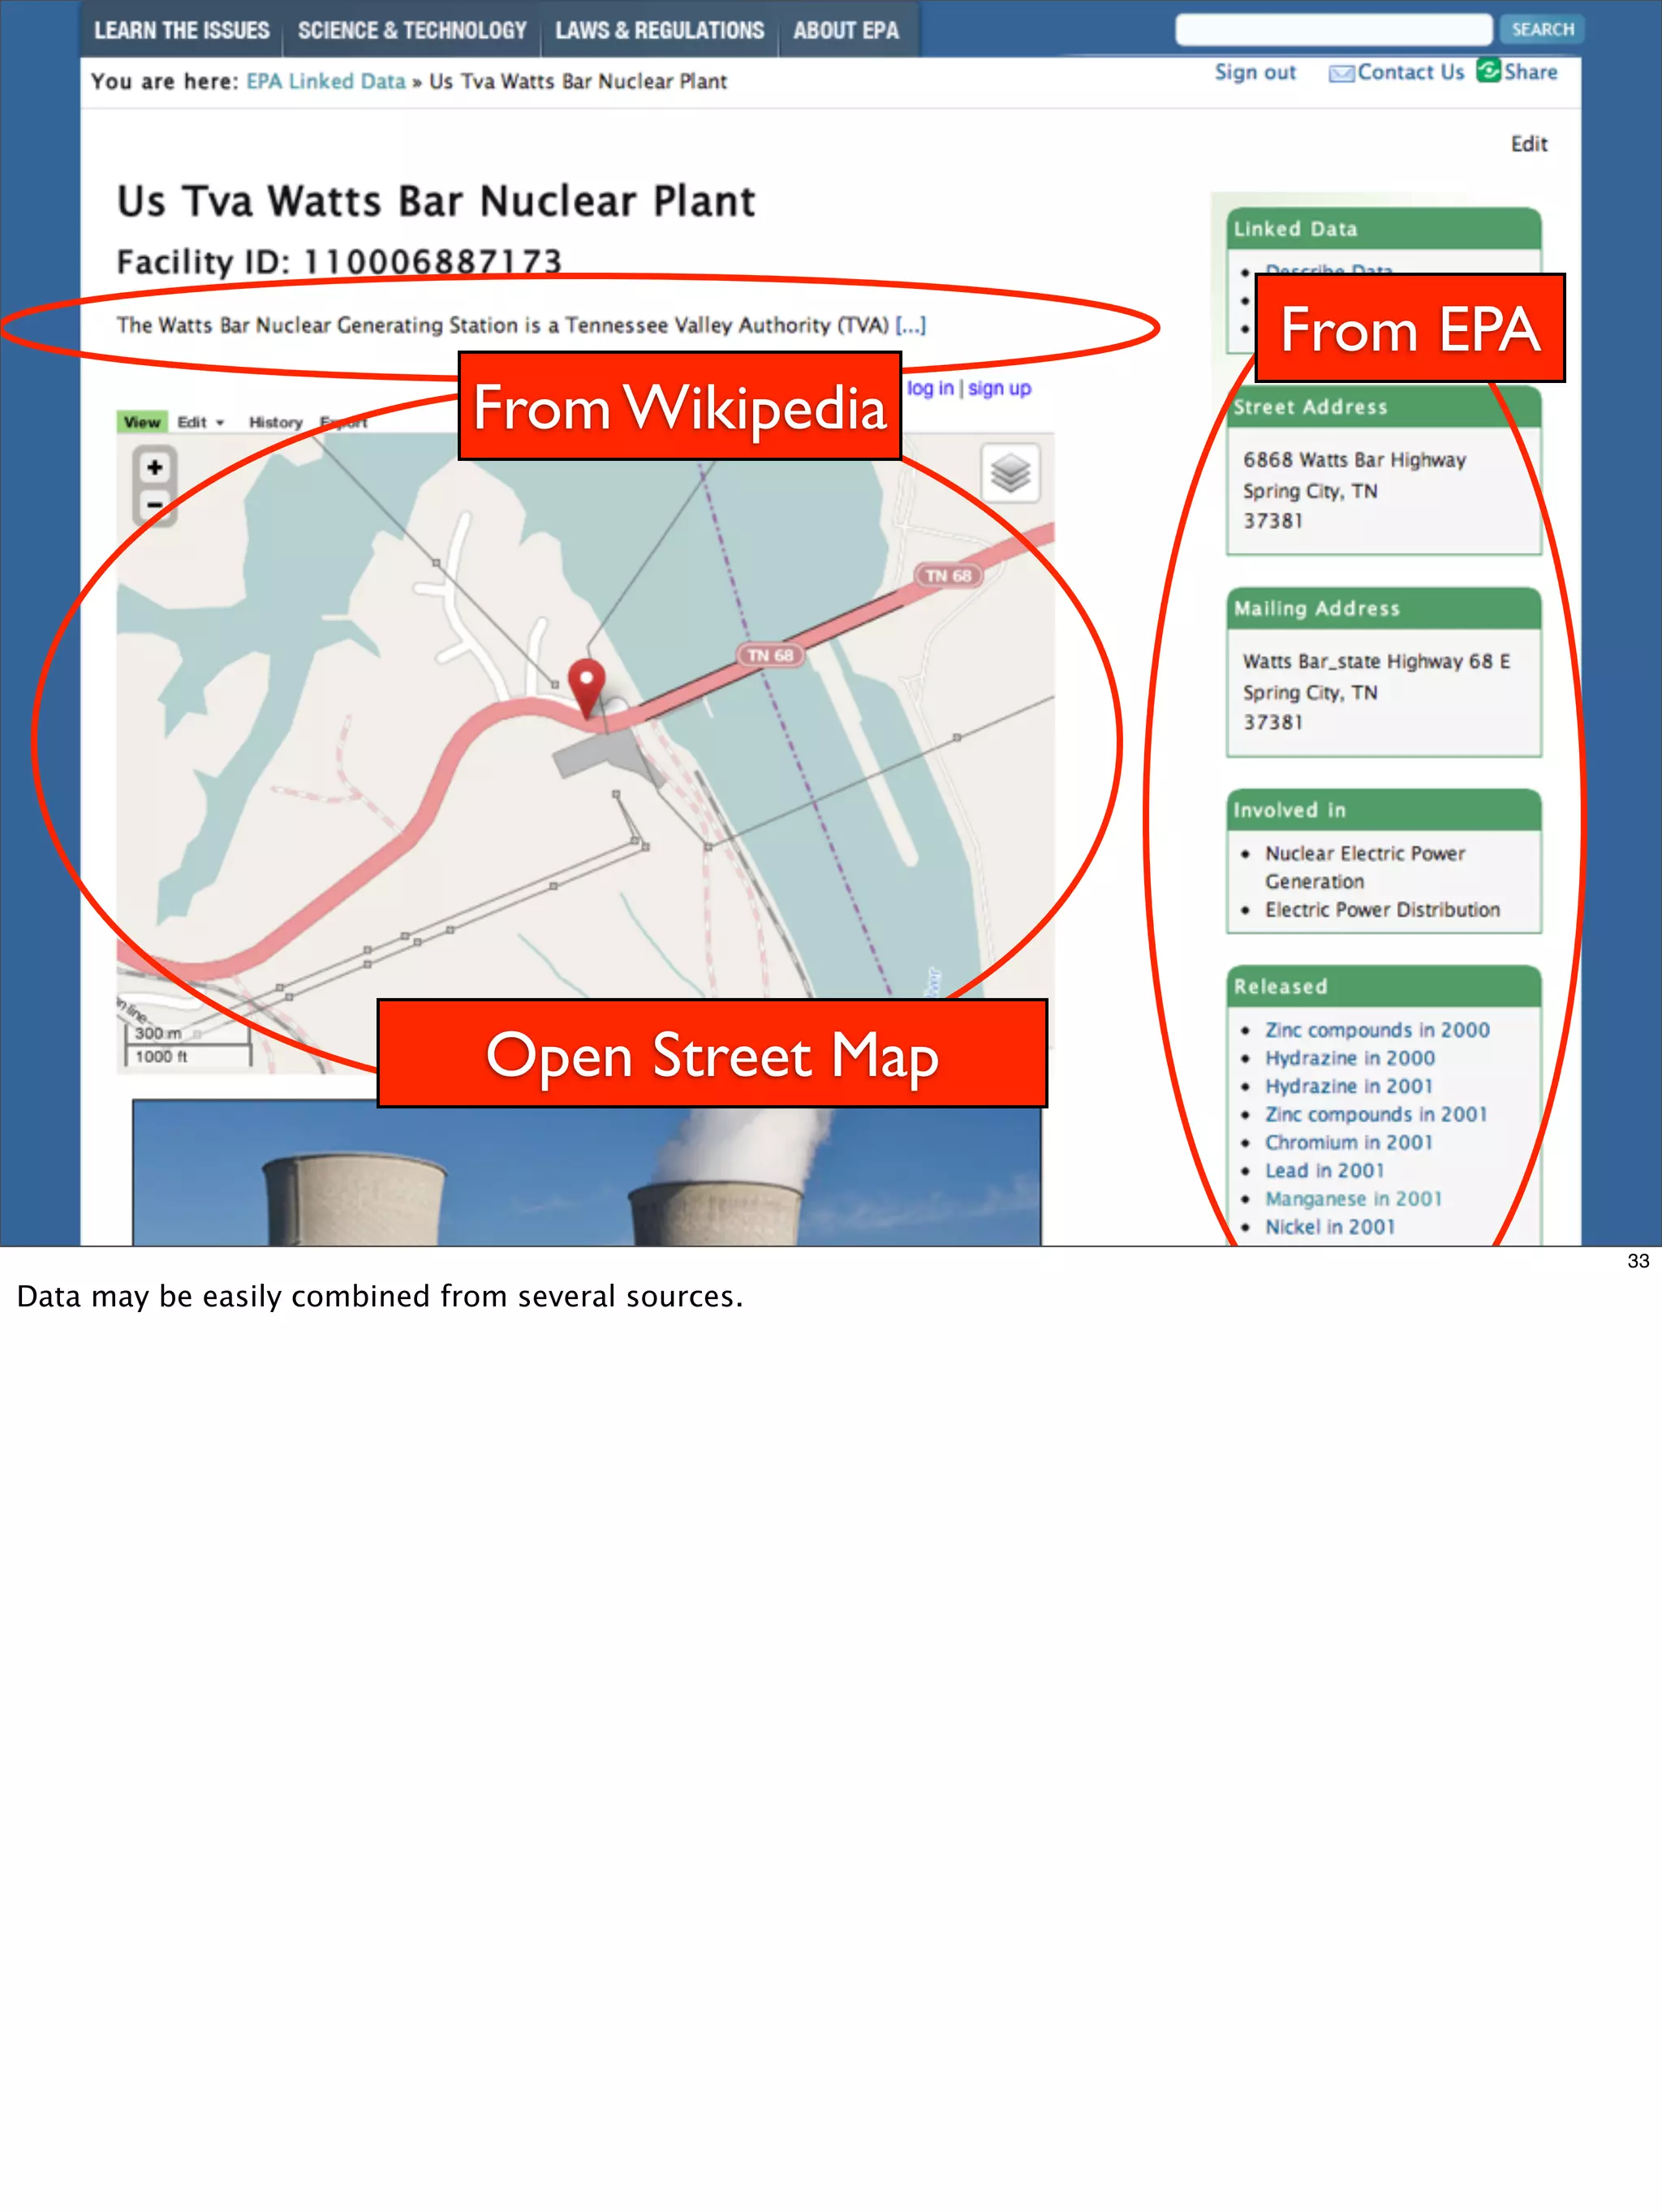

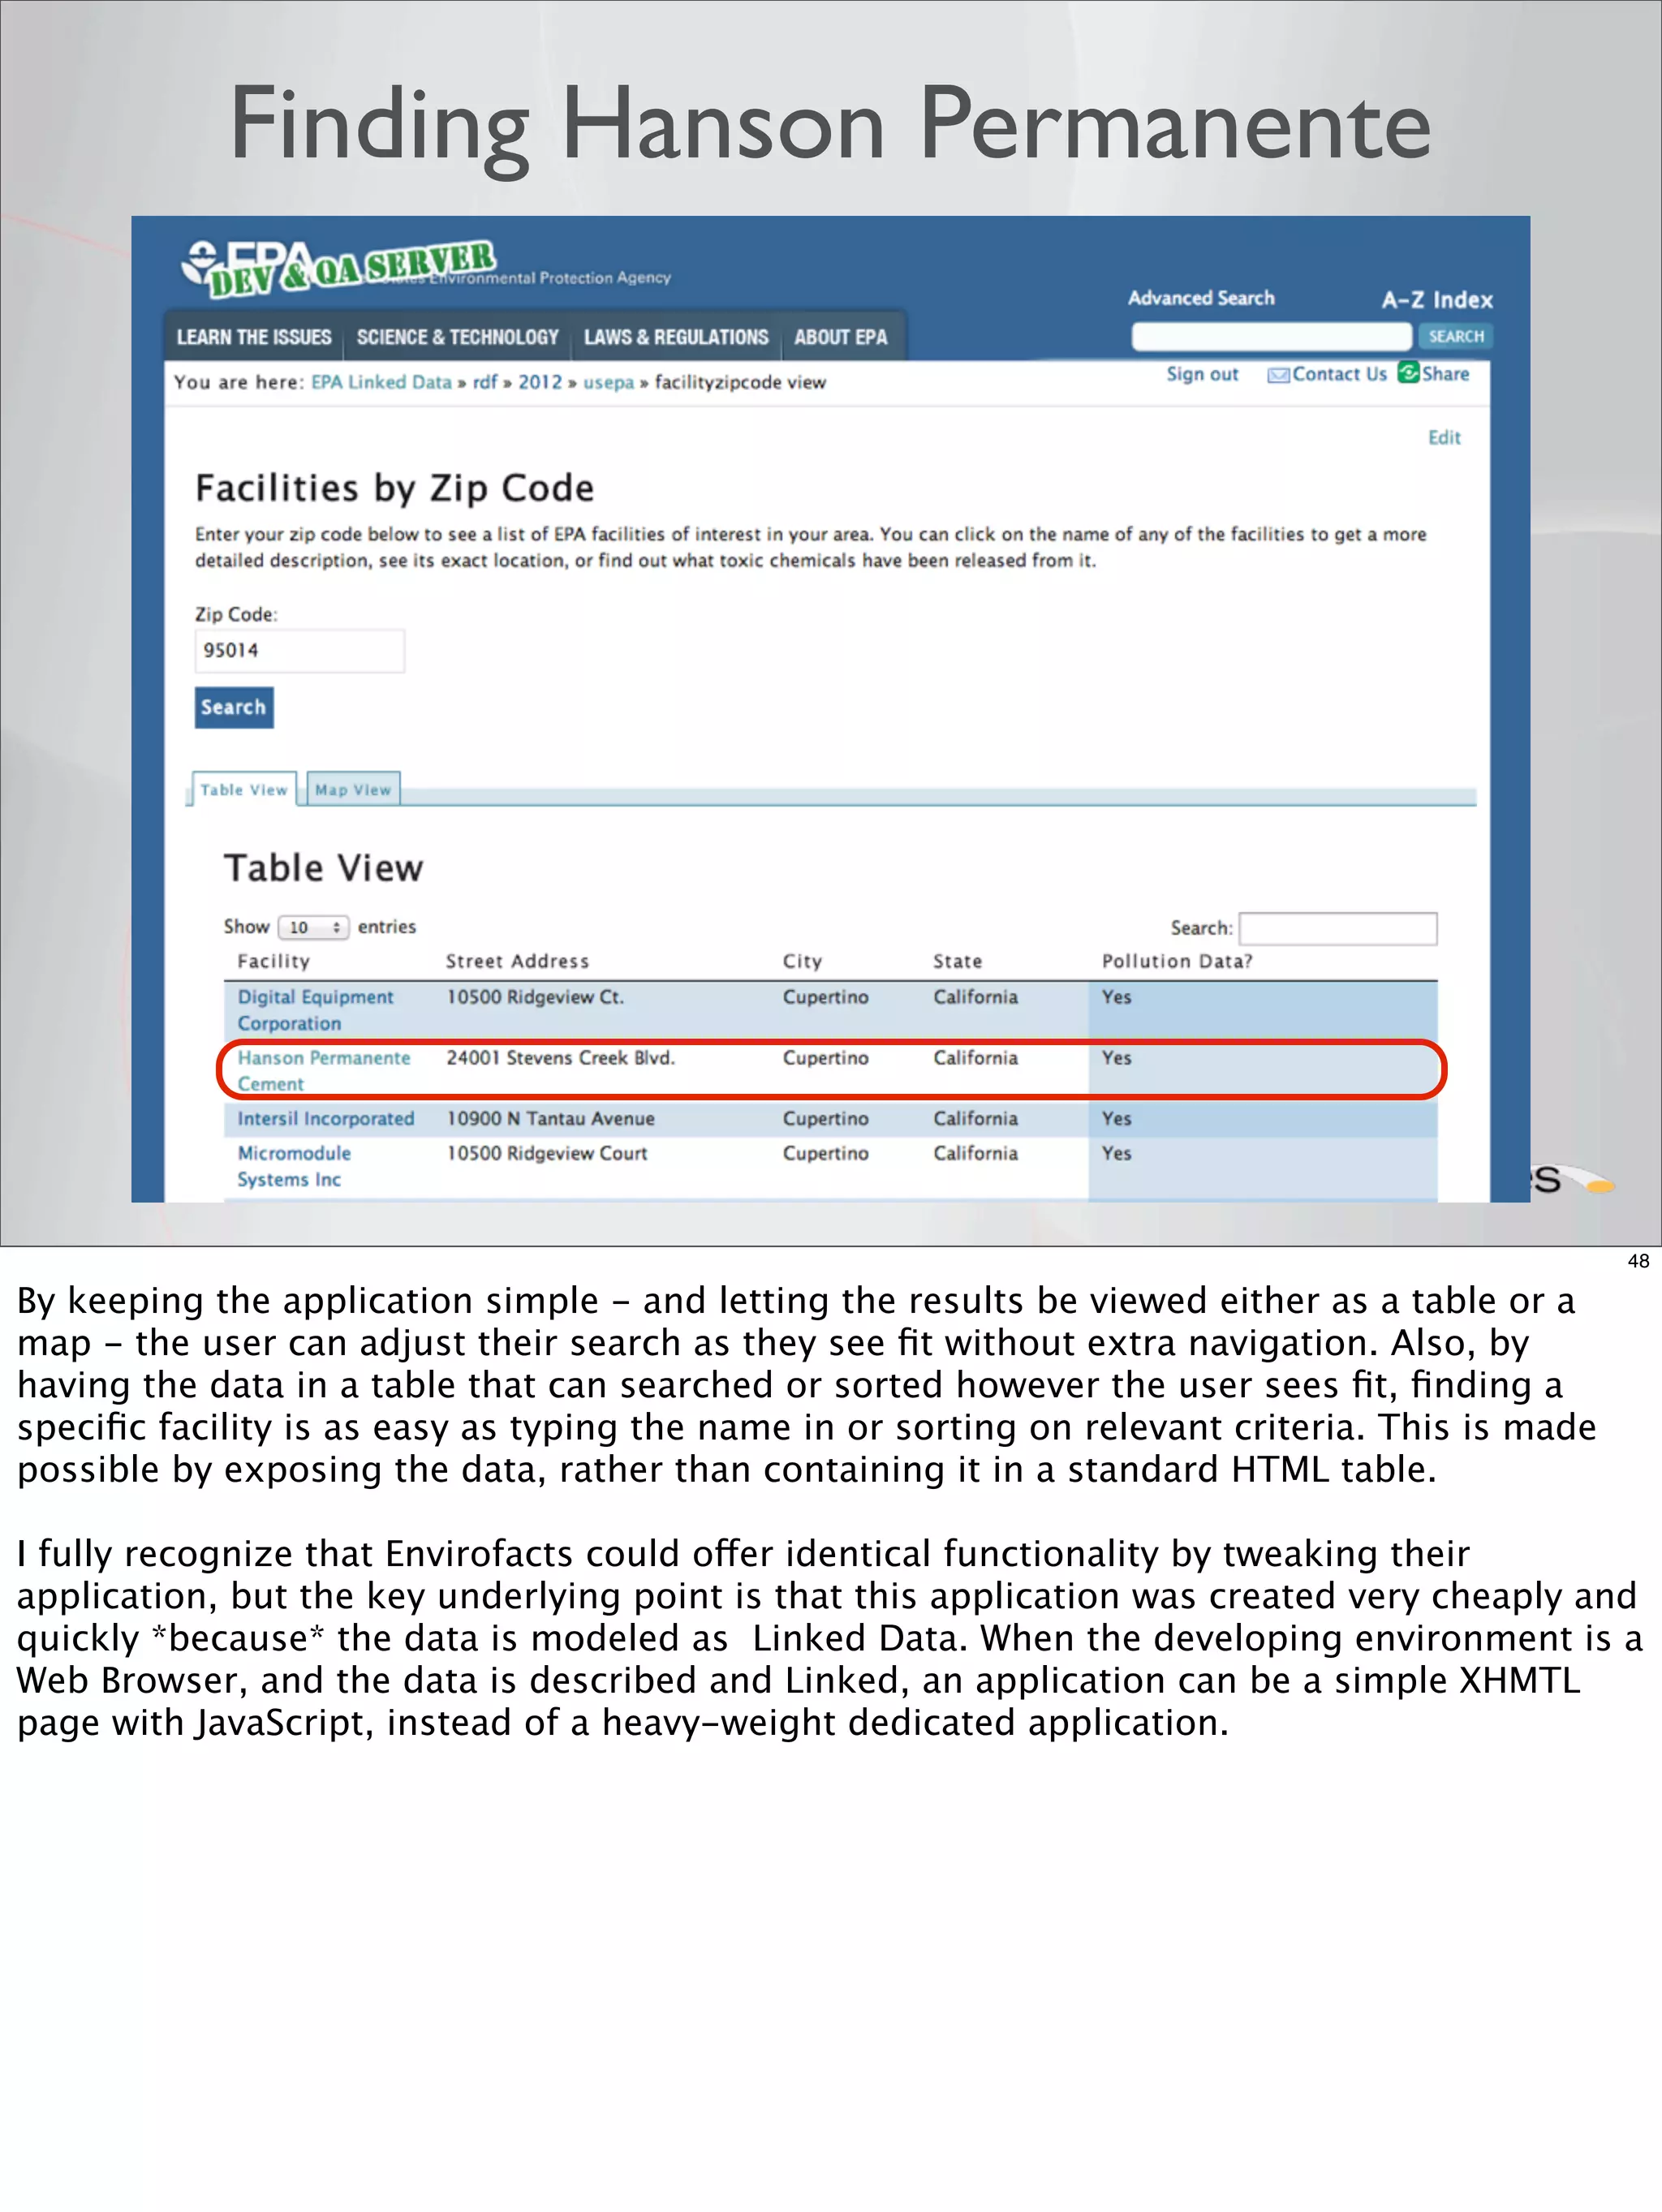
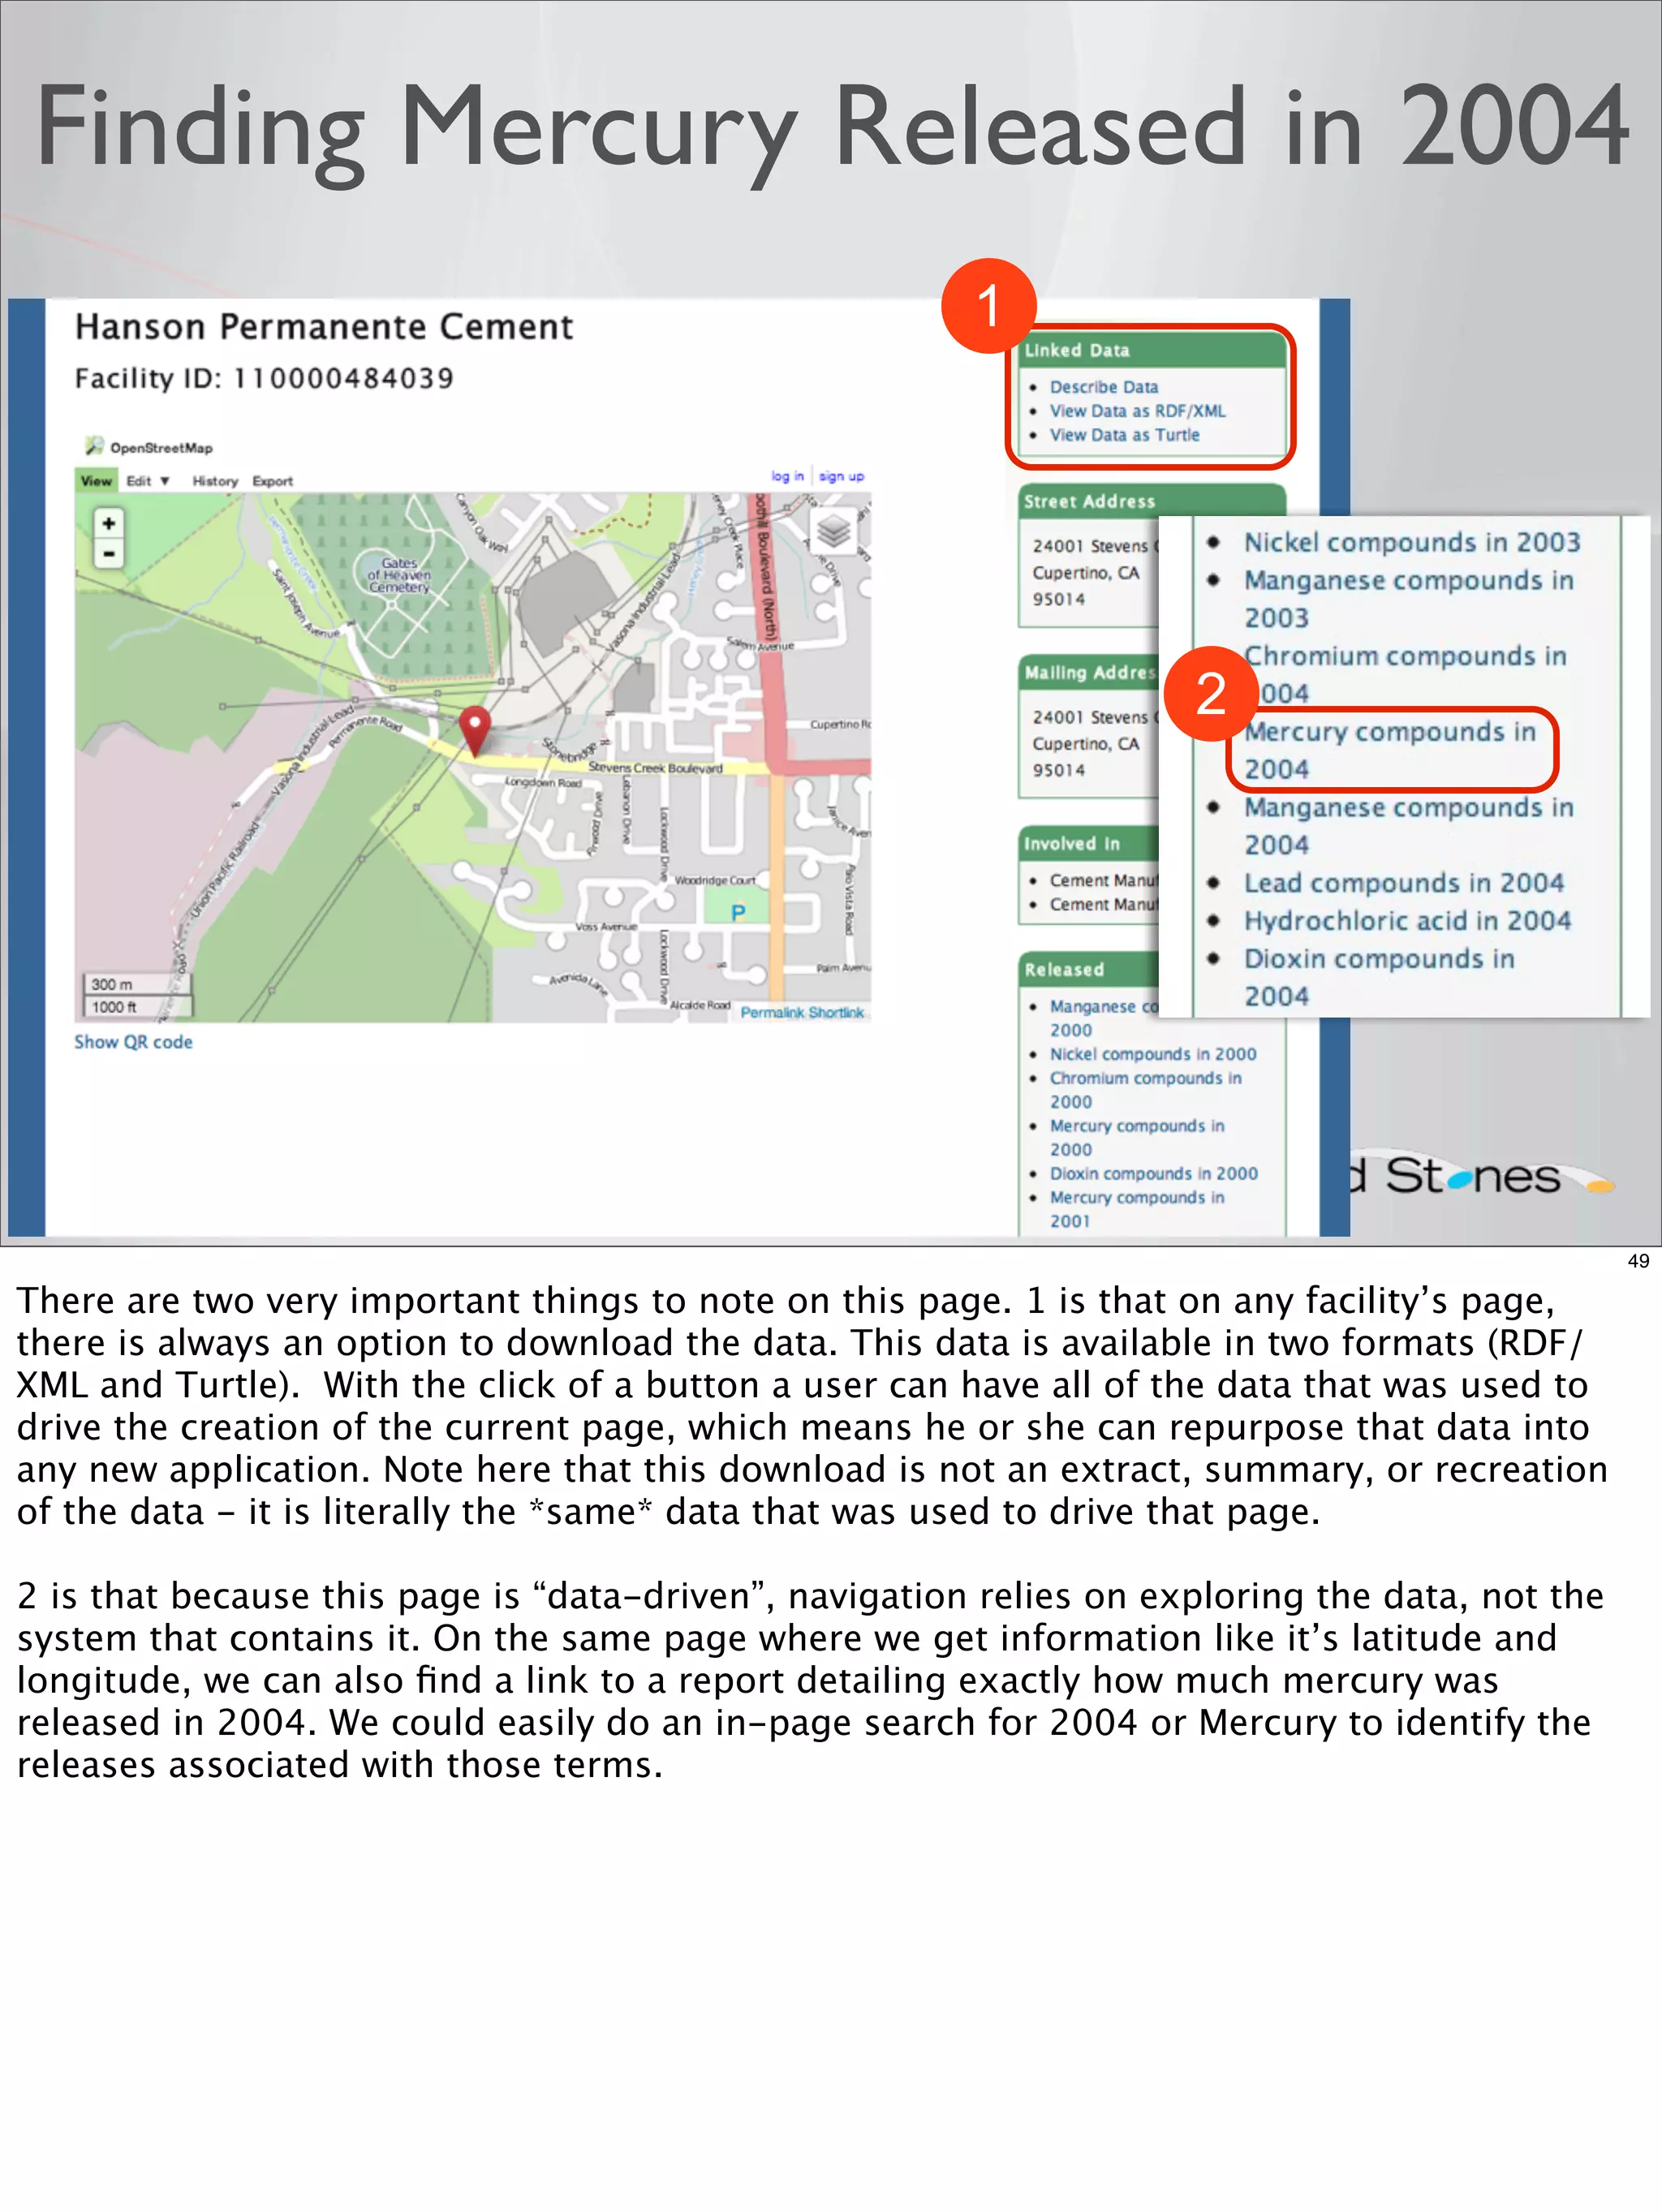
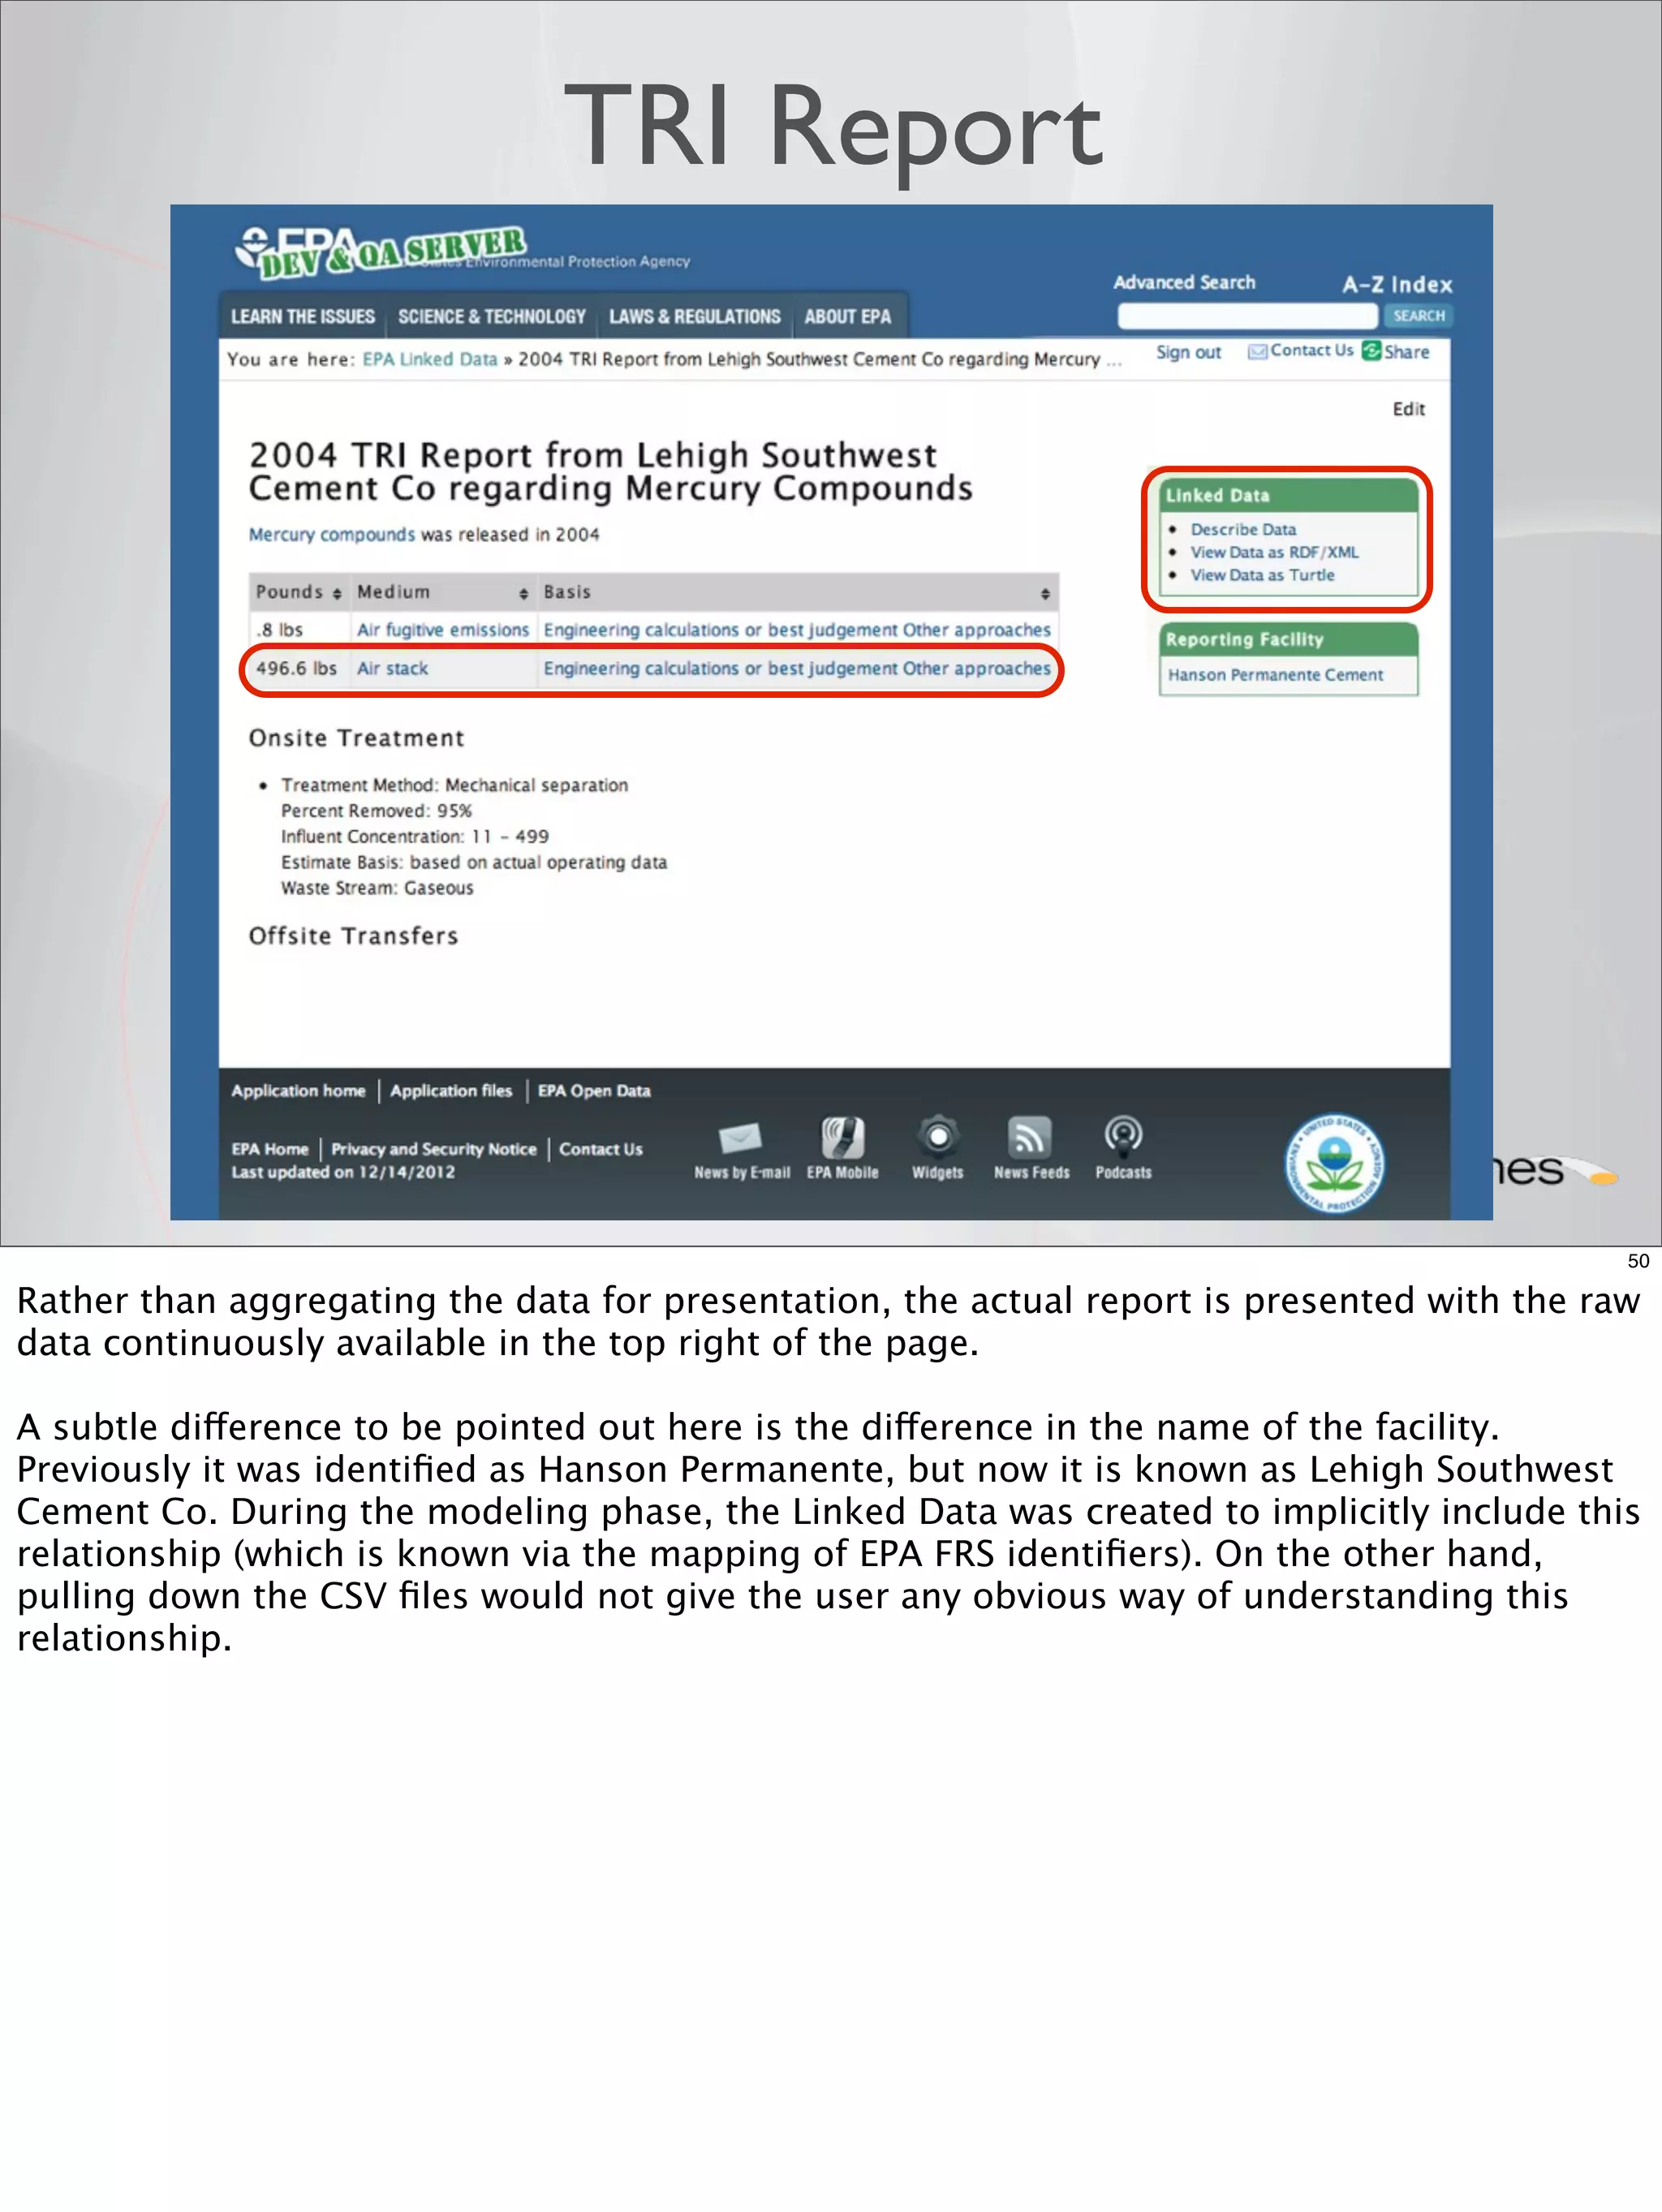
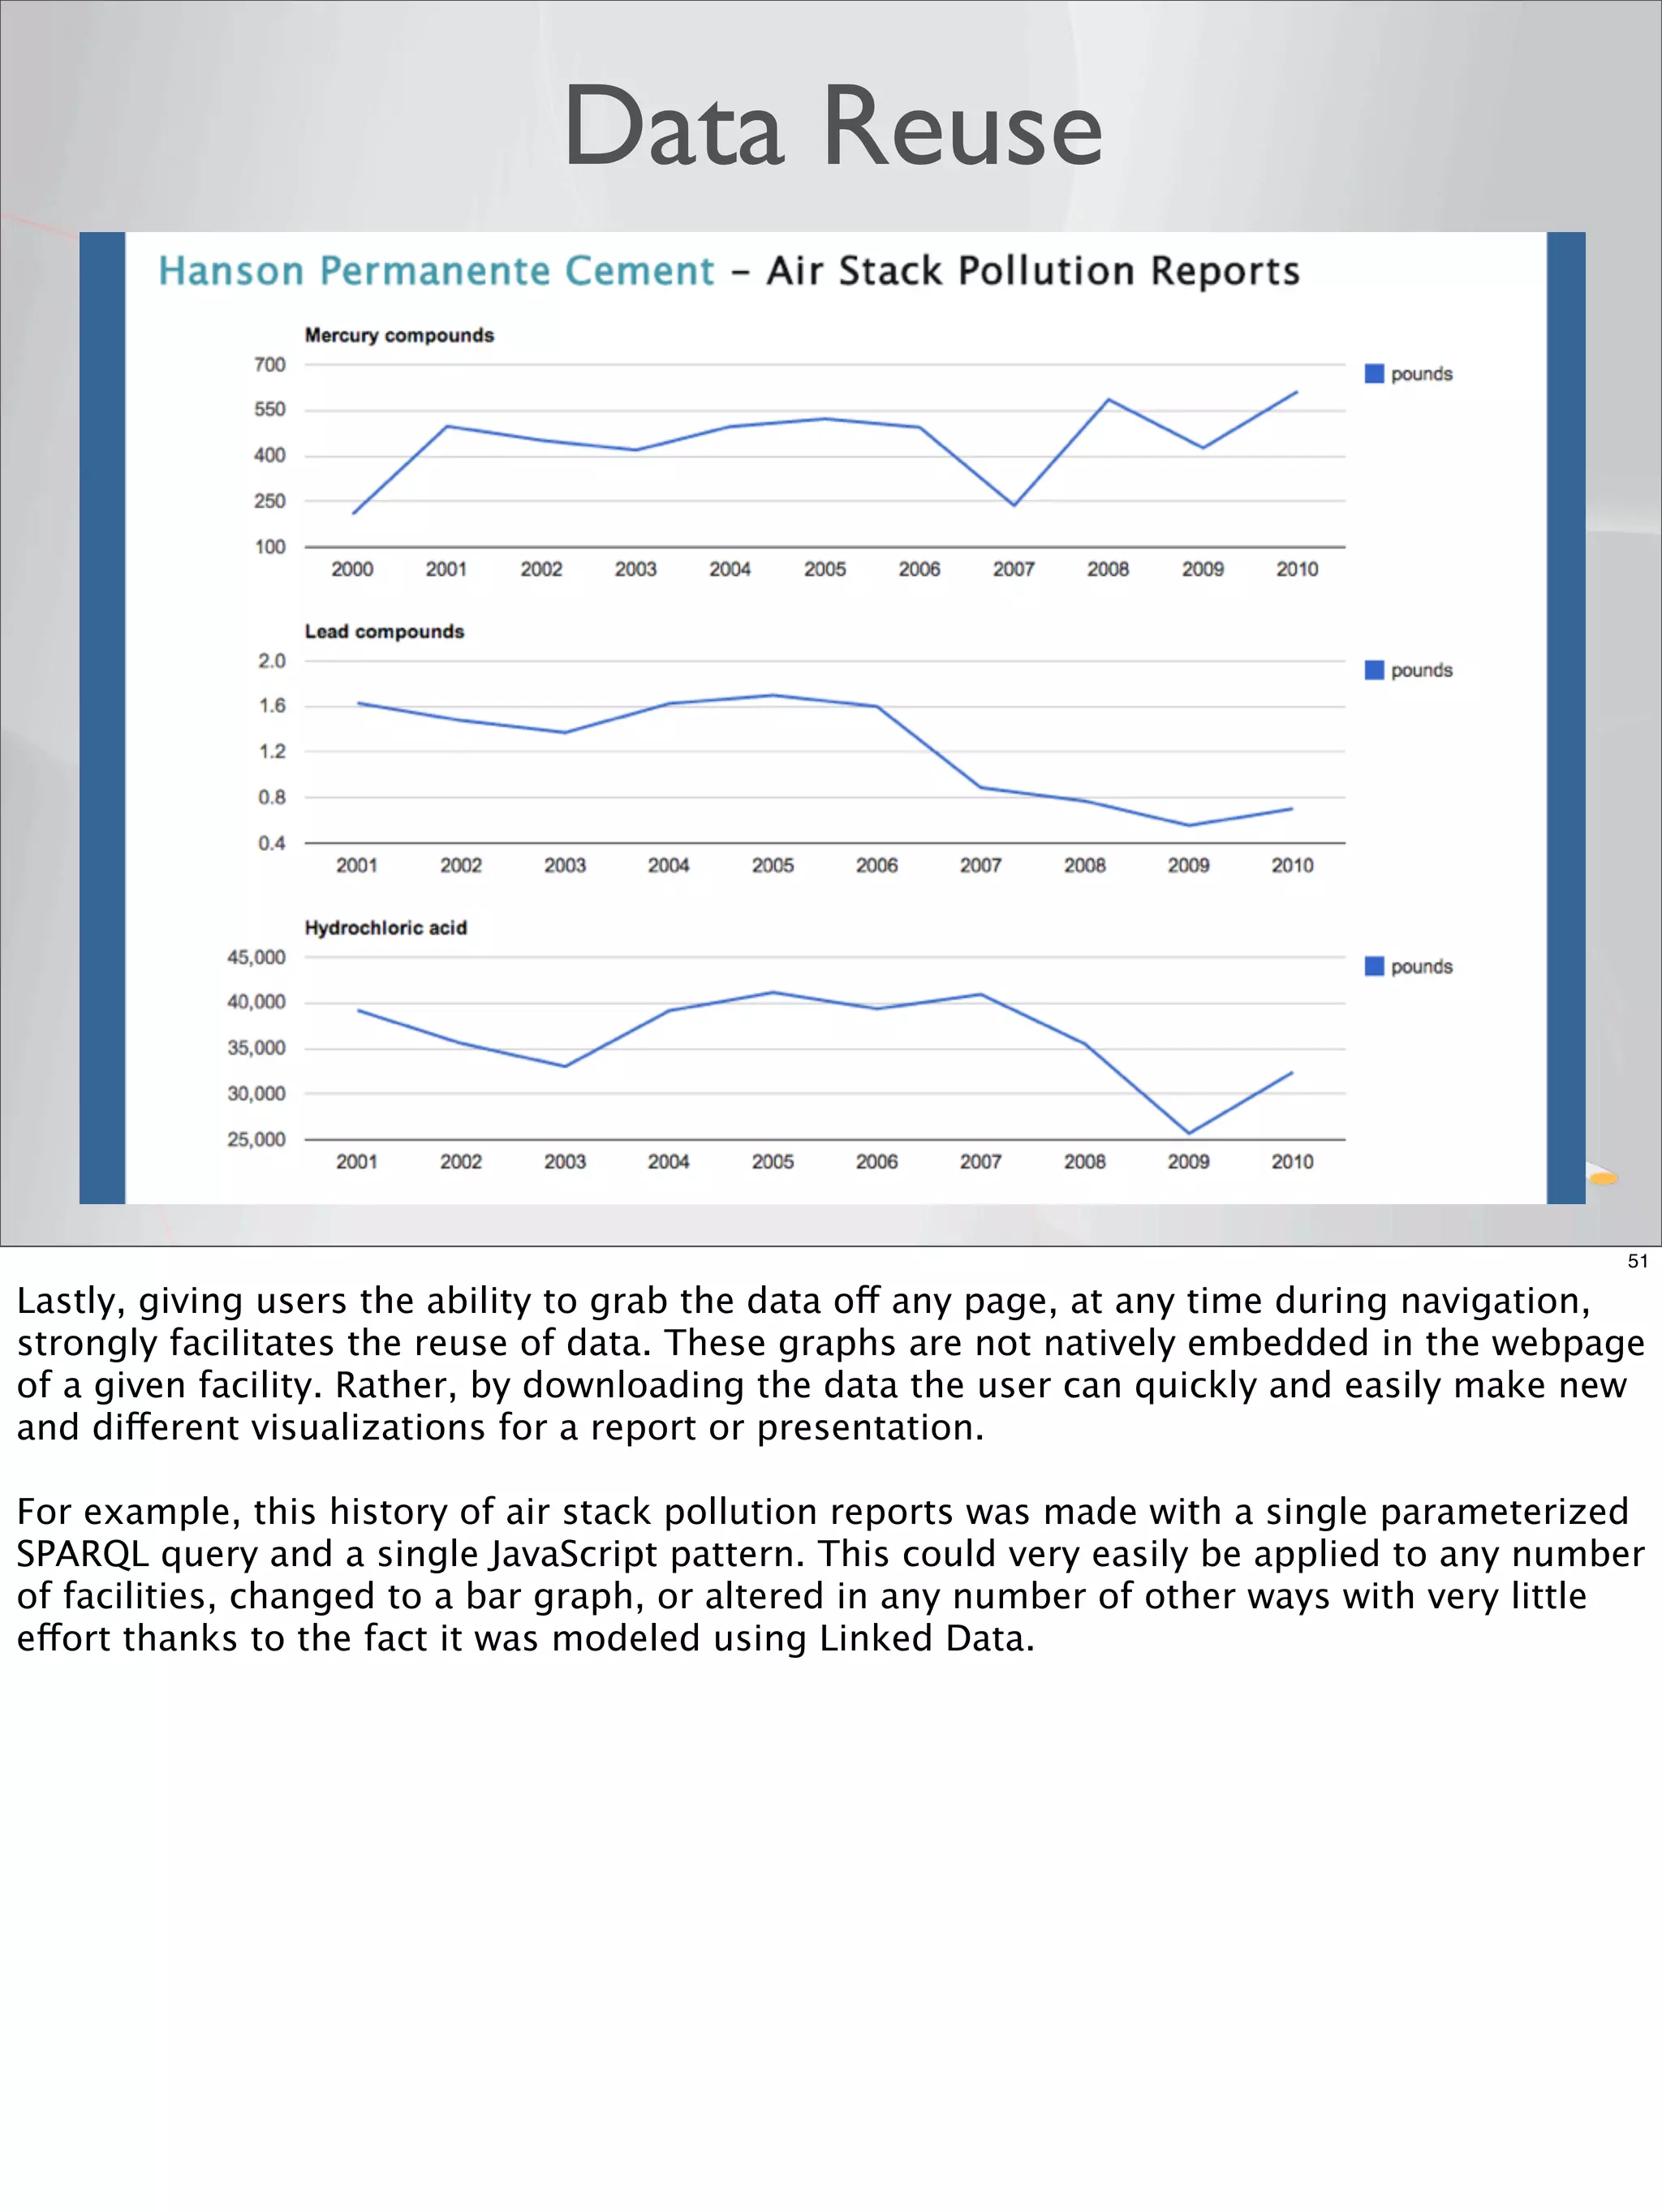
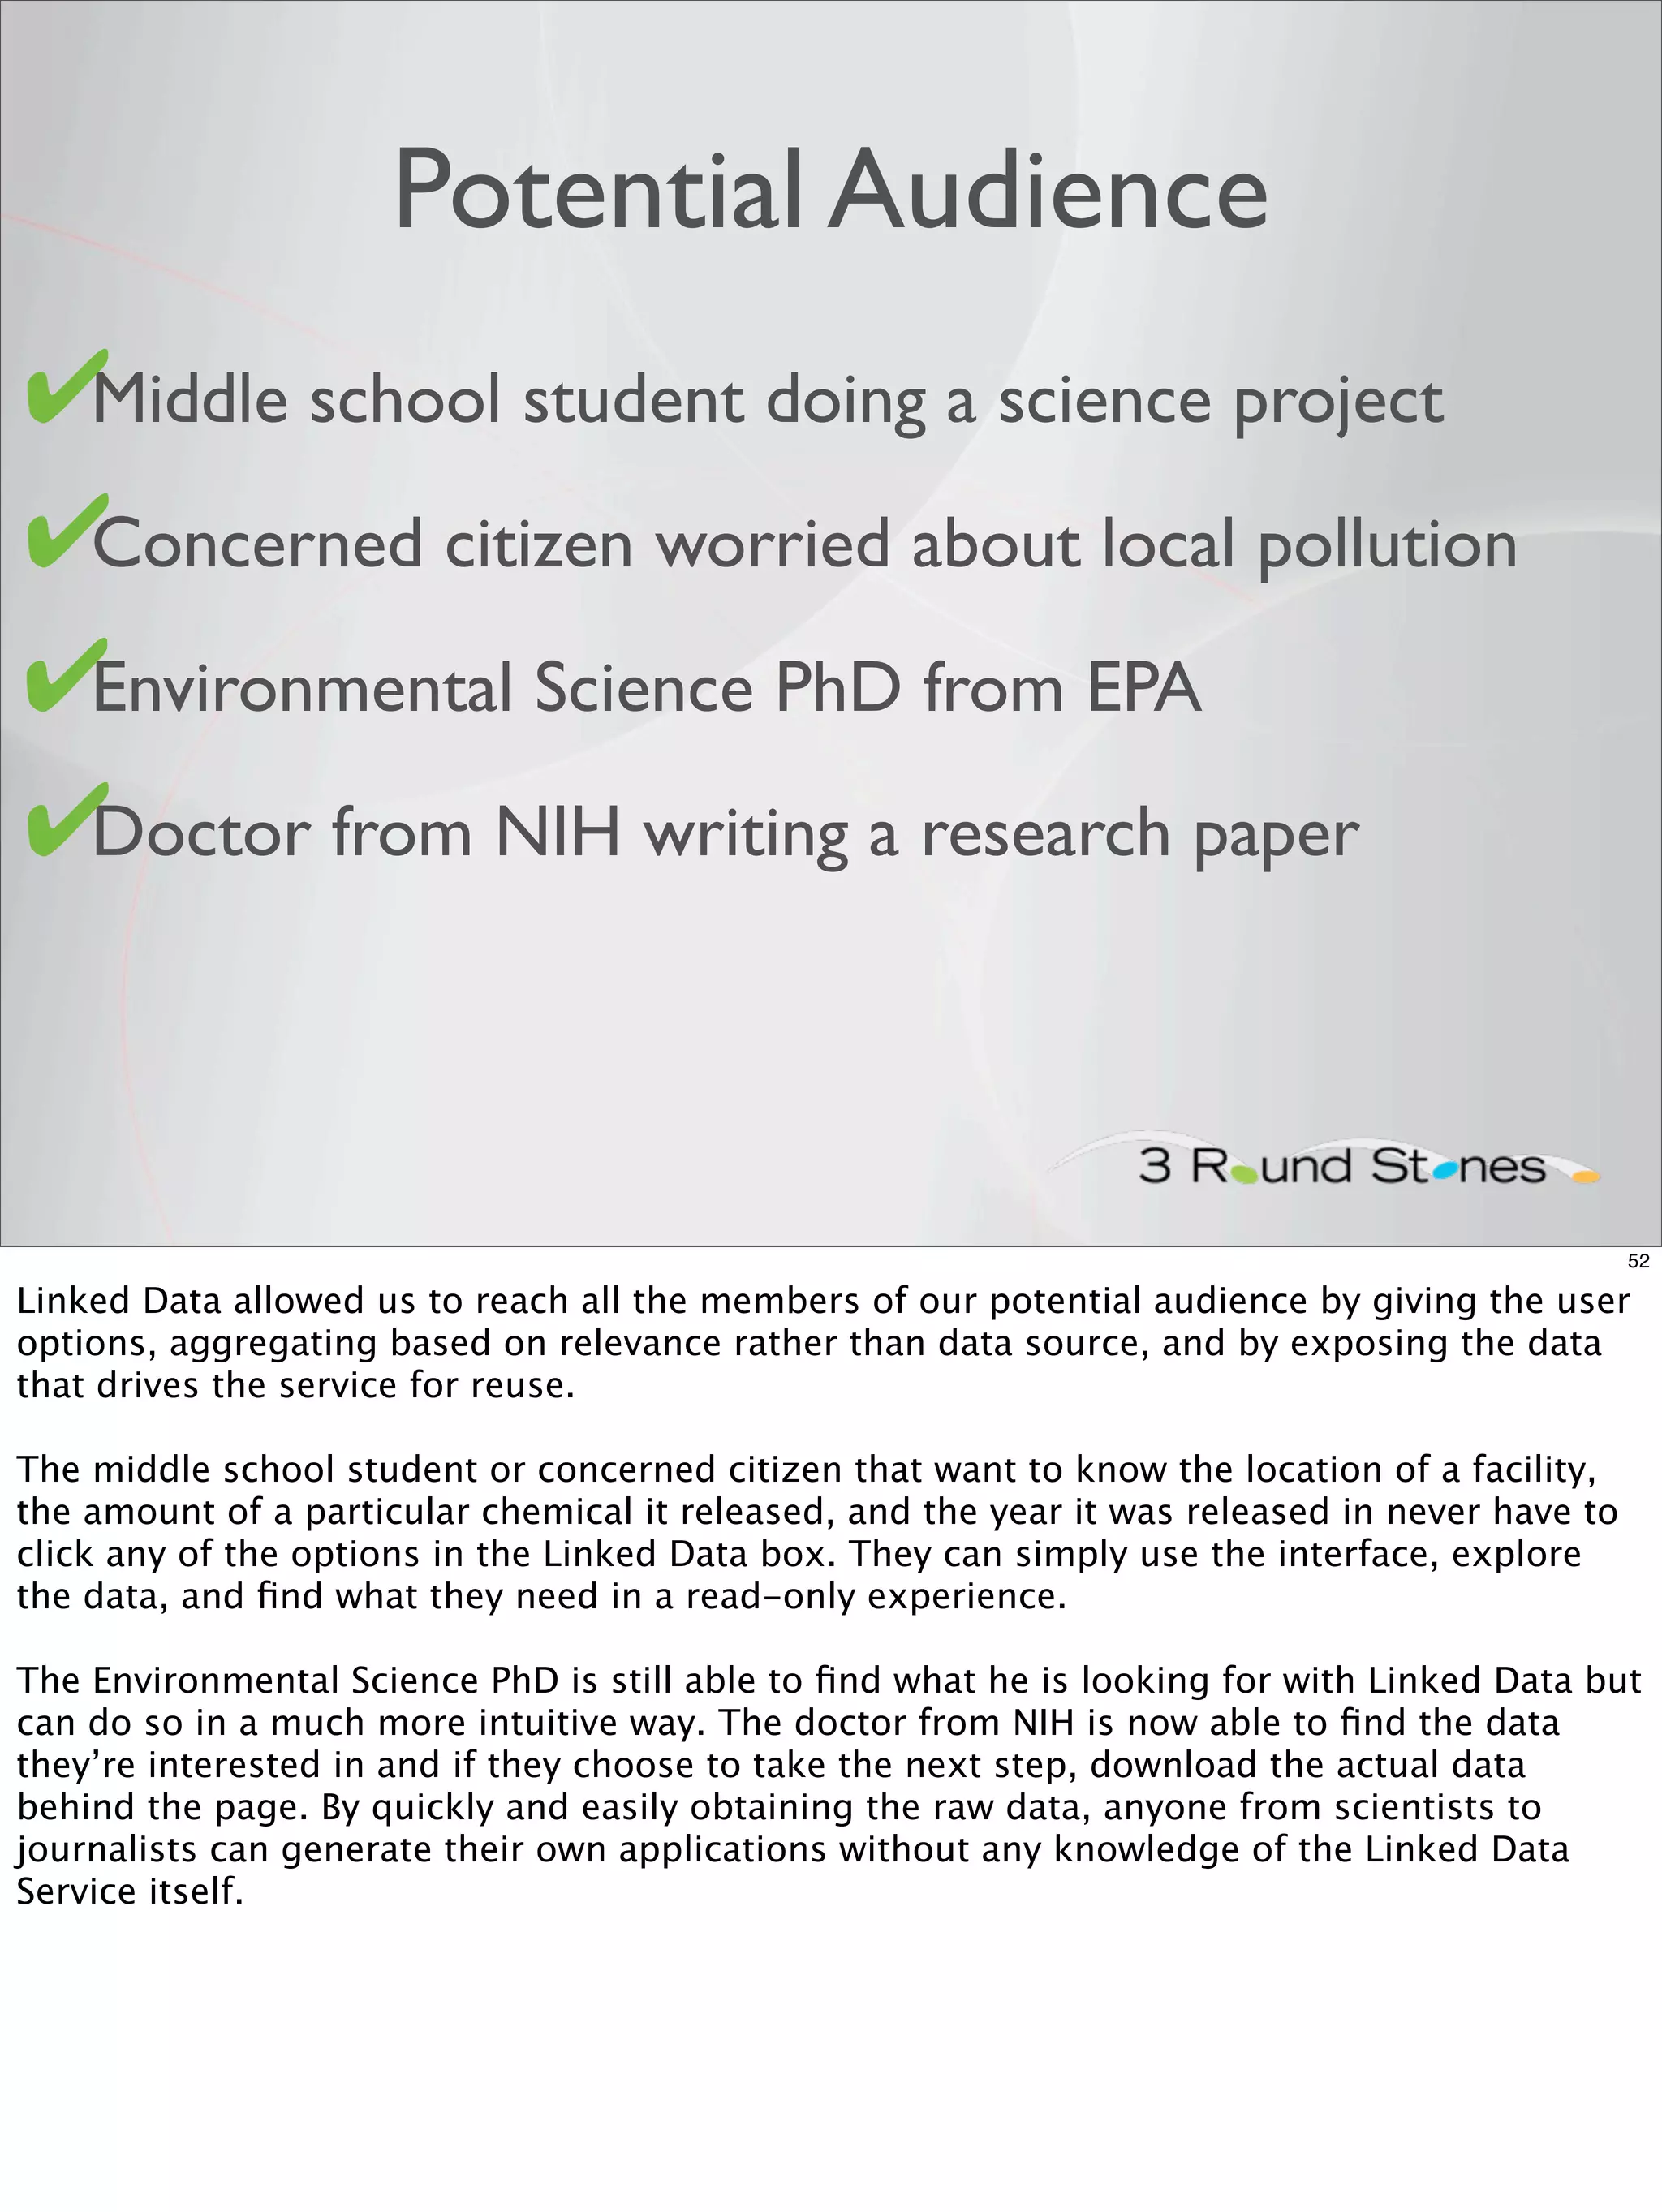
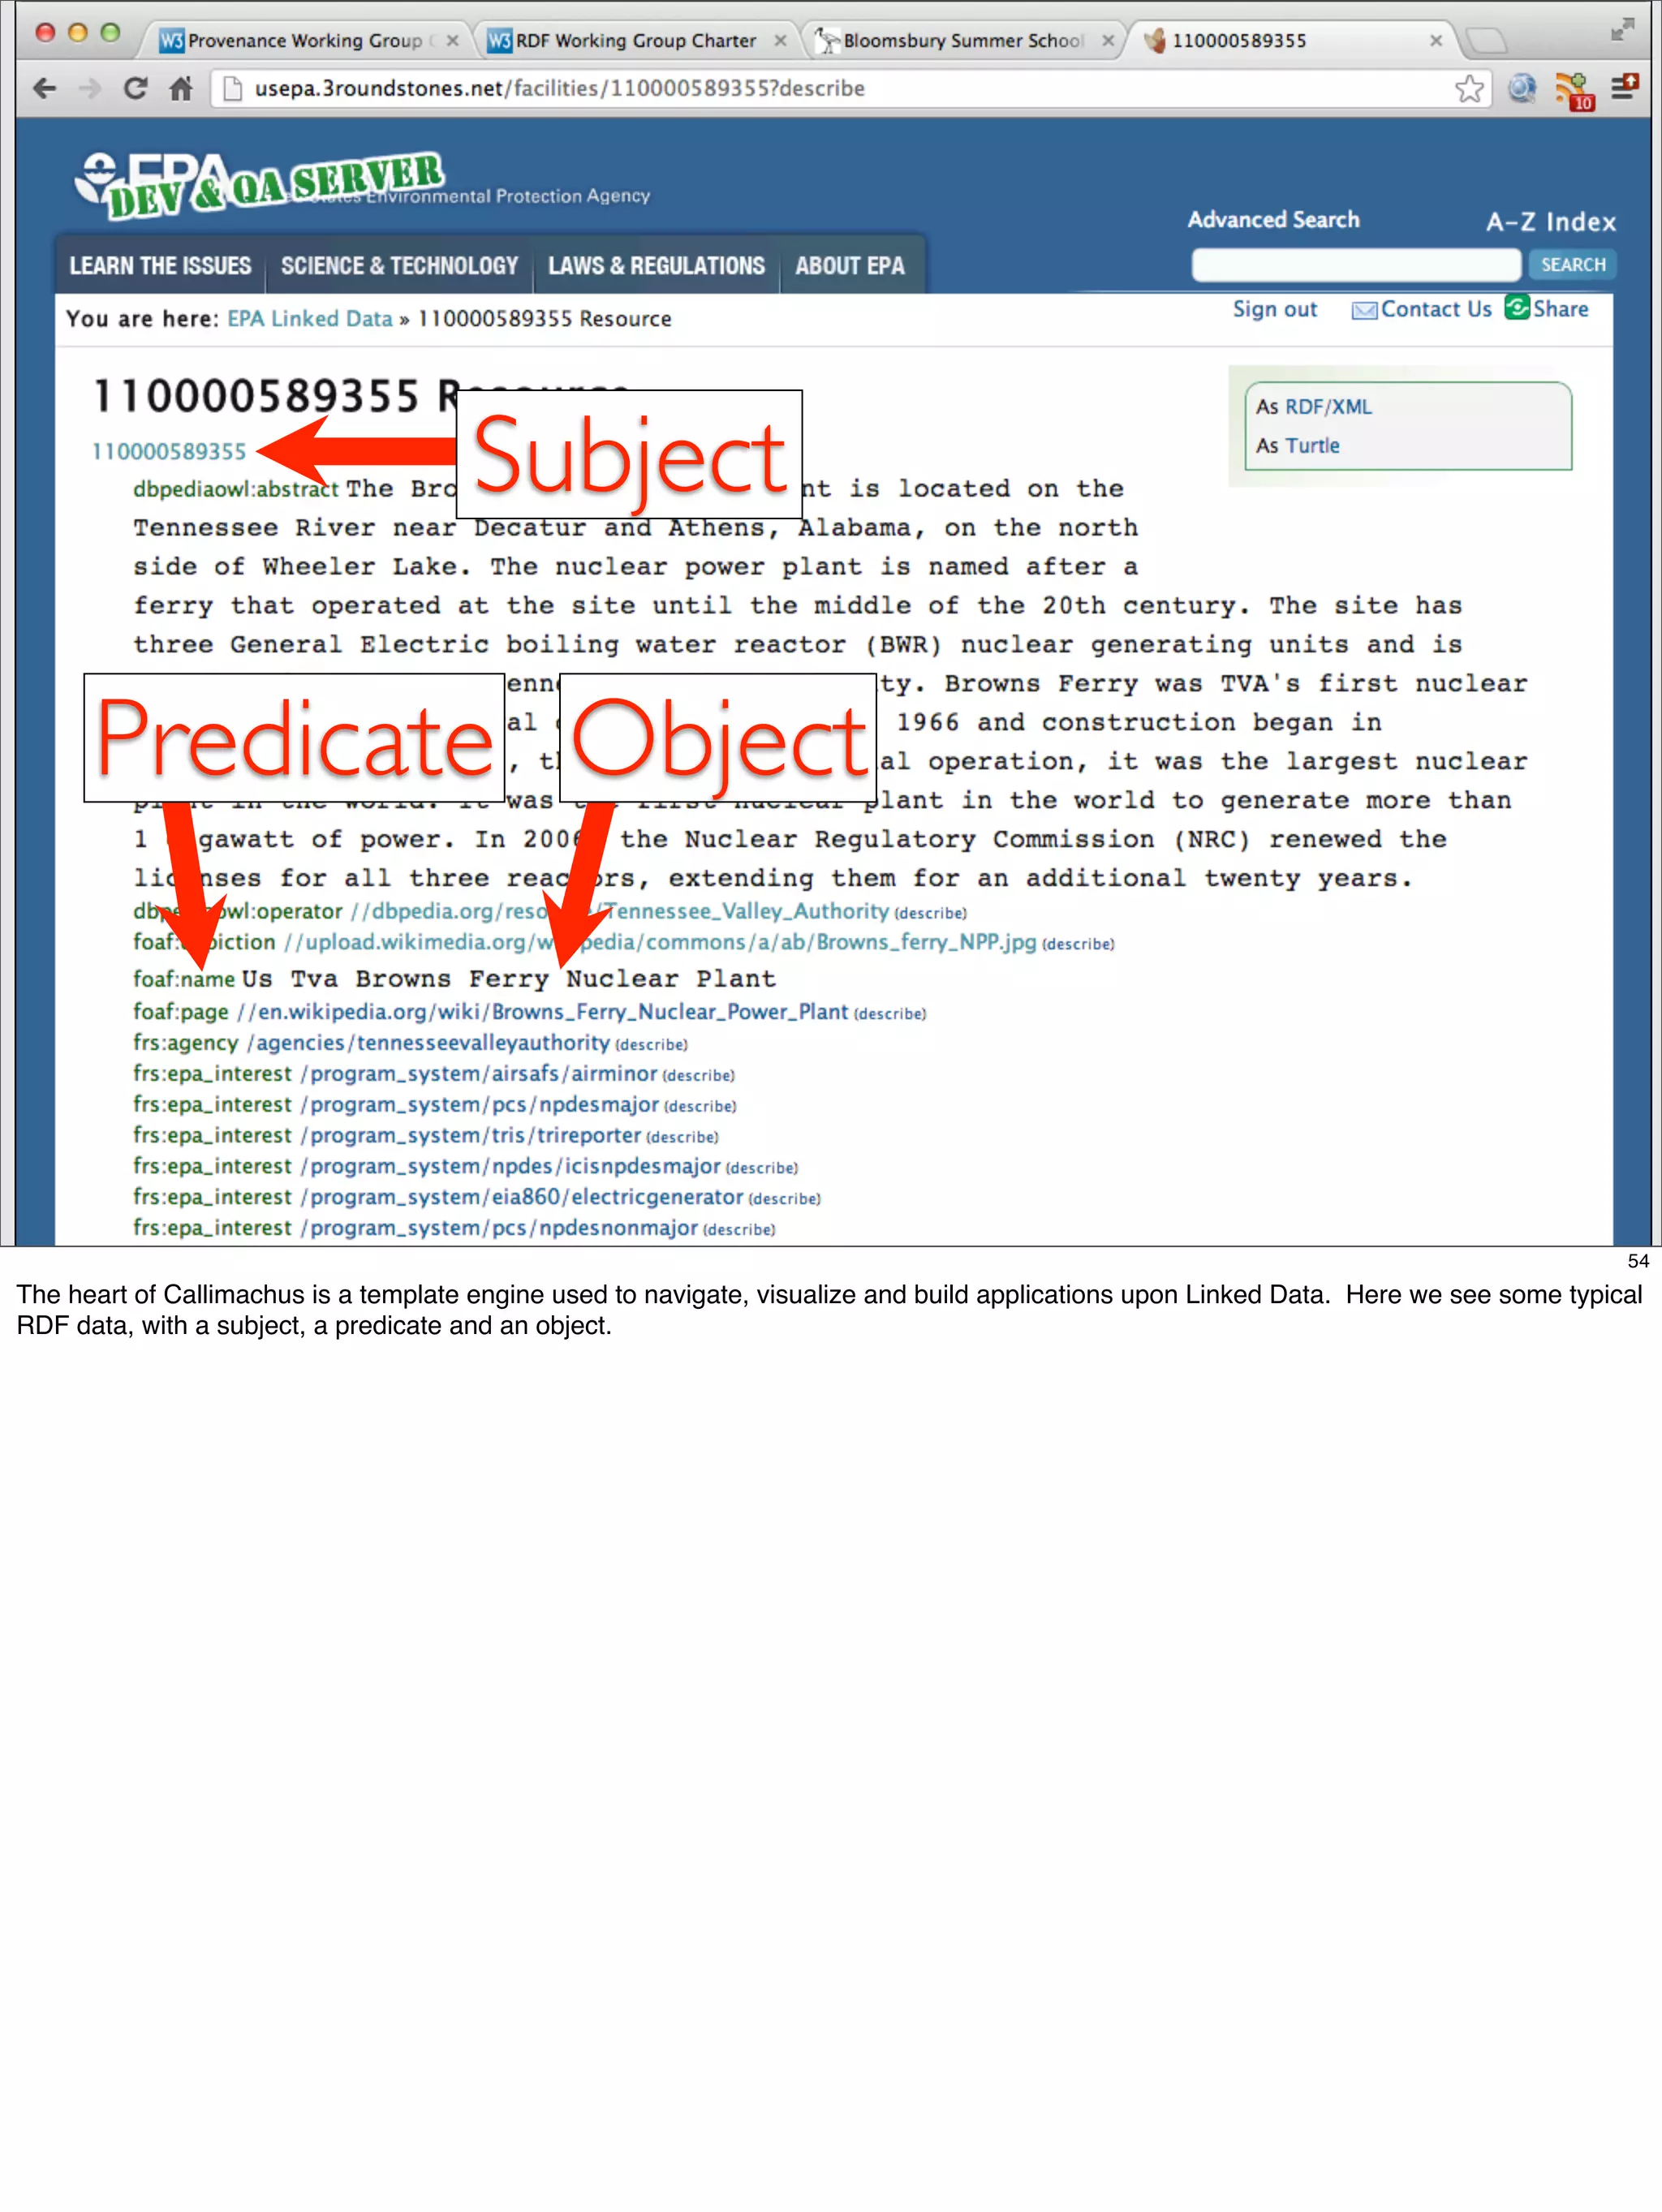
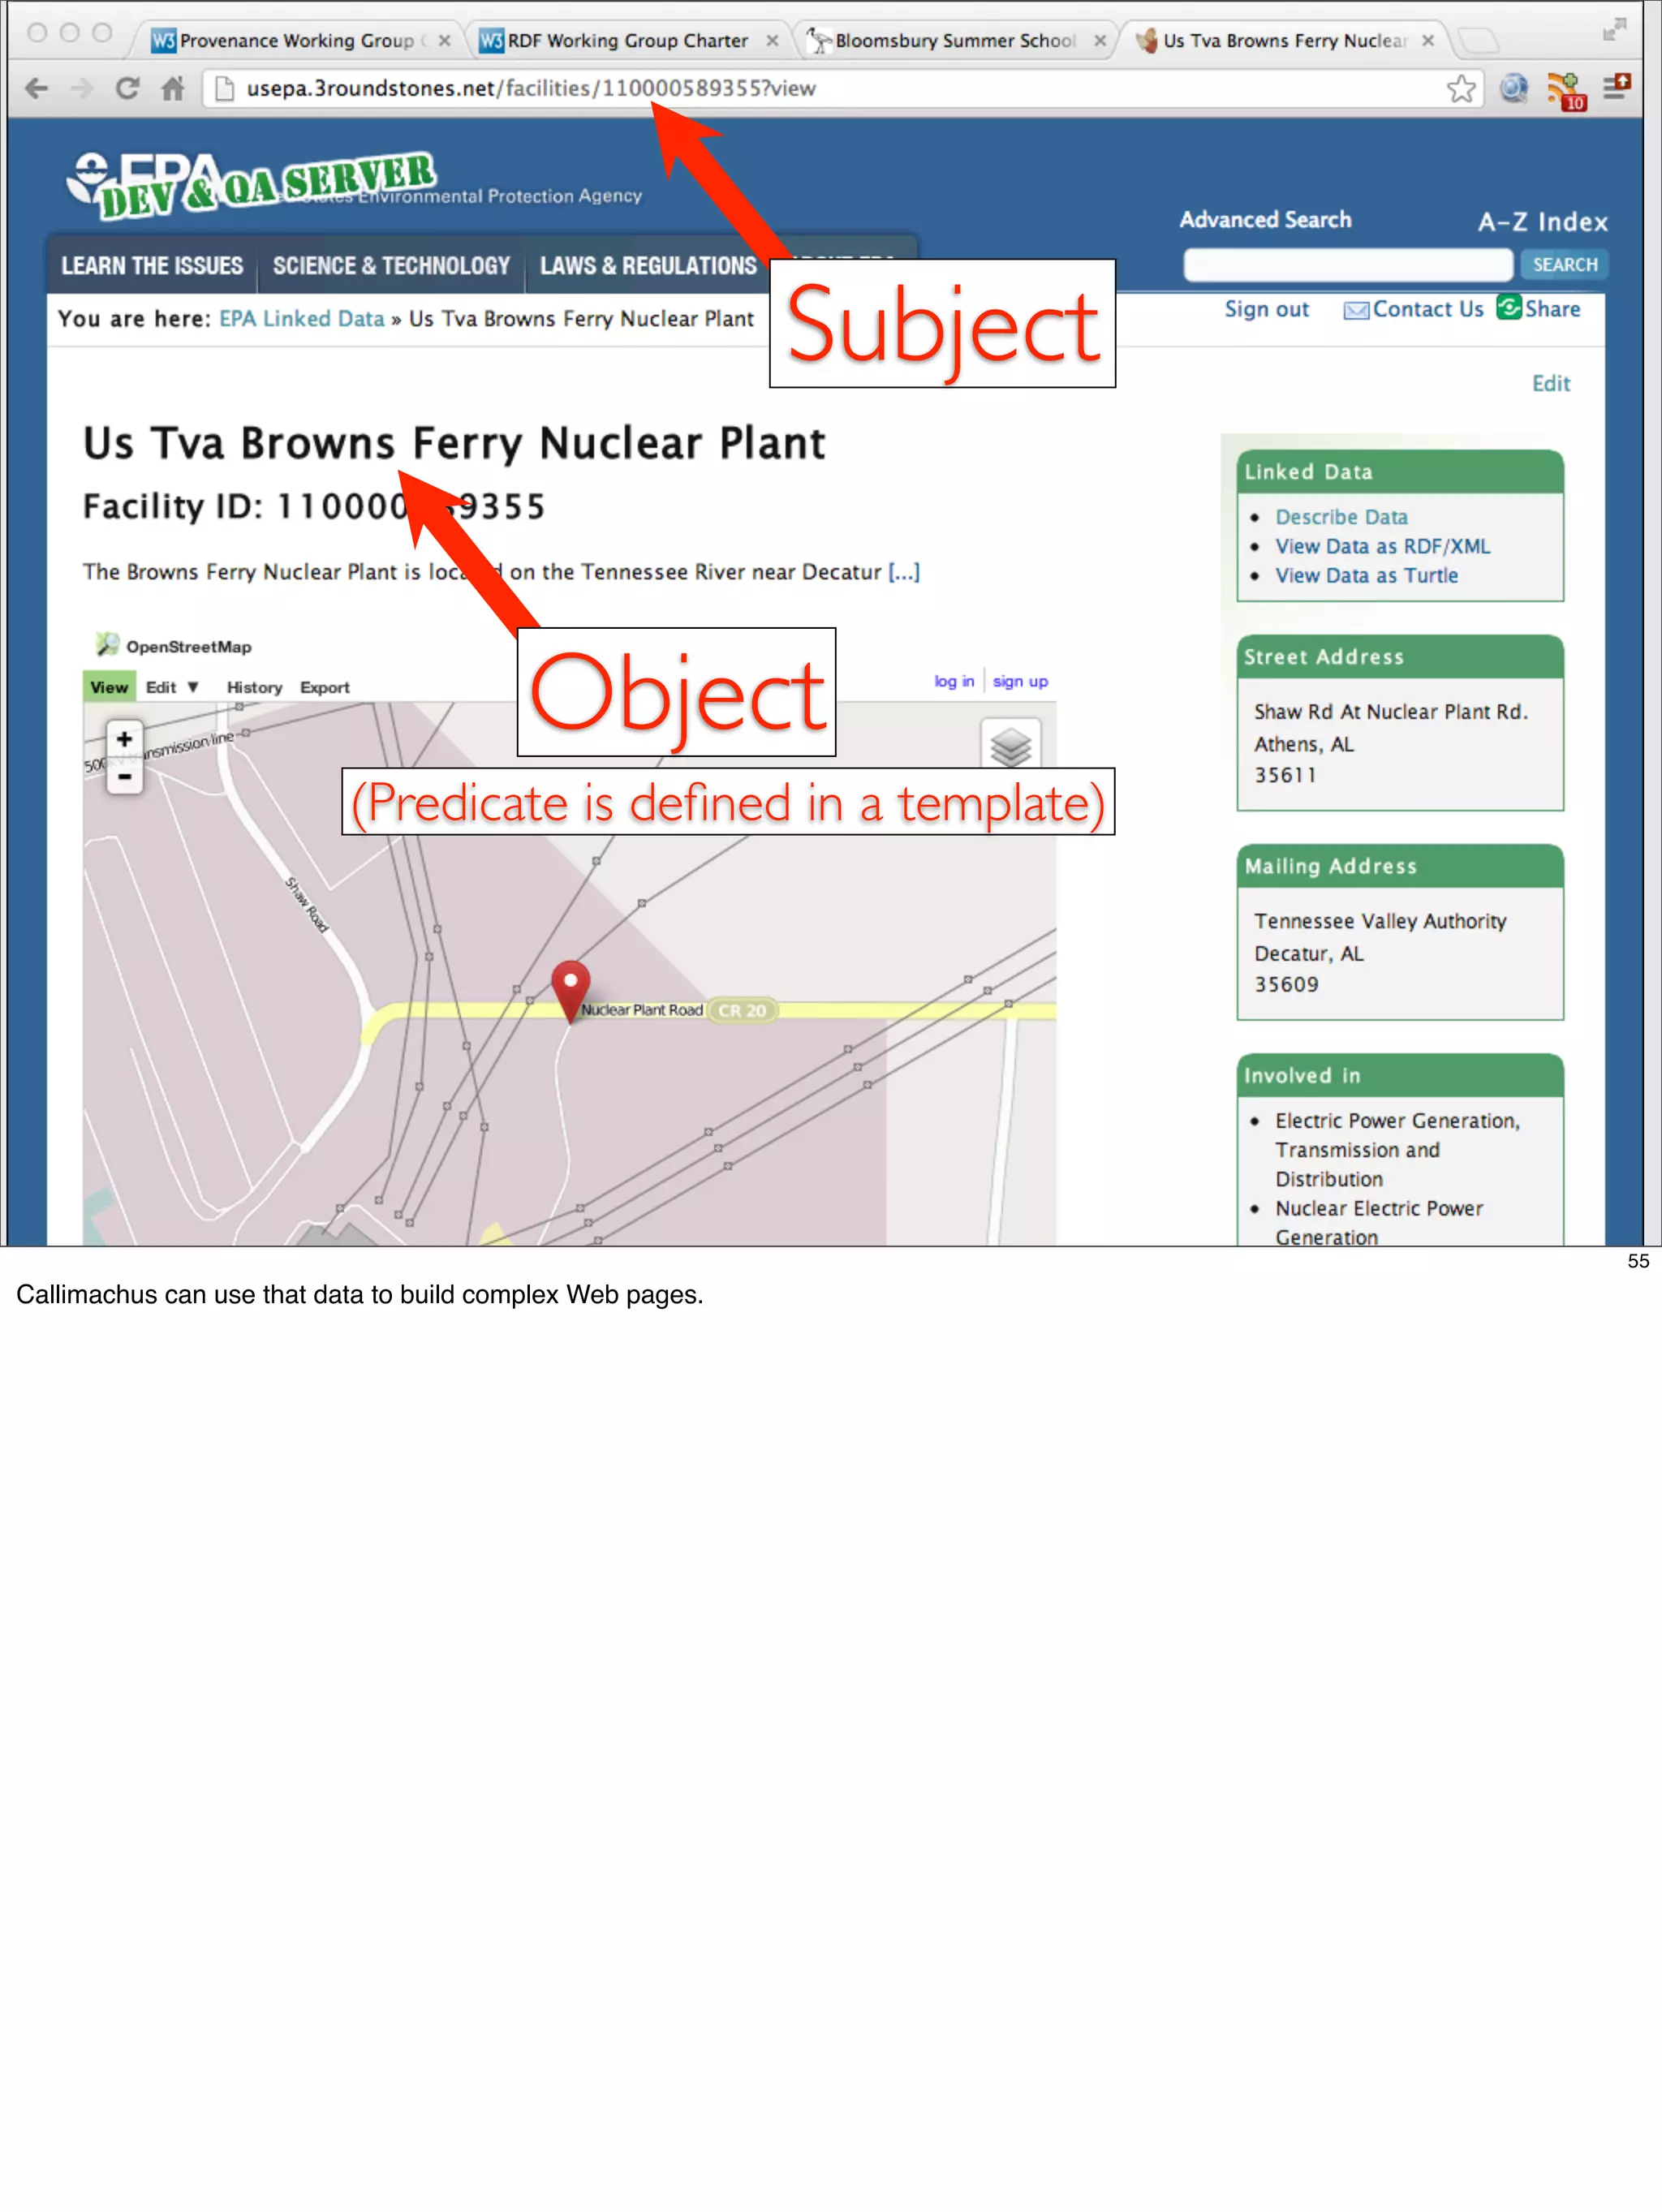
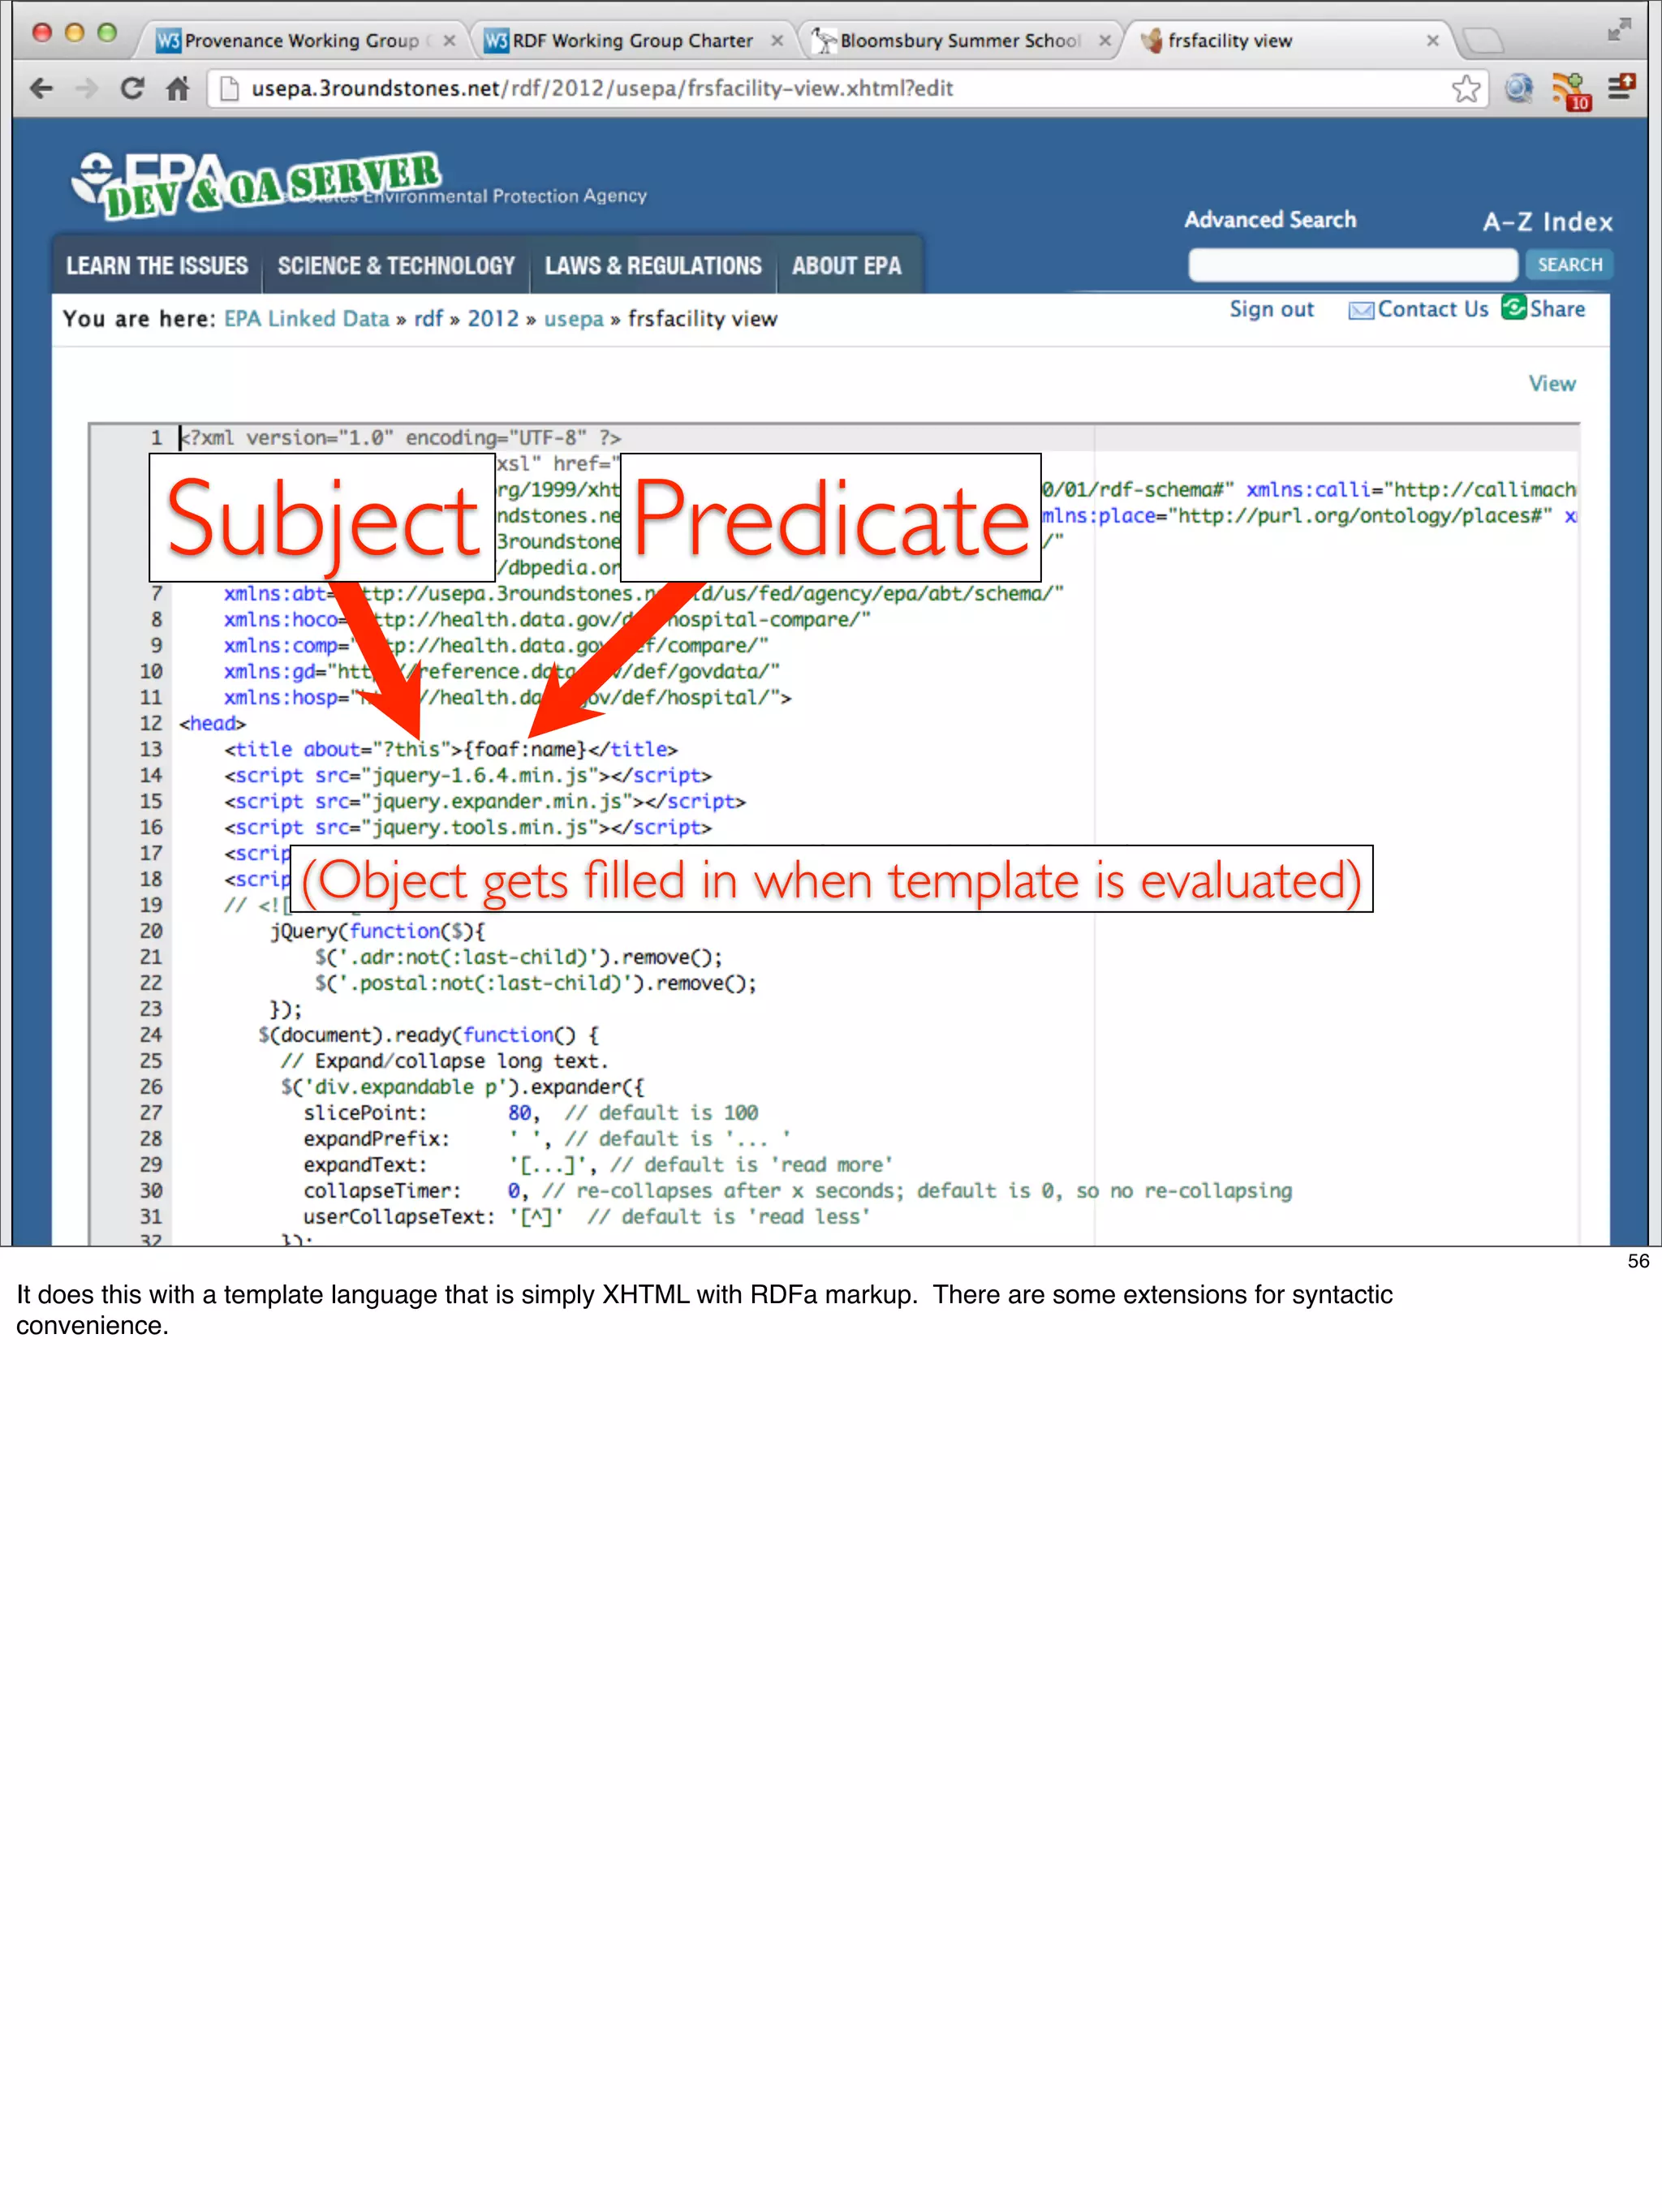
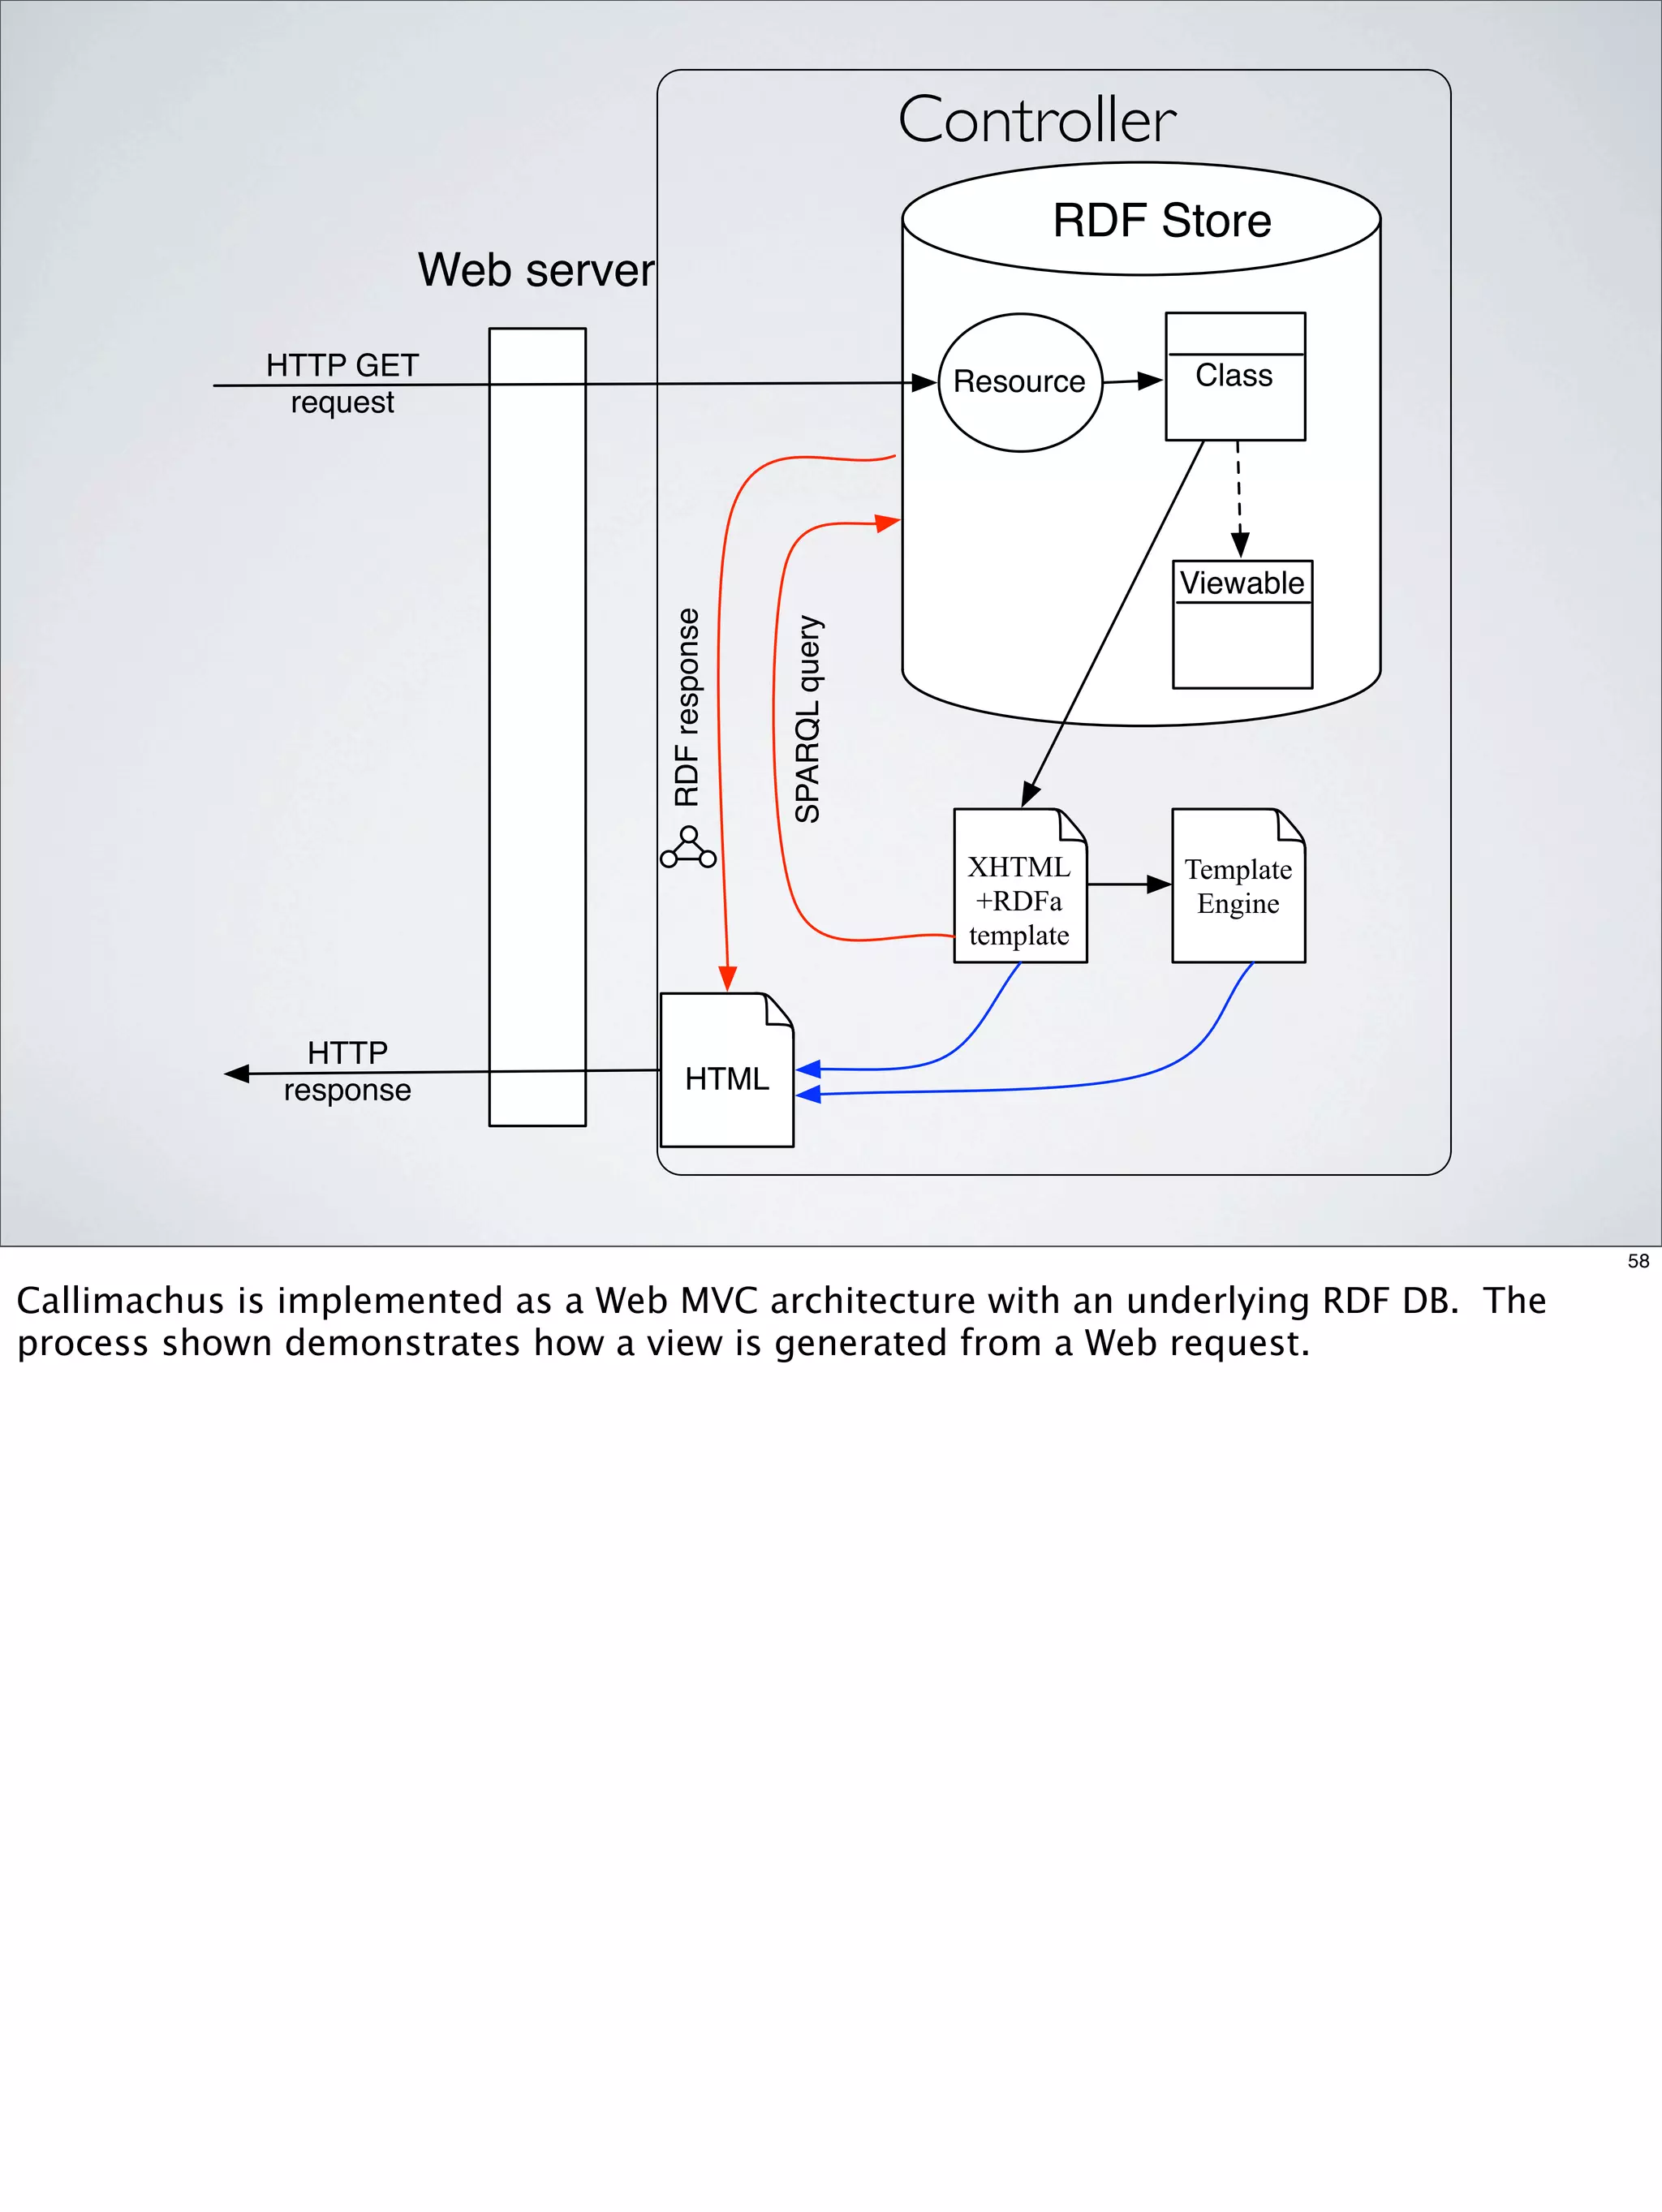
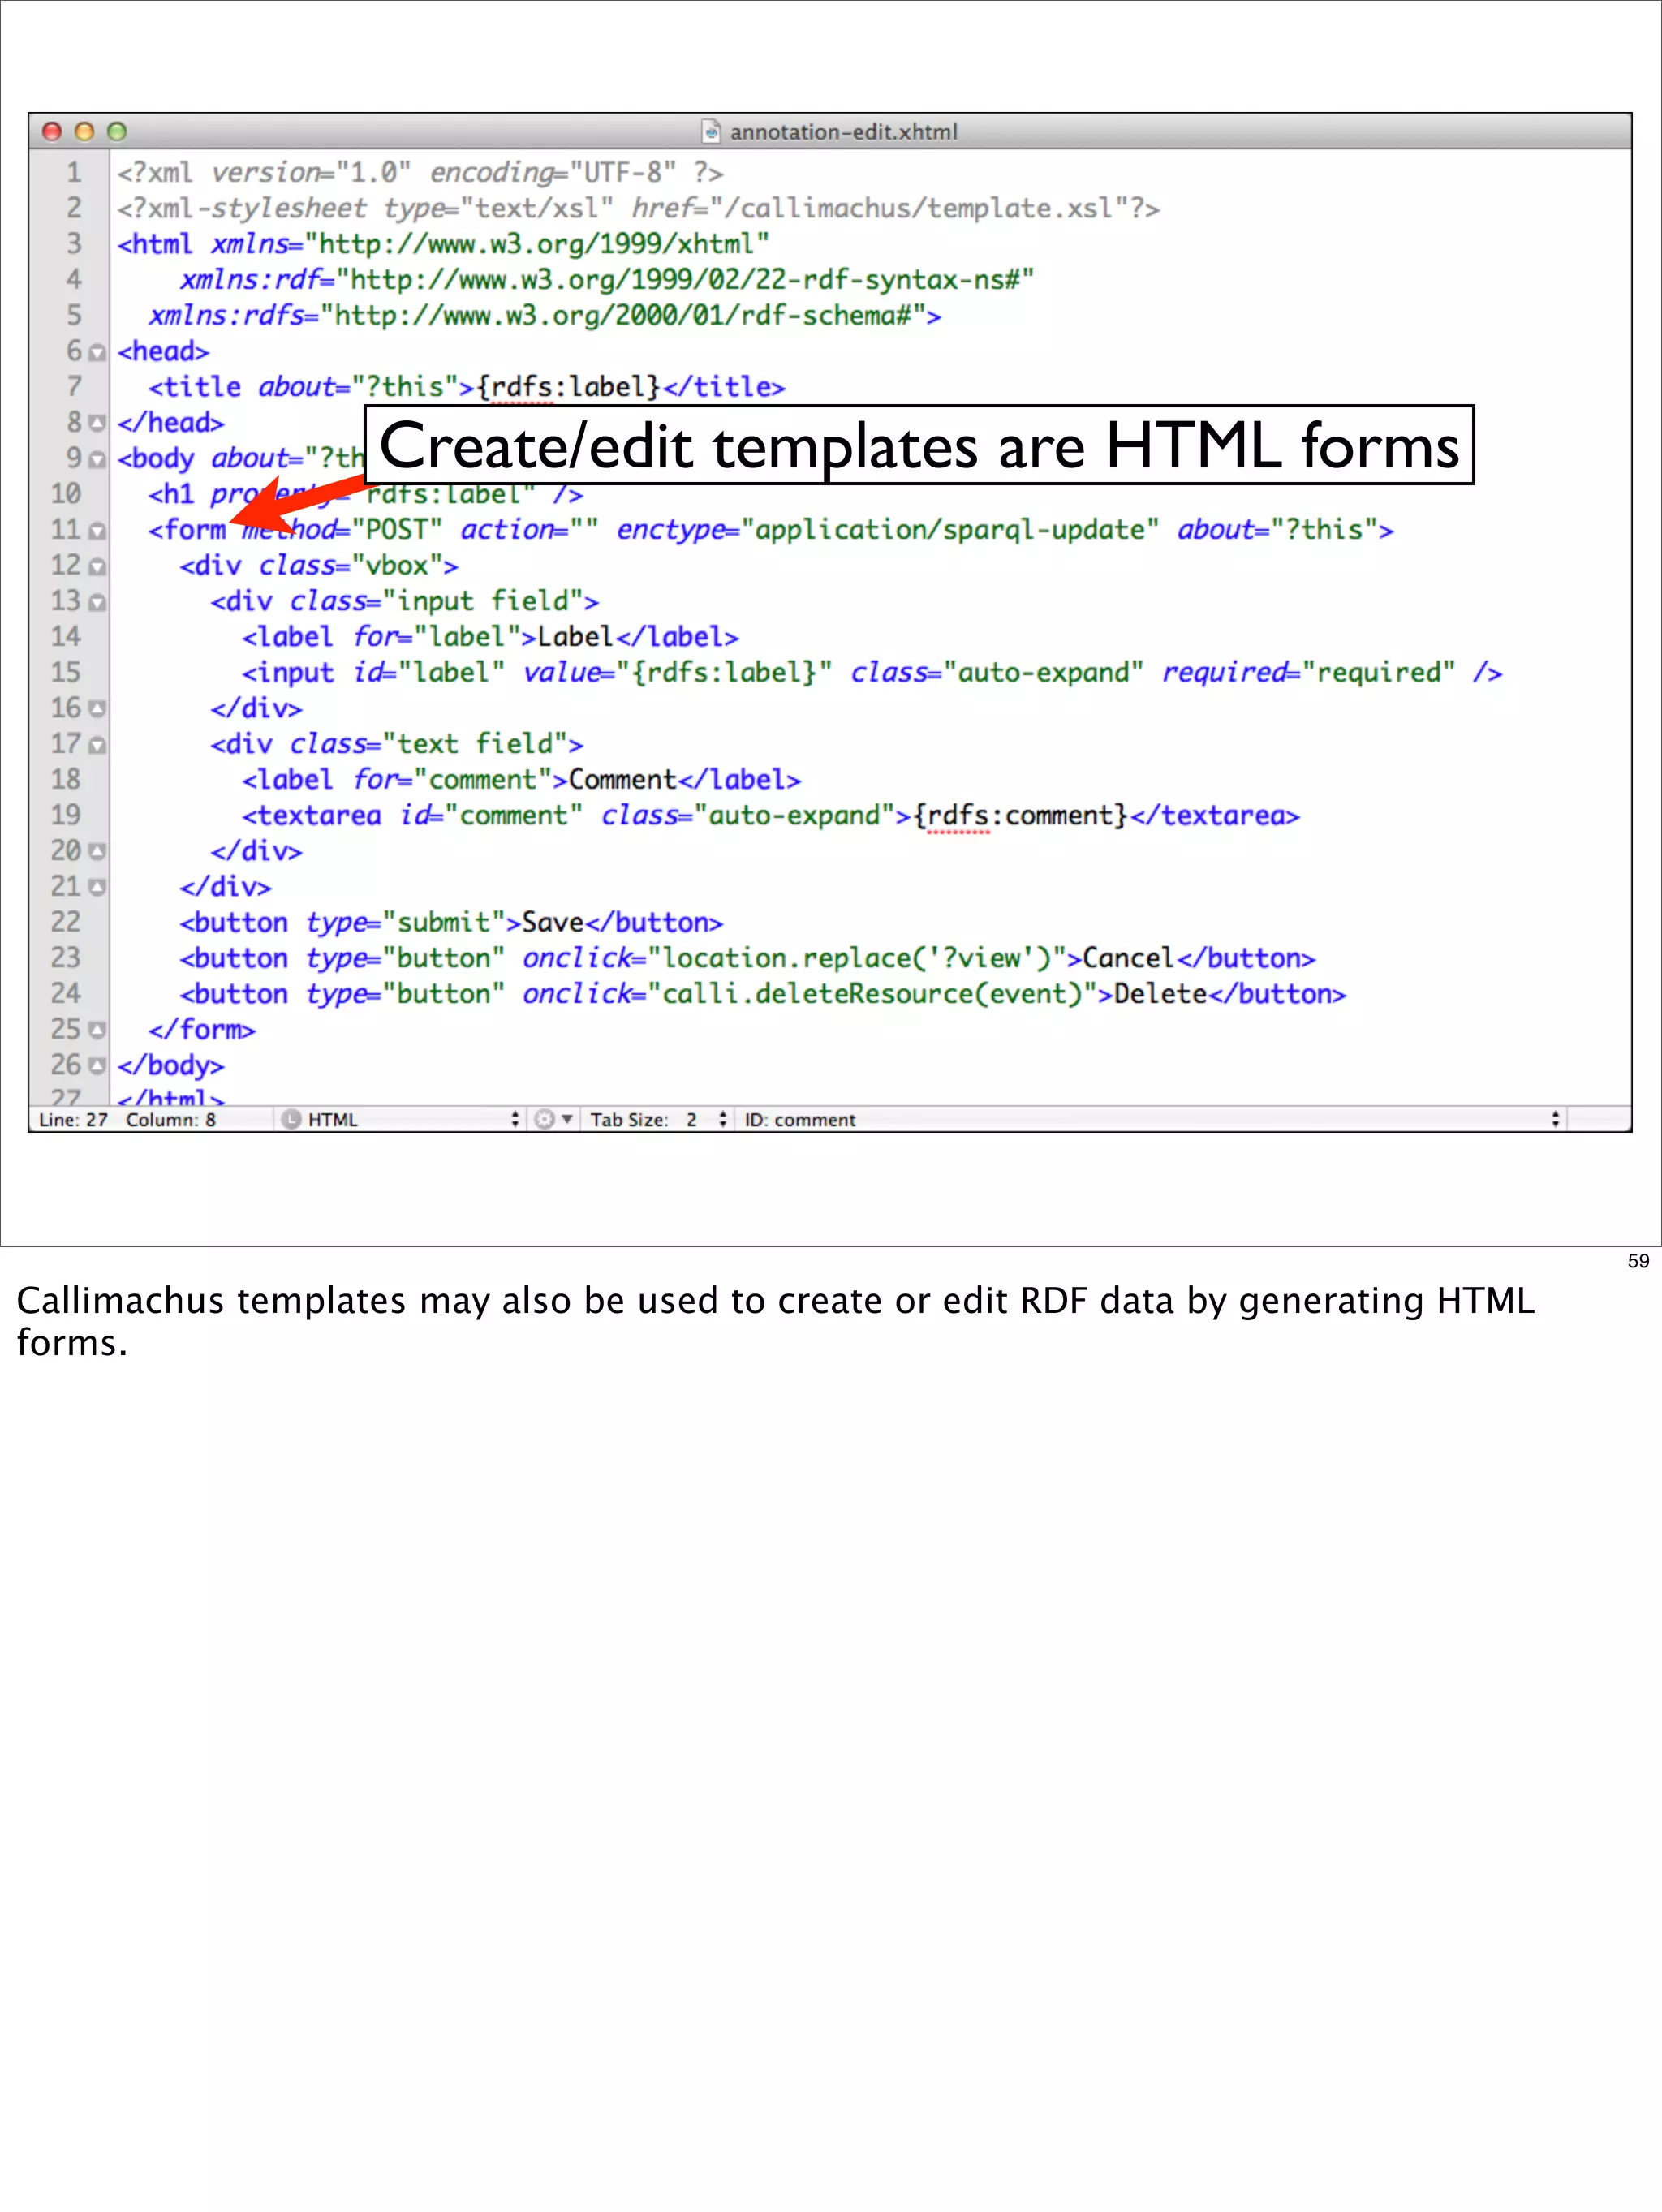
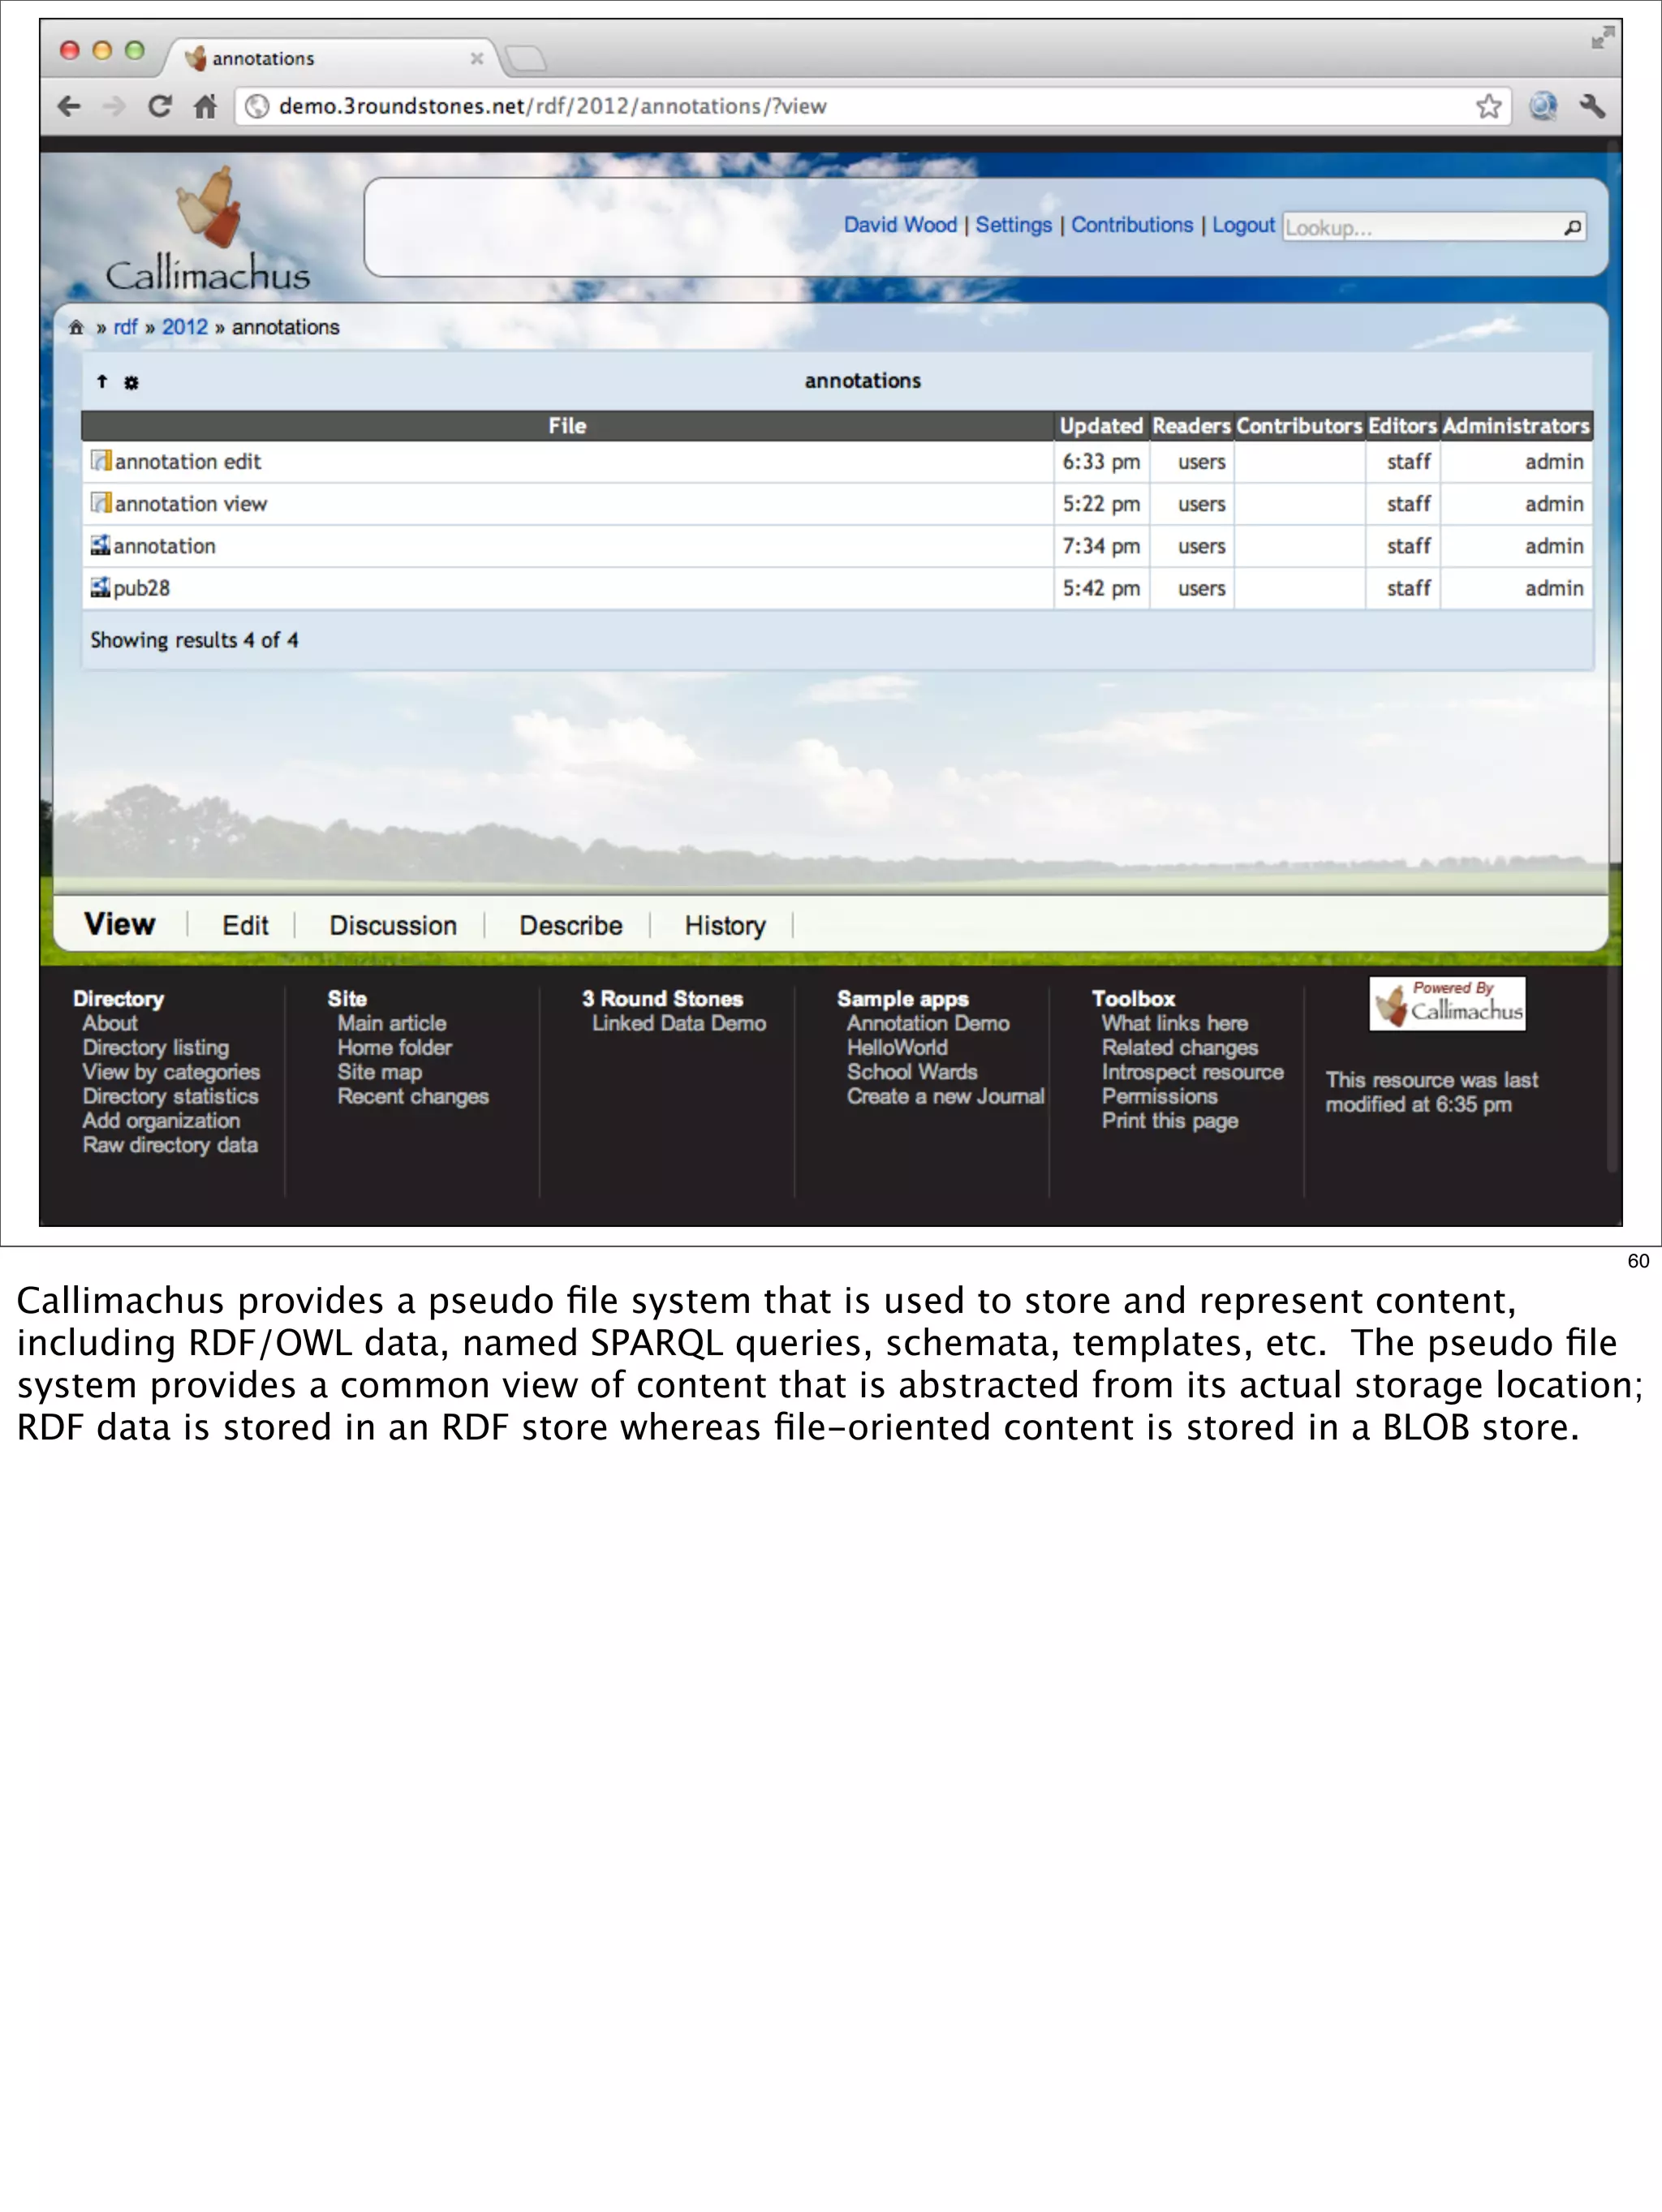
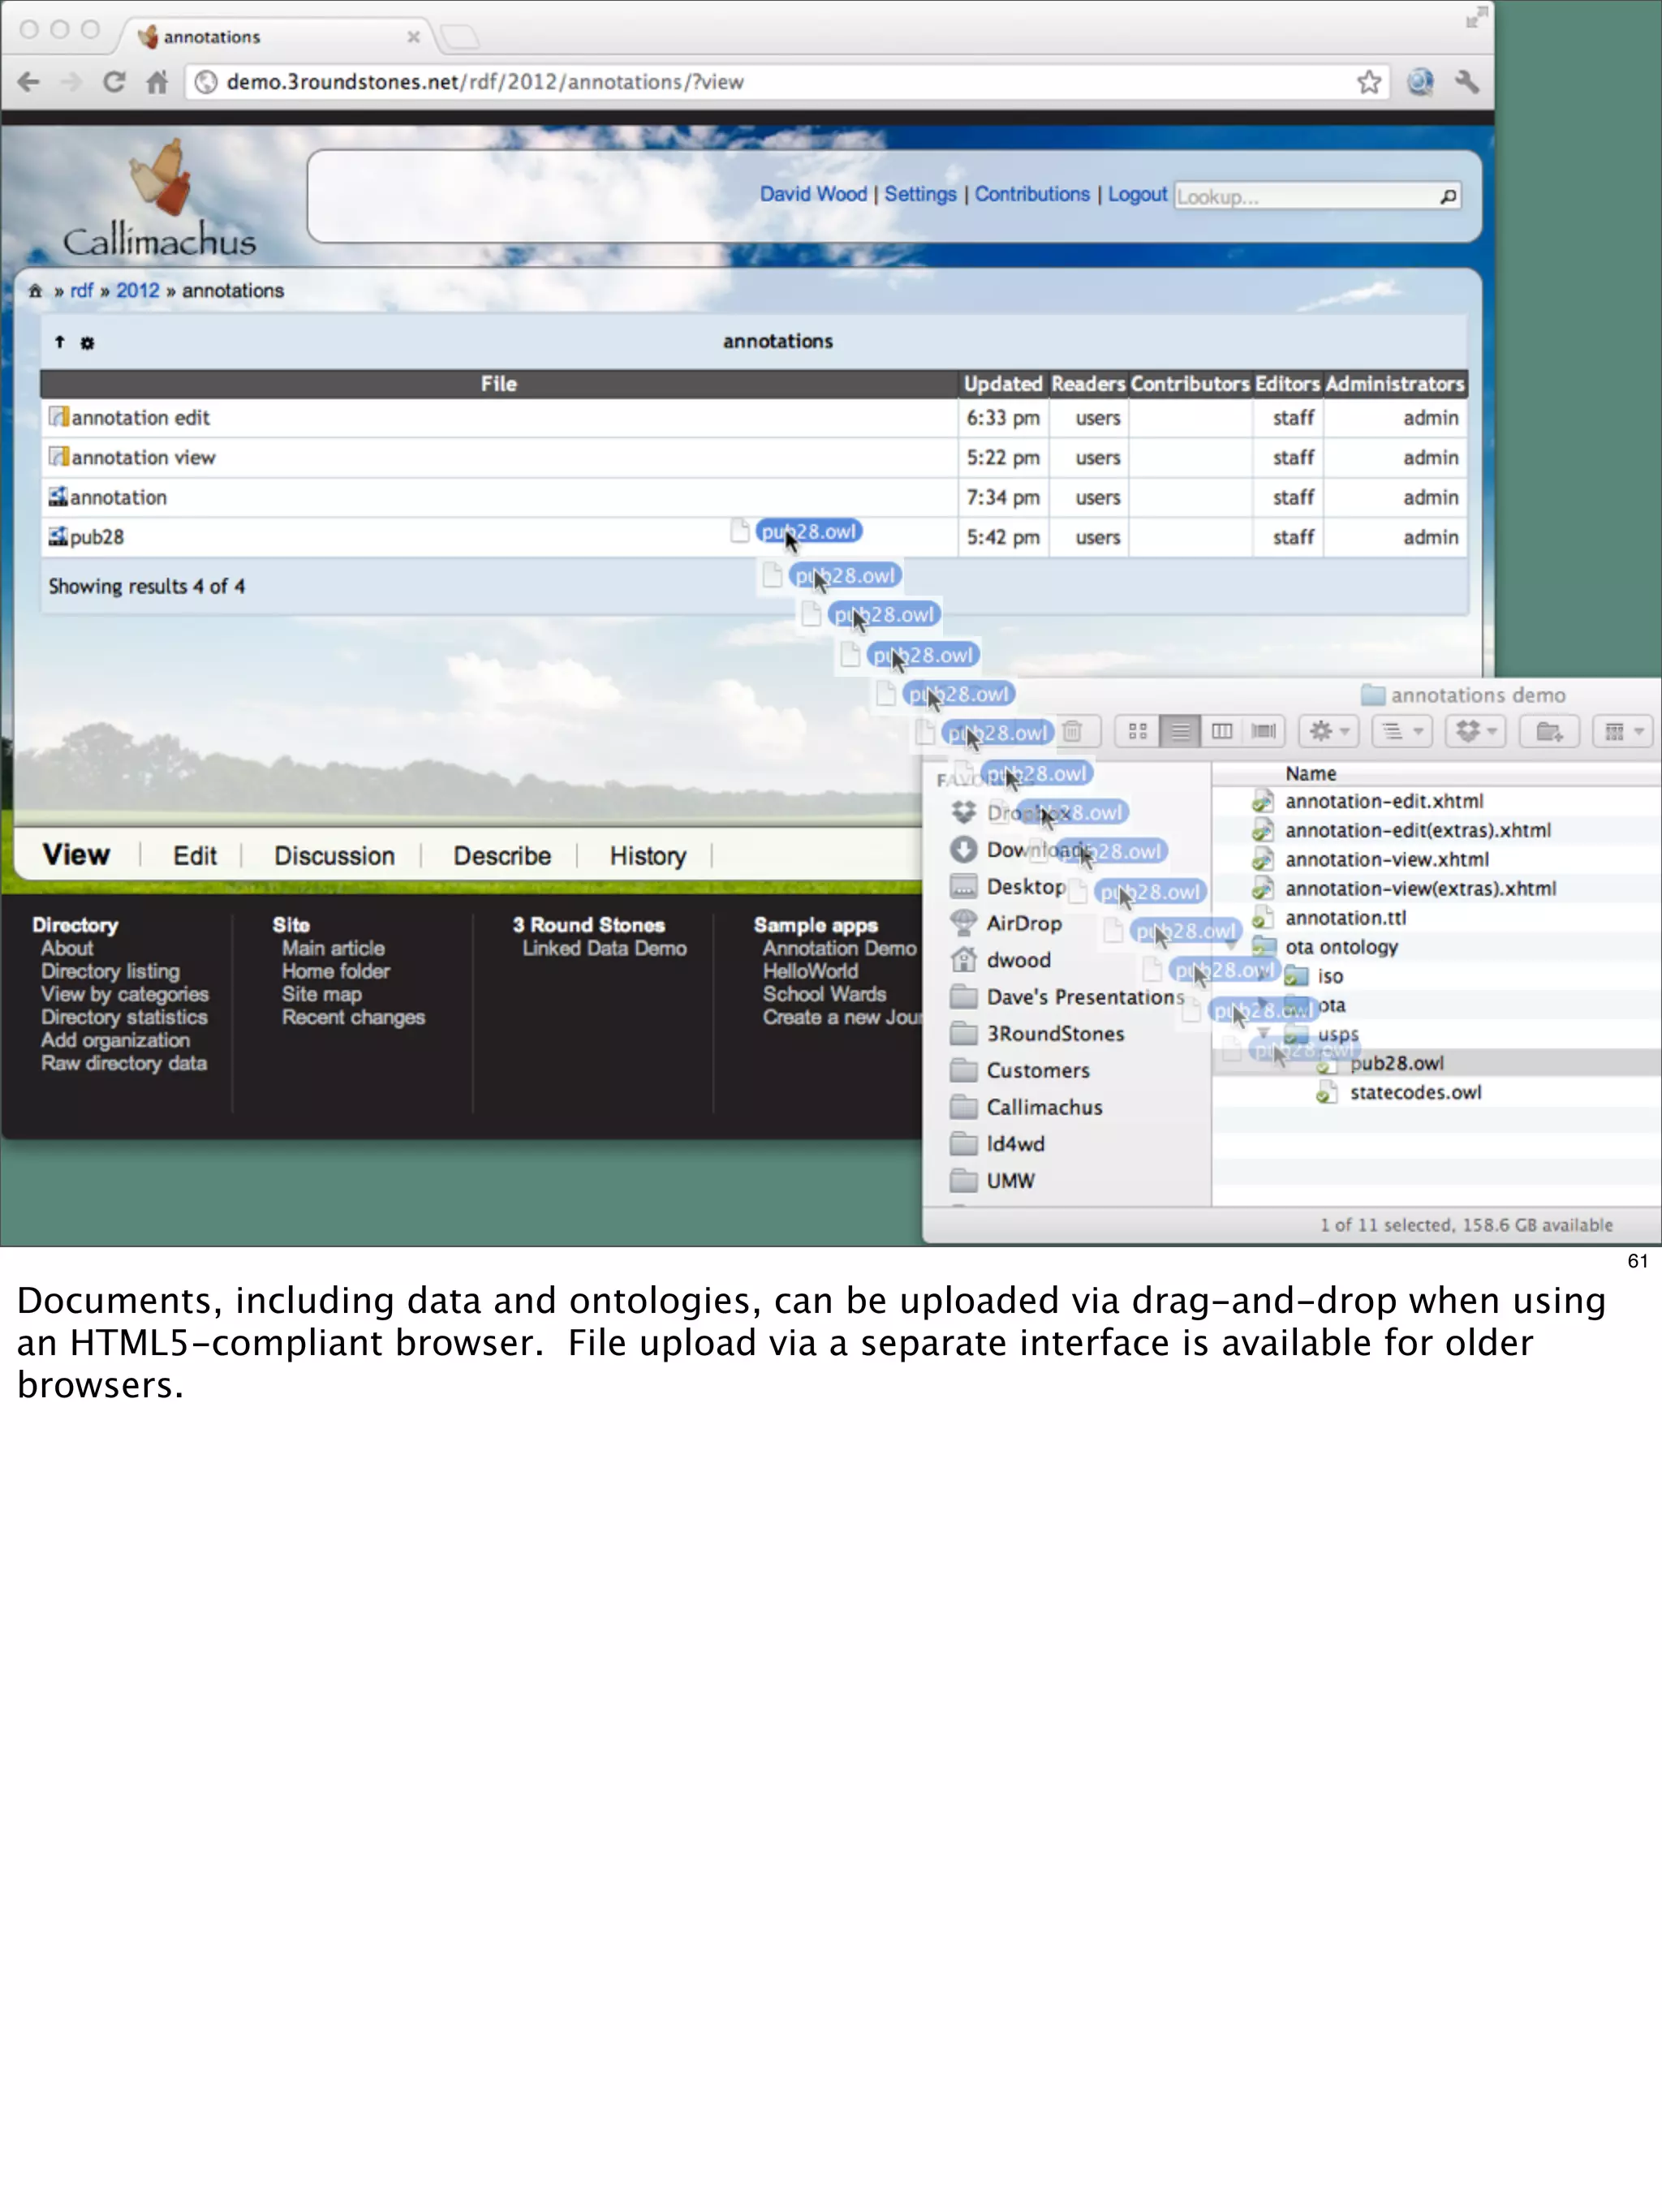
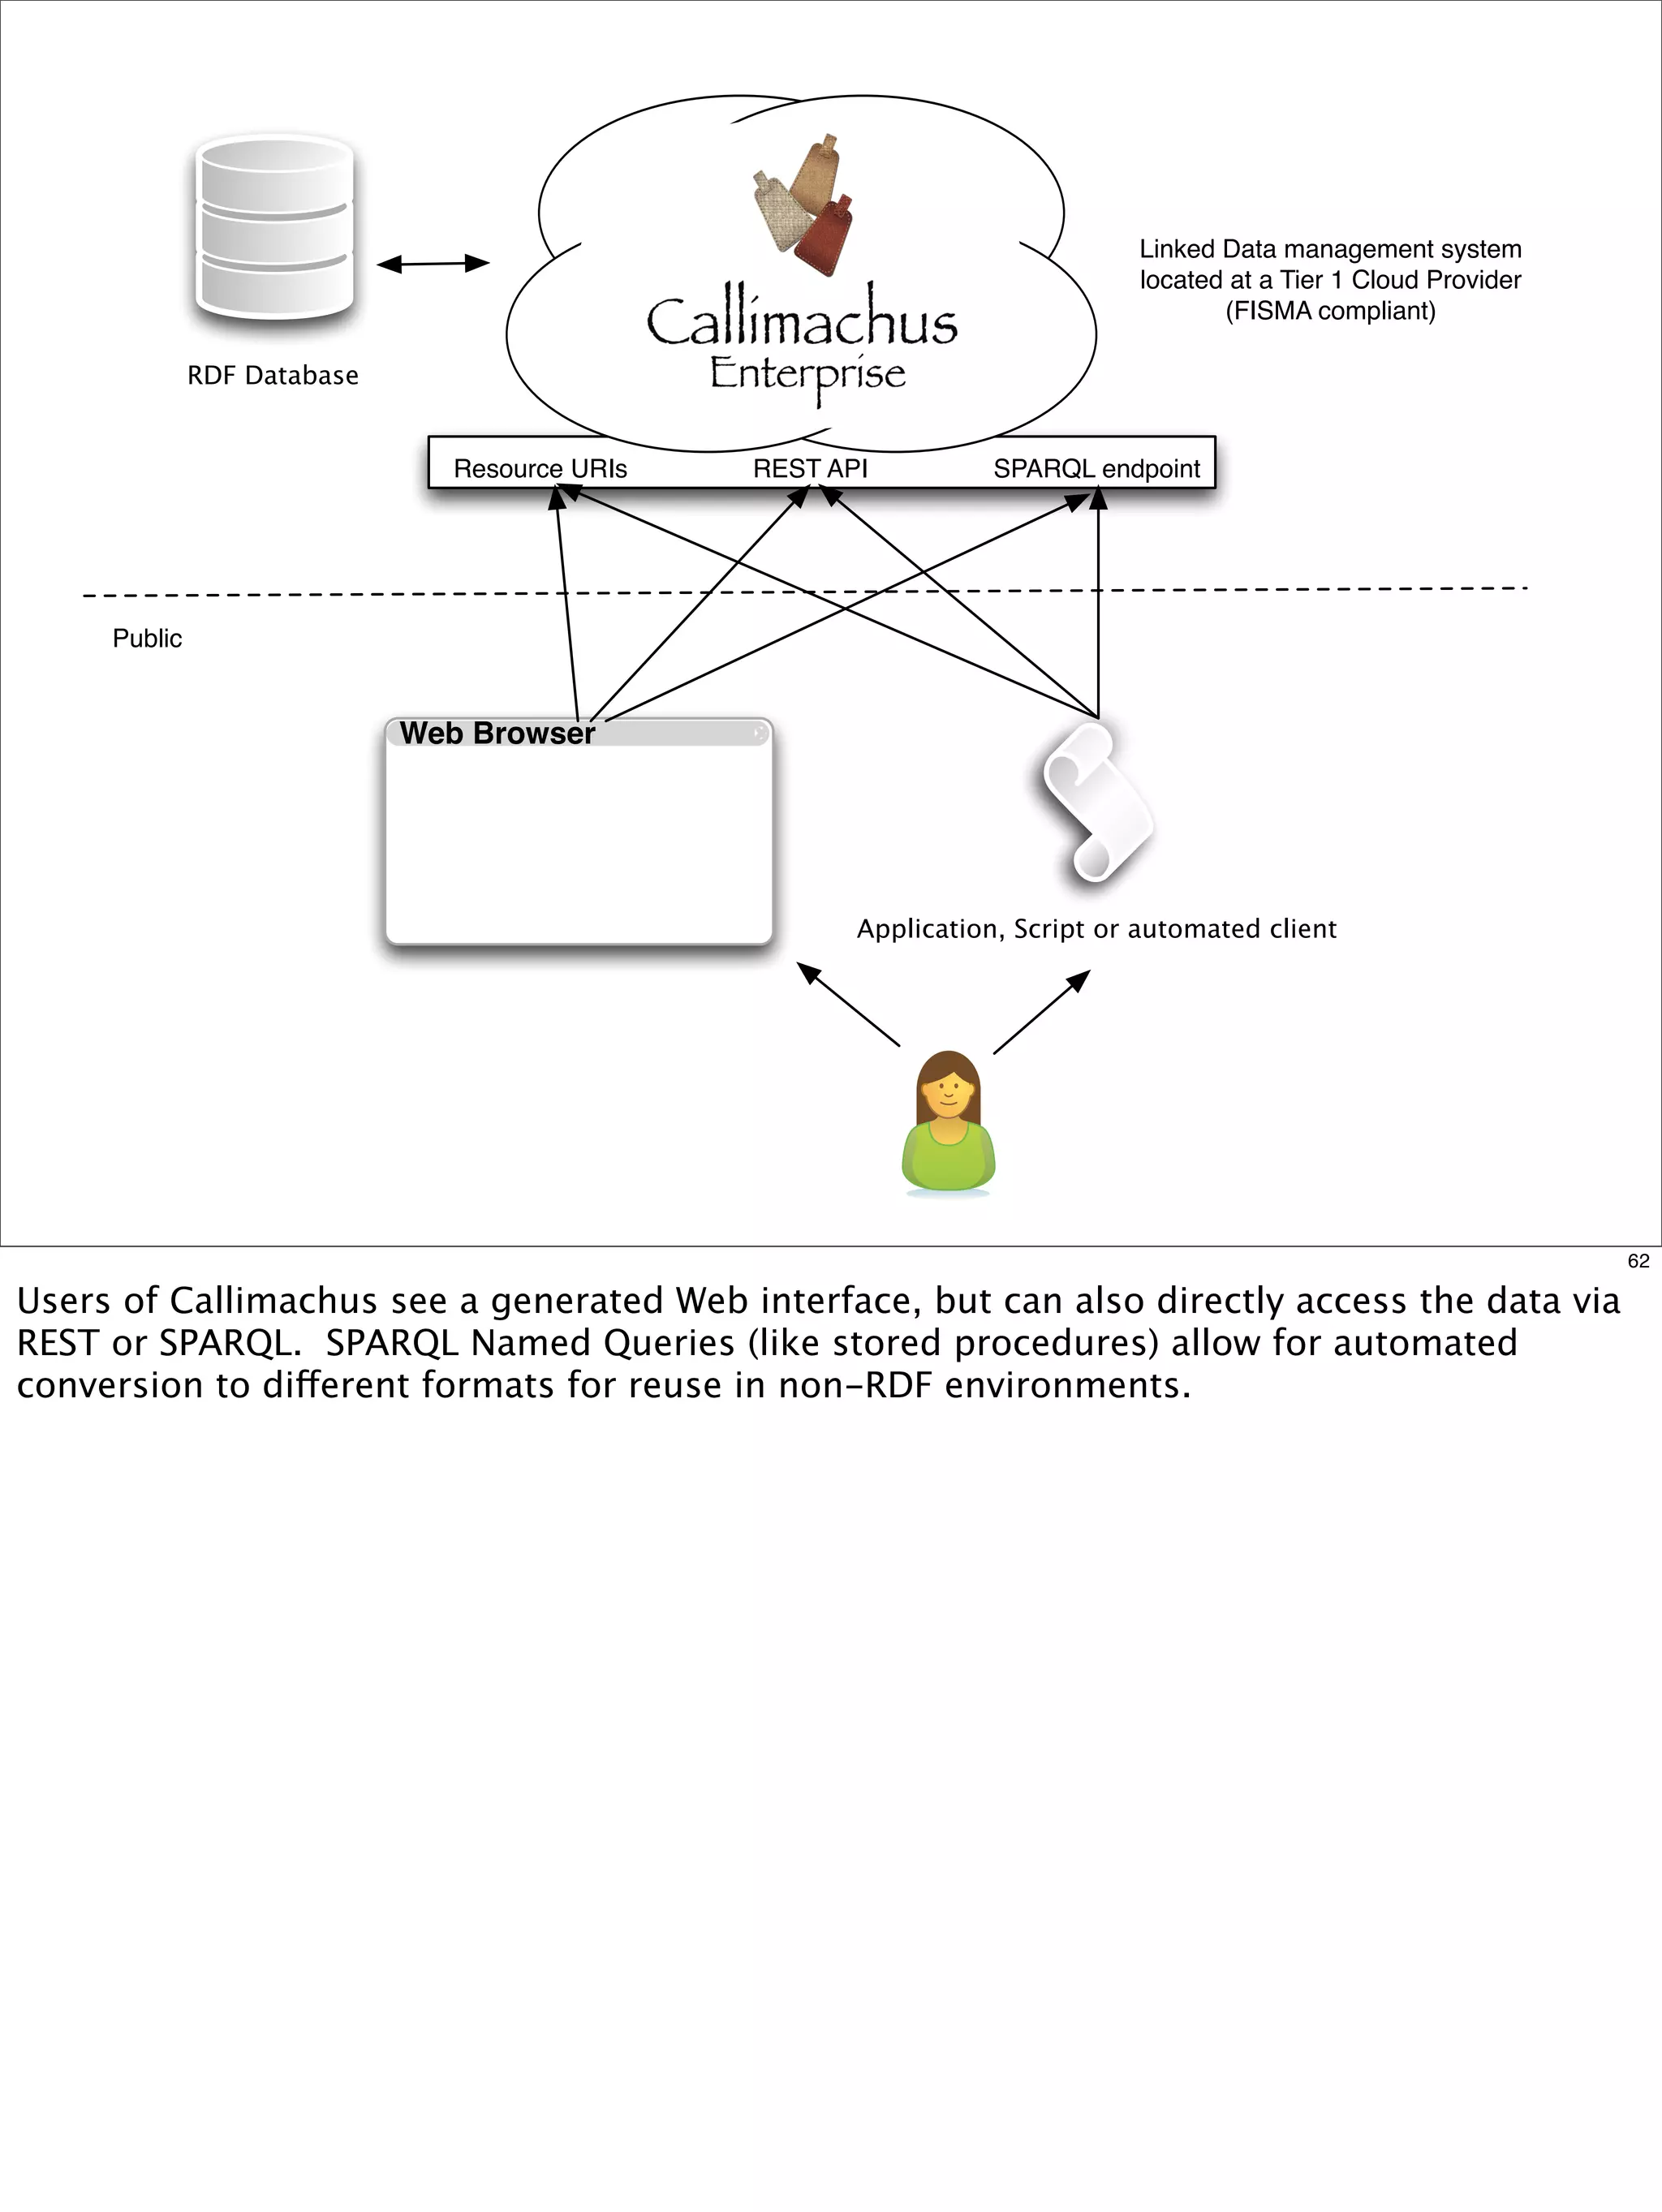
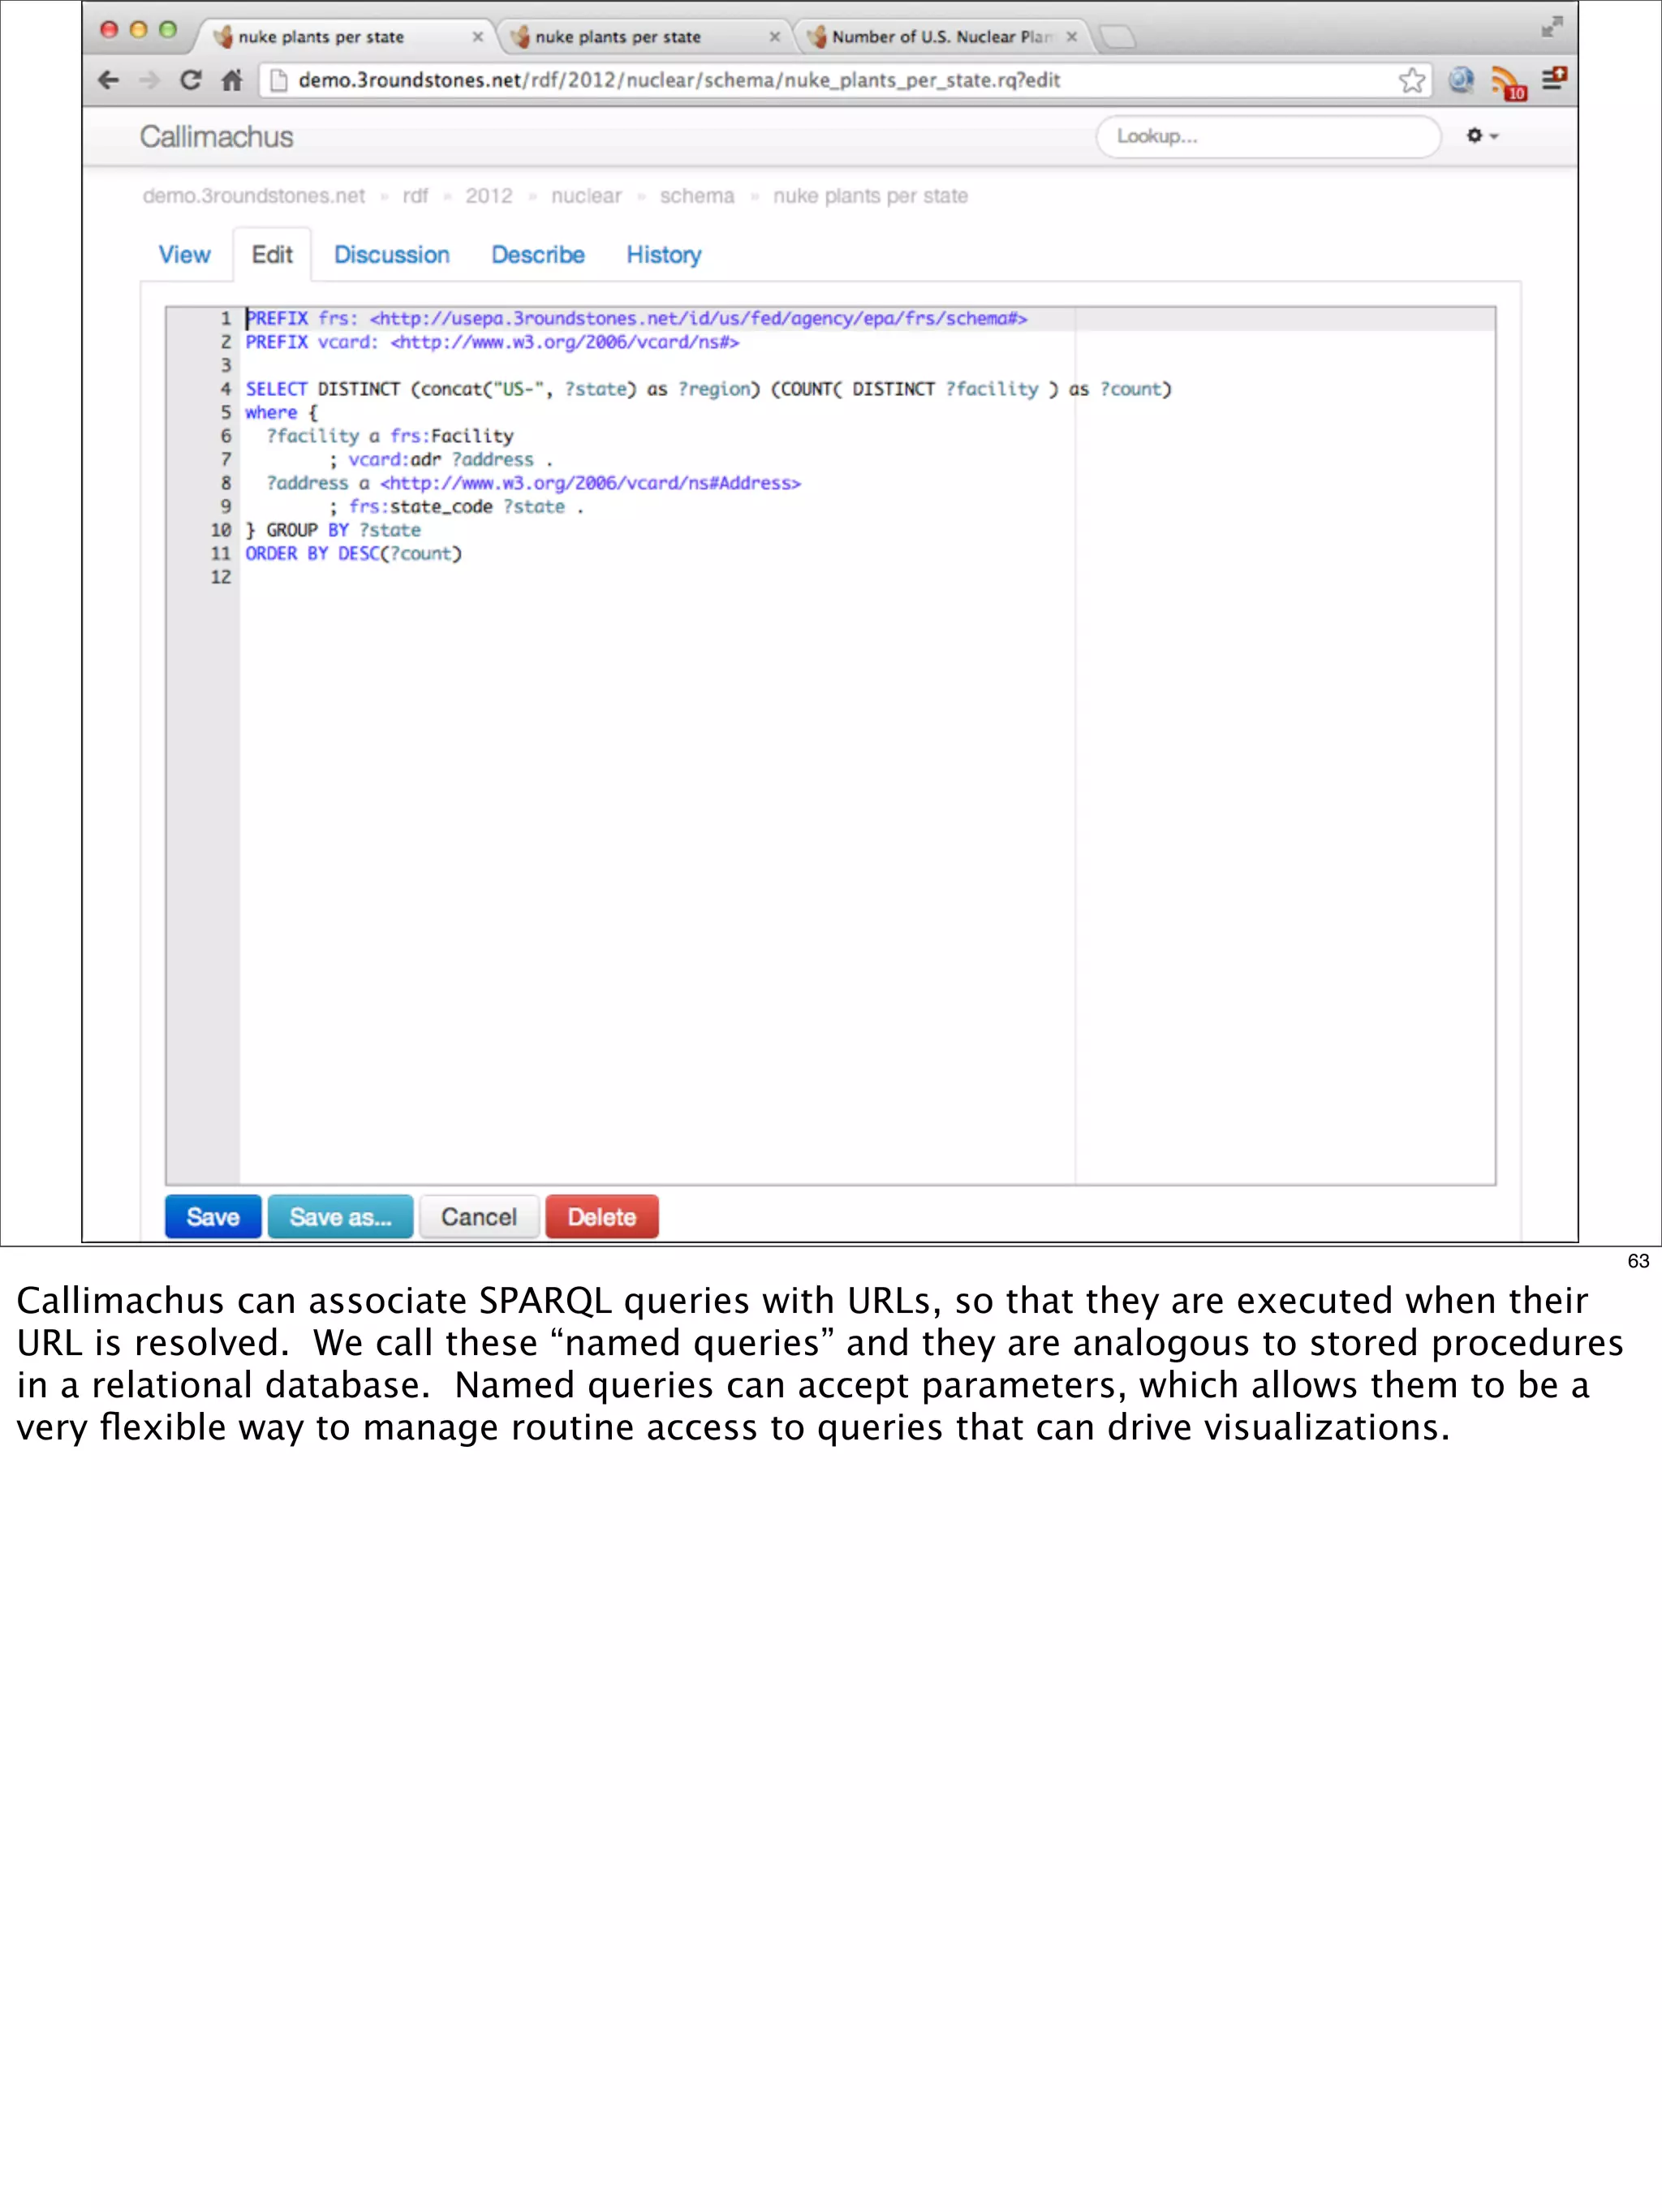

The document outlines a presentation on linked data at the EPA, highlighting trends in government data management, the increasing importance of open data, and the transition to semantic technologies for improving information access. It discusses the benefits of linked data for better data reuse and interoperability, emphasizing how it facilitates innovation in public services and research. Additionally, it introduces the Callimachus platform as a solution for publishing reusable linked data while addressing challenges in accessing and utilizing governmental data systems.


![Vibe Coding vs. Spec-Driven Development [Free Meetup]](https://cdn.slidesharecdn.com/ss_thumbnails/vibecodingvsspecdrivendevelopment-251209105622-43f455e7-thumbnail.jpg?width=640&height=640&fit=bounds)


