This document is a 65-page master's paper that analyzes user data from two large open data initiatives in the United States, Open Raleigh in Raleigh, NC and DataSF in San Francisco, CA, in order to determine a profile of open data users. The paper studies demographics of open data users from surveys conducted by each initiative and discusses implications for the future of open data programs and whether the current user demographics are acceptable given public funding of these initiatives.
Study: Economic Analysis of Methane Emission Reduction Potential from Natural...Marcellus Drilling News
A new independent assessment of methane abatement costs by ICF International concluded that the cost to reduce methane emissions from natural gas systems is $3.35/Mcf of methane reduced, nearly five times greater than previous estimates suggest.
The projection examines impact of demographic changes and changes in health status on future (up to 2050) health expenditures. Next to it, future changes in the labour market participation and their impact on the health care system revenues are examined. Impact of demography on the health care system financial balanced is examined in four different scenarios: baseline scenario, death-related costs scenario, different longevity scenario and diversified employment rates scenario. Results indicate dynamic and systematic increase of the health expenditures in the next 30 years. Afterwards the dynamics of this process is foreseen to slow down. Despite the increase of the revenues of the health care system, the system will face deficit in the close future. This holds for each scenario, however the size of the deficit differs depending on longevity and labour market participation assumptions. Results lead to a discussion on possible reforms of the health care system.
Authored by: Stanislawa Golinowska, Ewa Kocot, Agnieszka Sowa
Published in 2008
This workshop will provide an overview of the statistical test choices, variable creation and transformation, and output interpretation using SPSS. Hands-on lab exercises will demonstrate how to execute basic data transformations and analyses using SPSS. Descriptive statistics, chi-square, means comparisons (t-test and one-way ANOVA) and correlations will be covered. We will spend about one hour covering basic information about SPSS and getting ready for data entry in a lecture format and two hours in the computer lab with hands-on exercises in using SPSS.
Topics:
Preparing your data (lecture)
Creating a codebook – variables, names, labels, missing values
Entering data in SPSS (lecture and lab exercises)
Using SPSS and importing from EXCEL
Modifying and organizing your data (lab exercises)
Compute, recode, and count transformations
Descriptive statistics (lab exercises)
Frequencies, descriptives, and simple graphs
Statistics for single dependent variables (lab exercises)
Chi square
Correlation
T-Test
One Way ANOVA
William behan analysis 2018 dper and tcd 2017 reports on general practiceDrWilliamBehan
A Critical Analysis of 2018 DPER report and 2017 TCD report on Irish General Practice Reviewing:
1. The public spend on general practice
2. The private spend on general practice
3. Points 1. and 2. deliver a total spend on Irish general practice
4. Comparison of the Irish annual payment per GMS patient and UK NHS payment
5. The mis-calculation of the UK nurse activity rates relative to Irish GP nurse workload
6. The extrapolated savings benefits from utilising nurse triage is unreliable.
7. Suggesting a lack of proof of the efficiency of Irish general practice is a result of the ignorance of the authors
YOUR FREE TRADING SYSTEM: http://www.netpicks.com/tjgiveaway1
The way risk is handled by Van Tharp, as I’m sure many of you will already know, is by expectancy. Expectancy is basically your average trade in terms of your initial risk. So if your initial risk on a trade is $500 and the trade goes on to make $1,000, the trade is said to have made a 2R profit. If initial risk is $300 and you lose $450, you’ve lost 1.5R.
The way I see this is that it’s a very good way to compare the quality of trades where the specific $ amounts don’t always align particularly well and it gives you a better idea of what you should expect to make or lose on each trade you take. In my opinion, this analysis is particularly well-suited to people trading across a broader range of products such as a portfolio of stocks and this is how my chance conversation began.
Read more: http://www.netpicks.com/do-you-make-this-huge-trading-mistake/
Course Overview & History of the Social Welfare System
Approaches to the Social Welfare System
The History of the Social Welfare System
Colonial Period, Pre-During-Post Civil War Period, Progressive Era, Great Depression & The New Deal, The Social Reform Years, The Retrenchment Years & the New Millennium
Research: Developing an Interactive Web Information Retrieval and Visualizati...Roman Atachiants
Finding the needed information (images, articles or other) is not always as simple as going to a search en-
gine. This paper aim at developing an interactive presentation system, able to cope with live presentation
challenges.
A Usability Evaluation carried out on my second year Brunel Group project.
A.R.C. (Augmented Reality Communicator), is an augmented reality social networking application , designed and built for my second year group project at Brunel University.
Big Data Social Network Analysis (BDSNA) is the focal computational and graphical
study of powerful techniques that can be used to identify clusters, patterns, hidden
structures, generate business intelligence, in social relationships within social networks
in terms of network theory. Social Network Analysis (SNA) has a diversified set of
applications and research areas such as Health care, Travel and Tourism, Defence and
Security, Internet of Things (IoT) etc. . . With the boom of the internet, Web 2.0
and handheld devices, there is an explosive growth in size, complexity and variety in
unstructured data, thus the analysis and information extraction is of great value and
adaptation of Big Data concept to SNA is vital.
This literature survey aims to investigate the usefulness of SNA in the “Big Data
(BD)” arena. This survey report reviews major research studies that have proposed
business strategies, BD approaches to generate predictive models by gratifying contemporary
challenges that have arises from SNA.
A Global Web Enablement Framework for Small Charities and Voluntary Sector Or...Tom Robinson
With more people gaining access to the internet every day, the web enabling of core services and business processes is becoming essential. There is a great deal of existing research covering techniques and approaches to web enablement for commercial and public sector organisations, but very little that is aimed specifically at small charities and voluntary sector organisations. Numerous studies have shown that charities often lag behind commercial organisations when it comes to their internet infrastructure and the extent of web enablement. This dissertation investigates the needs and issues which charities face, in order to define a number of key web enablement aims and objectives. Some problems are unique to the charitable sector whilst others apply to all types of organisations.
As most web applications can be accessed from anywhere in the world, globalisation is an inherent web development issue. A number of the most common issues associated with globalisation are examined and current best practice solutions suggested.
The Foundations, Fundamentals, Features and Future (F4) Framework is the outcome of the research into the situation, needs and issues faced by charitable organisations. It offers a simple but detailed framework designed specially for web enablement projects within charitable organisations. The framework is broken down into four key stages of web enablement – foundations, fundamentals, features and future possibility. Through the four layers, the framework covers key business drivers, internet access and security, error-handling techniques through to global database access and undeveloped future technologies.
The framework was developed and refined through research and work undertaken with GAP Activity Projects, a worldwide gap year charity. To demonstrate the implementation of the framework, GAP is used as a case study. A number of web and related applications are developed and evaluated including an online application system, mass mailing tools and an extranet application. The case study demonstrates a number of novel techniques that have been developed to solve some of the problems which were faced, including the use of XML as a data storage method and a unique form validation technique.
Although the evaluation of the framework shows that it meets well the objectives it set out to achieve, there are opportunities for improvement and future work. A number of future expansions possibilities are examined including the use of mobile technology and content management systems.
This is a report on a mobile application that enables one to easily identify happening places, hotels and guest houses within a particular city, its currently being tested in Gulu City by the the users and the development team
User behavior model & recommendation on basis of social networks Shah Alam Sabuj
At present social networks play an important role to express people's sentiment and interest in a particular field. Extracting a user's public social network data (what the user shares with friends and relatives and how the user reacts over others' thought) means extracting the user's behavior. Defining some determined hypothesis if we make machine understand human sentiment and interest, it is possible to recommend a user about his/her personal interest on basis of the user's sentiment analyzed by machine. Our main approach is to suggest a user regarding the user's specific interest that is anticipated by analyzing the user's public data. This can be extended to further business analysis to suggest products or services of different companies depending on the consumer's personal choice. This automation will also help to choose the correct candidate for any questionnaire. This system will also help anyone to know about himself or herself, how one's behavior may influence others. It is possible to identify different types of people such as- dependable people, leadership skilled, people of supportive mentality, people of negative mentality etc.
Każdy Amerykanin konsumuje 34 GB danych dziennie.
Coroczny raport Uniwersytetu Kalifornia bada przyswajanie tych danych via sieć, tv, radio, konsole, czytając, itd.
To pokazuje ogrom danych jakie docierają do każdego konsumenta. Można śmiało przypuszczać, że w przypadku europejczyków te dane są zbliżone.
Similar to John O'Connor Master's Paper Final (20)
1.
John
O’Connor.
Towards
a
Profile
of
Open
Government
Data
Users.
A
Master’s
Paper
for
the
M.S.
in
I.S.
degree.
April,
2015.
65
pages.
Advisor:
Prof.
Paul
Jones
This
paper
studies
the
user
bases
of
two
large
open
data
initiatives
in
the
United
States
in
order
to
determine
a
profile
of
the
users
of
open
data
services.
Survey
data
from
Open
Raleigh
(Raleigh,
NC)
and
DataSF
(San
Francisco,
CA)
are
used
in
combination
to
determine
demographics
of
open
data
users.
Discussion
includes
implications
of
demographics
on
the
future
of
open
data
initiatives
and
whether
the
demographics
as
they
exist
today
are
acceptable
for
programs
funded
by
the
public
at
large.
Headings:
Electronic
government
information
Internet
in
public
administration
Linked
data
(Semantic
Web)
Public
records
2.
TOWARDS
A
PROFILE
OF
OPEN
GOVERNMENT
DATA
USERS
by
John
O’Connor
A
Master’s
paper
submitted
to
the
faculty
of
the
School
of
Information
and
Library
Science
of
the
University
of
North
Carolina
at
Chapel
Hill
in
partial
fulfillment
of
the
requirements
for
the
degree
of
Master
of
Science
in
Information
Science.
Chapel
Hill,
North
Carolina
April
2015
Approved
by
_______________________________________
Prof.
Paul
Jones
3. 1
Table
of
Contents
Table
of
Contents
.......................................................................................................
1
1
Introduction
............................................................................................................
3
1.1
Background
..................................................................................................................
3
1.2
Problem
Statement
......................................................................................................
3
1.3
Significance
of
Study
....................................................................................................
4
2
Literature
Review
....................................................................................................
6
2.1
History
of
Open
Government
.......................................................................................
6
2.2
History
of
Open
(Government)
Data
.............................................................................
9
2.3
Principles
of
Open
Government
Data
.........................................................................
12
2.4
Future
of
Open
Government
Data
..............................................................................
17
3
Methods
...............................................................................................................
22
3.1
Data
Collection
...........................................................................................................
22
3.1.1
Surveys
......................................................................................................................
22
3.1.2
Analytics
.....................................................................................................................
23
3.2
Data
Analysis
.............................................................................................................
23
4
Analysis
of
Open
Raleigh
(Raleigh,
NC)
..................................................................
25
4.1
Introduction
...............................................................................................................
25
4.2
Acquisition
.................................................................................................................
25
4.3
Use
.............................................................................................................................
26
4. 2
4.4
Demographics
............................................................................................................
28
4.5
Conclusion
.................................................................................................................
30
4.6
Open
Raleigh
Figures
..................................................................................................
31
5
Analysis
of
DataSF
(San
Francisco,
CA)
..................................................................
36
5.1
Introduction
...............................................................................................................
36
5.2
Use
.............................................................................................................................
36
5.3
Demographics
............................................................................................................
37
5.4
Conclusion
.................................................................................................................
38
5.5
DataSF
Figures
............................................................................................................
39
6
Discussion
in
Combination
....................................................................................
42
6.1
Comparison
of
Open
Raleigh
and
DataSF
....................................................................
42
6.2
Issues
With
Data
........................................................................................................
43
6.3
Generalizability
..........................................................................................................
45
6.4
Debate
Over
Public
Funds
............................................................................................
45
7
Conclusion
............................................................................................................
49
Bibliography
..............................................................................................................
51
Appendix
A:
Open
Raleigh
User
Survey
......................................................................
58
Appendix
B:
DataSF
Survey
Questions
.......................................................................
62
5. 3
1
Introduction
1.1
Background
According
to
the
Open
Knowledge
Foundation,
70
countries
around
the
world
have
some
form
of
Open
Government
Data
(OGD).1
There
have
been
numerous
benefits
associated
with
OGD
programs
as
discussed
in
the
literature
below.
OGD
in
the
United
States
has
rapidly
grown
in
popularity
since
2009.2
Data.gov
lists
over
150,000
datasets
as
of
September
2014
compared
to
just
47
in
when
it
launched
in
May
2009.3
OGD
is
a
unique
type
of
government
transparency
in
that
it
voluntarily
offers
information
to
the
public
for
immediate
consumption
via
the
Internet.
It
also
allows
administrators
to
offer
data
on
their
terms
(i.e.
agencies
can
choose
what
information
to
make
easily
accessible
in
this
way).
1.2
Problem
Statement
OGD
programs
often
measure
their
effectiveness
in
terms
of
two
metrics:
site
visits
and
downloads.
Site
visits
is
a
count
of
the
number
of
times
a
website
has
been
pulled
up
in
a
user’s
browser.
Some
organizations
measure
unique
visitors
(ignoring
multiple
hits
by
the
same
IP
address),
and
some
simply
use
raw
hit
counts.
Downloads
1
Open
Data
Index.
Open
Knowledge
Foundation.
2
Joshua
Tauberer.
2014.
History
of
the
Movement.
In
Open
Government
Data:
The
Book.
2nd
ed.
3
Eliot
Van
Buskirk,.
2010.
Sneak
peek:
Obama
Administration’s
Redesigned
Data.gov.
Wired.
6. 4
consists
of
the
number
of
times
a
given
data
file
has
been
transferred
onto
the
local
drive
of
a
machine
or
the
number
of
rows
loaded.
There
have
also
been
studies
on
the
completeness
of
open
data
programs
or
on
the
“quality”
of
the
programs
(broadly
defined)
using
self-‐reported
claims
of
data
availability.4
These
statistics
allow
program
administrators
to
get
a
vague
sense
of
the
popularity
of
their
datasets,
but
provide
no
actual
information
about
what
users
do
with
the
data
and
whether
users
are
satisfied
with
the
data
they
are
given.
This
study
examines
open
government
data
in
Raleigh,
NC
and
San
Francisco,
CA
to
determine
a
profile
of
the
users
of
OGD
in
these
areas
and
provide
an
initial
picture
of
how
these
datasets
are
being
used.
Specific
questions
that
will
be
answered
include:
1. What
are
the
characteristics
of
current
OGD
users?
2. For
what
purposes
are
OGD
datasets
being
used?
3. How
can
OGD
programs
improve
their
services
to
citizens?
1.3
Significance
of
Study
This
study
is
based
on
two
previous
studies
that
have
been
undertaken
in
a
similar
manner.
The
first
is
Brooks
Breece’s
2010
Master’s
paper,
Local
Government
Use
of
Web
GIS
in
North
Carolina.
In
this
study,
Breece
looked
at
the
effects
of
web
Geographic
Information
Services
(GIS)
on
local
agencies.
This
paper
uses
methods
similar
to
his
to
determine
the
outcomes
of
OGD
in
local
communities.
4
US
City
Open
Data
Census.
2014.
Open
Knowledge
Foundation.
7. 5
Second,
it
is
based
on
the
2014
paper
Open
Government
Data
Implementation
Evaluation
by
Parycek
et
al.5
In
their
paper,
Parycek
et
al.
used
surveys
of
both
internal
and
external
stakeholders
to
determine
current
and
future
measures
of
success
for
OGD
in
the
Austrian
city
of
Vienna.
This
study
makes
similar
use
of
survey
methodology
to
build
a
picture
of
how
users
interact
with
OGD,
their
views
on
its
benefits,
and
their
suggestions
for
improvement.
This
study
is
the
first
of
its
kind
to
create
a
profile
of
OGD
users
for
selected
major
OGD
programs
in
the
United
States
and
extrapolate
those
findings
to
lessons
for
OGD
programs
across
the
nation.
5
Peter
Parycek,
Johann
Höchtl,
and
Michael
Ginner.
"Open
Government
Data
Implementation
Evaluation."
Journal
of
Theoretical
and
Applied
Electronic
Commerce
Research
9
(2),
(2014):
80-‐99.
8. 6
2
Literature
Review
OGD
is
a
combination
of
two
different,
larger
movements:
the
open
government
movement
and
the
open
knowledge
movement.
This
literature
review
will
briefly
explore
the
history
of
these
two
movements
and
how
they
created
the
OGD
movement.
It
will
then
explore
a
definition
of
Open
Government
Data
by
examining
numerous
extant
open
data
principles
and
definitions.
Finally,
this
review
will
discuss
the
future
of
OGD
and
possible
directions
for
it
to
take.
2.1
History
of
Open
Government
Finding
a
history
of
transparency
in
government
is
to
try
to
find
a
history
of
the
world.
In
the
United
States,
government
transparency
has
come
in
and
out
of
fashion
throughout
the
decades.6
Modern
ideas
of
open
government
can
be
traced
to
post-‐
WWII
society
and
the
worry
that
government
had
become
excessively
powerful
and
secretive.
Wallace
Parks
notes
that,
“Both
major
parties
in
recent
[1950’s]
platforms
have
promised
to
free
government
information
pertaining
to
the
national
6
Martin
Halstuk
and
Bill
Chamberlin.
Open
Government
in
the
Digital
Age:
The
Legislative
History
of
How
Congress
Established
a
Right
of
Public
Access
to
Electronic
Information
Held
by
Federal
Agencies.
Journalism
&
Mass
Communication
Quarterly
78
(1)
(Spring
2001),
52-‐53.
9. 7
government.”7
President
Eisenhower,
in
his
famous
farewell
address,
warned
against
such
powerful
government
and
the
military-‐industrial
complex:
Only
an
alert
and
knowledgeable
citizenry
can
compel
the
proper
meshing
of
the
huge
industrial
and
military
machinery
of
defense
with
our
peaceful
methods
and
goals,
so
that
security
and
liberty
may
prosper
together.8
In
his
article,
Parks
argues
the
constitutional
framework
for
a
government
compelled
to
release
information
to
its
citizens:
“From
the
standpoint
of
the
principles
of
good
government
under
accepted
American
political
ideas,
there
can
be
little
question
but
that
open
government
and
information
availability
should
be
the
general
rule…”
and,
“It
is
reasonable
to
assert,
therefore,
that
only
a
limited
power
to
withhold
government
information
can
be
derived
from
Articles
I
and
II
of
the
Constitution
even
apart
from
the
Bill
of
Rights.”9
Of
course,
Parks’
argument
did
not
exist
in
a
vacuum.
There
were
(and
continue
to
be)
opponents
to
the
idea
that
government
must
be
open
with
its
information.
Even
proponents
of
open
government
occasionally
note
that
there
is
no
constitutionally
protected
“right
to
know.”10
It
is
with
this
background
that
Congress
passed
the
Freedom
of
Information
Act
(FOIA)
in
1966.
Initially,
FOIA
was
strongly
opposed
in
litigation
by
federal
agencies
and
7
Wallace
Parks.
Open
Government
Principle:
Applying
the
Right
to
Know
Under
the
Constitution.
George
Washington
Law
Review
(1957),
1.
8
James
Hagerty.
Text
of
the
Address
by
President
Eisenhower,
Broadcast
and
Televised
from
his
Office
in
the
White
House,
Tuesday
Evening,
January
17,
1961,
8:30
to
9:00
P.M.,
EST.
Press
Release,
January
17,
1961,
3.
9
Parks.
Open
Government
Principle:
Applying
the
Right
to
Know
Under
the
Constitution,
2.
10
Patricia
Wald,
The
Freedom
of
Information
Act:
A
Short
Case
Study
in
the
Perils
and
Paybacks
of
Legislating
Democratic
Values.
Emory
Law
Journal
(1984),
652.
10. 8
its
teeth
were
largely
removed.
As
Patricia
Wald
notes,
“one
might
almost
have
written
the
FOIA
off
as
a
paper
tiger.”11
In
1974,
with
America
still
reeling
from
the
Watergate
scandal,
Congress
passed
substantial
amendments
to
the
act.
Three
main
changes
to
the
structure
of
FOIA
included
time
limits
on
when
requests
had
to
be
responded
to,
authority
for
courts
to
examine
classification
of
information
as
“secret”,
and
limitations
on
an
exemption
for
documents
pertaining
to
criminal
investigations.12
These
changes
caused
such
a
dramatic
increase
in
requests
for
information
that
courts
routinely
excused
the
legal
time
limit
for
responding.13
Unfortunately,
the
1974
amendments
did
not
substantially
change
executive
resistance
to
providing
information
when
requested.
While
the
issue
of
electronic
records
was
very
briefly
mentioned
in
a
Senate
committee
report
on
the
amendments,
no
movement
was
made
to
anticipate
the
change
that
computers
would
bring.14
Over
time,
federal
agencies
were
able
to
avoid
providing
government
records
by
claiming
that
they
did
not
have
to
provide
records
that
were
in
an
electronic
format.15
Various
memoranda
and
legislative
acts
inched
the
government
further
and
further
into
a
world
where
computerized
information
was
the
norm
rather
than
the
exception.
In
1991,
11
Ibid.,
658.
12
Ibid.,
659.
13
Ibid.,
660.
14
Halstuk
and
Chamberlin.
Open
Government
in
the
Digital
Age:
The
Legislative
History
of
How
Congress
Established
a
Right
of
Public
Access
to
Electronic
Information
Held
by
Federal
Agencies,
56.
15
Ibid.,
48-‐49.
11. 9
Senator
Patrick
Leahy
(D-‐VT)
introduced
the
first
bill
to
update
FOIA
for
the
digital
age.16
This
and
other
attempts
would
ultimately
fail
until
the
Electronic
Freedom
of
Information
Act
(EFOIA)
of
1996.
The
most
important
change
in
the
EFOIA
amendment
was
the
establishment
of
a
definition
for
a
“record”
and
a
requirement
that
agencies
provide
records
in
electronic
format
if
available.17
As
noted
previously,
open
government
has
been
accorded
differing
levels
of
importance
throughout
history.
The
Carter
and
Clinton
administrations
proved
much
more
willing
to
release
government
information
than
the
Reagan
and
Bush
Sr.
Administrations.18
The
day
after
taking
office,
President
Obama
issued
a
memorandum,
entitled
Transparency
and
Open
Government,
in
which
he
extolled
what
he
saw
as
the
three
pillars
of
open
government:
transparency,
participation,
and
collaboration.19
This
memo,
along
with
a
follow-‐up
from
Office
of
Management
and
Budget
(OMB)
director
Peter
Orzag,
set
the
stage
for
an
open
government
that
embraced
new
technologies
and
the
sharing
of
open
government
data.20
2.2
History
of
Open
(Government)
Data
The
term
“Open
Data”
is
relatively
new,
having
only
appeared
for
the
first
time
in
1995.21
Nevertheless,
the
idea
that
it
encompasses
has
existed
for
much
longer.
In
16
Ibid.,
53.
17
Ibid.
18
Ibid.,
53-‐54.
19
Barack
Obama.
Transparency
and
Open
Government.
Whitehouse.gov,
2009.
20
Peter
Orszag.
Open
Government
Directive,
2009.
21
Simon
Chignard.
A
Brief
History
of
Open
Data.
ParisTech
Review,
2013.
12. 10
1942,
Robert
King
Merton
described
his
set
of
“Mertonian
Norms”
for
the
pursuit
of
science,
in
which
he
proclaimed
that
the
results
of
scientific
endeavor
should
be
subject
to
“communism”
or
lack
of
ownership.22
The
idea
that
the
results
of
science
should
be
owned
by
no
one
but
society
was
unique
in
its
time,
and
remains
so
today.
Merton’s
essay
is
the
first
major
mention
of
such
an
idea,
but
his
idea
would
have
endurance,
eventually
becoming
the
philosophical
basis
for
open
data
generally,
and
open
government
data
by
association.23
Similar
philosophies
followed
suit
as
computers
came
into
the
public
consciousness.
Today,
there
are
numerous
open-‐source
licensing
initiatives
for
software
and
content,
including
the
GNU
General
Public
License
(GPL),
Mozilla
Public
License,
Creative
Commons,
and
many
others.
Finding
a
history
of
the
term,
open
government
data,
has
proven
elusive,
though
it
is
likely
not
to
be
older
than
the
broader
term,
open
data.
As
early
as
2007,
the
idea
of
open
data
in
government
was
discussed.
That
year,
a
conference
of
influential
individuals
and
activists
in
the
broader
open
source
and
open
culture
movements
was
held
in
Sebastopol,
CA.
This
conference
would
become
a
defining
moment
(literally)
for
the
OGD
movement
as
the
participants
drafted
the
first
definition
of
OGD.24
Cities,
and
to
a
lesser
extent
states,
have
joined
the
movement
to
voluntarily
release
datasets
into
the
public
domain.
Data.gov
lists
38
states
and
46
cities
with
some
22
Robert
Merton.
The
Normative
Structure
of
Science.
In
The
Sociology
of
Science:
Theoretical
and
Empirical
Investigations,
1973[1942].
23
Chignard.
A
Brief
History
of
Open
Data.
24
Carl
Malamud.
Open
Government
Working
Group
Meeting
in
Sebastopol,
CA.
2007.
13. 11
form
of
OGD,
while
the
Open
Knowledge
Foundation
lists
70
U.S.
cities.25,
26
Portland,
OR
passed
the
first
law
related
to
OGD
in
September
2009,
although
it
(and
other
cities)
had
OGD
programs
running
well
before
that.27
Perhaps
the
first
prototype
of
modern
municipal
OGD
comes
from
Baltimore’s
CityStat,
a
2003
policy
initiative
of
then-‐Mayor
Martin
O’Malley
to
highlight
statistics
about
how
well
or
poorly
the
City
of
Baltimore
was
doing
in
certain
policy
areas.
CityStat
would
eventually
beget
StateStat
for
the
state
of
Maryland
when
O’Malley
became
governor,
and
StateStat
would
be
copied
in
numerous
other
jurisdictions.28
The
major
catalyst
for
federal
release
of
open
data
was
the
Obama
administration’s
2009
Open
Government
Directive.29
In
this
directive,
OMB
director
Peter
Orzag
required
agencies
to
publish
government
information
online;
specifically
“Within
45
days
[of
8
December
2009],
each
agency
shall
identify
and
publish
online
in
an
open
format
at
least
three
high-‐value
data
sets…”30
These
datasets
provided
the
basis
for
data.gov,
a
would-‐be
clearinghouse
for
federal,
state,
and
municipal
OGD.
Finally,
players
in
every
level
of
government
in
the
United
States
were
making
substantial
efforts
to
release
OGD.
25
Open
Government.
Data.gov.
26
US
City
Open
Data
Census.
2014.
27
Rick
Turoczy.
Mayor
Sam
Adams
and
the
City
of
Portland
to
Open
Source,
Open
Data,
and
Transparency
Communities:
Let’s
Make
this
Official.
Silicon
Florist,
2009.
28
Tauberer.
History
of
the
Movement.
In
Open
Government
Data:
The
Book,
2014.
29
Ibid.
30
Orszag.
Open
Government
Directive,
2009.
14. 12
2.3
Principles
of
Open
Government
Data
Open
Government
Data
holds
a
unique
place
in
the
world
of
government
transparency.
It
represents
the
first
time
that
government
has
willingly
released
bulk
data
to
citizens
without
their
asking
first.
There
are
many
attempts
to
create
a
definition
of
OGD,
and
many
of
those
attempts
share
similar
characteristics.
In
2005,
the
Open
Knowledge
Foundation
created
the
website
Open
Definition,
on
which
it
posted
the
first
attempt
at
defining
open
data
broadly
(rather
than
OGD
specifically).
This
definition
borrowed
heavily
from
terms
and
definitions
that
were
already
used
in
the
open
source
software
movement.31
This
Open
Definition
v1.0
identified
11
conditions
which
must
have
been
satisfied
in
order
for
information
to
be
considered
“open”:
Access,
Redistribution,
Reuse,
Absence
of
Technological
Restriction,
Attribution,
Integrity,
No
Discrimination
Against
Persons
or
Groups,
No
Discrimination
Against
Fields
of
Endeavor,
Distribution
of
License,
License
Must
Not
Be
Specific
to
a
Package,
License
Must
Not
Restrict
the
Dissemination
of
Other
Works.
Over
time,
some
of
these
conditions
have
changed
or
been
consolidated
by
others.
The
current
version
of
the
Open
Definition,
v2.0,
consolidates
everything
down
to
two
main
principles:
Open
Works
and
Open
Licenses.
This
is
slightly
misleading,
as
there
are
still
21
subsections
with
specific
requirements.32
Nevertheless,
substantial
change
to
the
original
11
conditions
has
occurred.
The
first
attempt
at
defining
Open
Government
Data
comes
from
the
influential
31
About.
in
Open
Definition.
Available
from
http://opendefinition.org/about/.
32
Open
Definition:
Version
2.0.
in
Open
Definition.
15. 13
Sebastopol
conference
in
2007.
This
conference,
building
off
the
Open
Definition
1.0,
identified
eight
principles
of
OGD.
According
to
the
work
of
conference
attendants,
OGD
must
be:
Complete,
Primary,
Timely,
Accessible,
Machine
Processable,
Non-‐
discriminatory,
Non-‐proprietary,
and
License-‐free.33
There
are
numerous
other
definitions
of
Open
Data,
including
the
Open
Data
Handbook
and
Open
Government
Data:
The
Book
(both
free
online).34,
35
The
Sunlight
Foundation
has
been
a
major
force
in
open
government
data
since
its
founding
in
2006.
In
2010,
Sunlight
released
10
Principles
for
Opening
Up
Government
Data.
In
it,
Sunlight
builds
on
the
eight
principles
set
forth
in
Sebastopol
to
create
the
following
10
principles:
Completeness,
Primacy,
Timeliness,
Ease
of
Physical
and
Electronic
Access,
Machine
Readability,
Non-‐discrimination,
Use
of
Commonly
Owned
Standards,
Licensing,
Permanence,
and
Usage
Costs.36
This
study
uses
the
Sunlight
Foundation’s
principles
as
the
general
guide
in
evaluating
OGD.
As
such,
each
of
these
principles
briefly
deserves
further
inspection.
Completeness
refers
to
both
the
dataset
and
the
larger
collection.
Sunlight
refers
to
completeness
on
the
dataset
level,
meaning
that
when
a
dataset
is
released,
it
should
be
the
entirety
of
the
original
dataset
(within
reasonable
bounds
of
privacy
and
security).37
Sebastopol
participants
imagined
completeness
related
to
having
a
complete
33
Tauberer,
Joshua.
The
Annotated
8
Principles
of
Open
Government
Data.
34
Daniel
Dietrich,
et
al.
What
is
Open
Data.
In
Open
Data
Handbook,
2012.
35
Tauberer.
14
Principles
of
Open
Government
Data.
36
John
Wonderlich.
Ten
Principles
for
Opening
Up
Government
Information.
Sunlight
Foundation.
2010.
37
Ibid.
16. 14
collection
of
datasets
available
(i.e.,
of
the
set
of
all
datasets
appropriate
for
public
release,
all
have
been
made
publically
available).38
Both
of
these
ideas
of
completeness
are
important
for
an
OGD
program.
Primacy
is
the
principle
that
released
data
should
be
raw,
original
data
as
used
by
the
agency
releasing
it.39
It
is
identical
to
the
“primary”
principle
from
Sebastopol.
It
is
tempered
by
a
reasonable
regard
for
the
privacy
of
citizens
and
security
of
the
state.
To
release
full
information
on
every
police
call,
including
who
made
the
call
and
their
contact
information
would
be
a
reckless
disregard
for
the
privacy
and
safety
of
people
who
use
the
police
force.
However,
the
bulk
of
data
on
an
arrest
can
be
released,
including
locations
and
who
was
arrested.
This
principle
requires
balancing
of
the
public’s
“right
to
know”
and
the
individual’s
right
to
privacy
insofar
as
they
have
one.
Timeliness
is
the
principle
that
data
is
often
best
when
it
is
fresh
and
relevant
to
current
events.40
Police
data
from
five
years
ago
is
less
relevant
to
the
average
citizen
than
police
data
from
five
minutes
ago.
Ease
of
Physical
and
Electronic
Access
refers
to
making
the
datasets
available
for
bulk
download
(i.e.,
the
data
does
not
have
to
be
queried
one
element
at
a
time)
in
a
manner
that
is
easy
for
users
to
find.41
Specifically,
users
should
not
have
to
visit
a
physical
place
(like
an
office)
to
receive
the
data
and
they
should
not
have
to
submit
any
paperwork
(like
a
FOIA
request)
to
obtain
it.
38
Tauberer.
The
Annotated
8
Principles
of
Open
Government
Data.
39
Wonderlich.
Ten
Principles
for
Opening
Up
Government
Information.
40
Ibid.
41
Ibid.
17. 15
Machine
Readability
means
that
computer
software
should
be
able
to
access
the
content
of
the
data
easily.
Pre-‐written
reports,
PDFs,
and
images
are
generally
not
considered
“open
data.”
Machines
cannot
easily
manipulate
the
content.
Formats
such
as
XLS,
CSV,
JSON,
etc.
are
considered
machine-‐readable.
Aaron
Swartz
preferred
to
call
this
“machine
processable”
because
even
formats
like
PDF
and
DOCX
can
be
“read”
by
the
machine
to
render
them
on
monitors.42
Increasingly,
this
means
using
Application
Programming
Interfaces
(APIs)
for
real-‐time
access
to
data
updates.
While
most
open
data
definitions
do
not
require
the
use
of
APIs,
and
small
minority
datasets
do
not
make
sense
to
include
in
an
API,
the
industry
is
moving
towards
their
use
for
those
datasets
for
which
they
do
make
sense.
Non-‐discrimination
means
that
the
data
should
be
available
to
anyone,
anywhere,
for
any
reason
whatsoever.
Users
of
the
data
should
not
have
to
register
an
account,
or
make
their
use
of
the
data
known
to
anyone
or
anything
other
than
the
machine
from
which
they
are
pulling
the
data.43
This
idea
could
be
stated
another
way
as
“anonymity.”
The
person
using
the
data
should
have
the
option
to
interact
with
the
data
in
a
completely
anonymous
way
unless
they
choose
to
reveal
themselves.
Use
of
Commonly
Owned
Standards
means
making
data
available
in
at
least
one
format
that
does
not
require
proprietary
software
to
open.
There
are
degrees
of
compliance
with
this
principle.44
An
ideal
example
would
be
CSV,
which
can
be
opened
42
Tauberer.
Analyzable
Data
in
Open
Formats
(Principles
5
and
7).
2014.
43
Wonderlich.
Ten
Principles
for
Opening
Up
Government
Information.
44
Ibid.
18. 16
by
any
text
editor.
XLS,
which
is
a
proprietary
format
technically
owned
by
Microsoft,
is
such
a
common
format
that
it
is
often
how
data
is
presented
to
the
public
and
might
be
considered
open
enough
(especially
since
it
can
be
accessed
by
the
free
software
Apache
OpenOffice
or
LibreOffice).
However,
the
worst
offender
would
be
a
file
type
that
cannot
be
opened
at
all
except
by
a
vendor-‐specific
piece
of
software
that
costs
money.
The
DWG
format
(specific
to
AutoCAD)
is
an
example
of
such
a
format.
Ideally,
users
should
be
able
to
choose
the
format
that
works
best
for
them
in
order
to
facilitate
access.
Licensing
are
the
conditions,
or
terms
of
use,
by
which
users
can
access
or
use
data.
In
an
OGD
setting,
data
should
be
released
into
the
public
domain
without
any
restrictions
on
its
use.
Some
organizations
(especially
private
ones)
require
attribution
or
that
anything
made
with
their
data
be
subject
to
the
same
licenses.
This
is
inappropriate
for
OGD
because
of
the
public
nature
of
government.45
Permanence
means
that
the
data
should
be
available
in
the
same
place
indefinitely.46
A
common
problem
that
users
have
is
bookmarking
a
page
and
then
coming
back
later
to
find
that
the
link
is
broken.
Data
should
be
available
at
the
same
links
and
in
the
same
areas
for
as
long
as
possible.
Any
changes
to
the
link
structure
of
the
website
should
continue
to
support
the
old
links
as
well
as
the
new.
45
Wonderlich.
Ten
Principles
for
Opening
Up
Government
Information.
46
Tauberer.
The
Annotated
8
Principles
of
Open
Government
Data.
19. 17
Usage
Costs
is
the
final
principle
of
OGD;
it
is
the
requirement
to
keep
the
cost
of
using
the
data
as
low
as
possible
(preferably
free).
Sunlight
notes
that
even
de
minimis
cost
structures
can
discourage
or
prevent
use
of
open
data.47
While
these
10
principles
generally
encompass
what
most
people
believe
to
be
a
definition
of
open
data,
different
organizations
add,
subtract,
and
alter
these
in
significant
ways.
Opengovdata.org
specifically
highlights
that
data
should
be
online,
while
Sunlight
seems
to
assume
it
of
the
data.
They
also
add
Trusted,
Presumption
of
Openness,
Documented
(e.g.
metadata),
Safe
to
Open,
and
Designed
with
Public
Input.48
Open
Government
Data:
The
Book
slices
the
10
principles
in
different
ways,
also
emphasizing
that
the
public
should
have
“input,
review,
and
coordination”
related
to
OGD.49
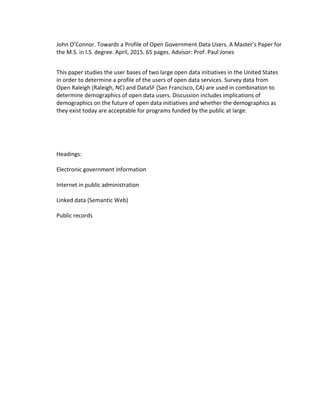
2.4
Future
of
Open
Government
Data
Claiming
to
know
the
future
of
anything,
especially
in
technology,
is
for
fools
and
mystics.
Nevertheless,
there
are
certain
trends
in
the
OGD
space
that
hint
of
where
the
movement
may
be
going.
Gartner
Research,
a
leader
in
technology
analysis
and
consulting,
famously
studies
where
different
trends
lie
in
the
“Hype
Cycle”;
a
peak,
trough,
and
plateau
graph
of
the
expected
utility
of
technological
innovations.
OGD
is
firmly
on
the
slope
47
Wonderlich.
Ten
Principles
for
Opening
Up
Government
Information.
48
Tauberer.
The
Annotated
8
Principles
of
Open
Government
Data.
49
Joshua
Tauberer.
On
the
Openness
Process
(Public
Input,
Public
Review,
and
Coordination;
Principles
12–14).
2014.
20. 18
downward
into
the
“trough
of
disillusionment”
(see
fig.
1),
which
means
that
support
for
OGD
programs
is
also
lagging.
Gartner
researcher
Rick
Howard
notes
that,
Continued
pressure
to
reduce
budgets
may
negatively
affect
the
funding
needed
to
sustain
open
data
initiatives.
To
date,
the
main
beneficiaries
remain
activists
and
advocacy
groups
interested
in
how
government
performs,
and
citizens
with
the
substantial
skills
and
interest
needed
to
develop
open
data
applications.50
Even
still,
Gartner
rates
OGD
as
having
a
“high”
potential
benefit
and
only
5-‐20%
of
the
potential
market
has
invested
in
this
trend.51
Gartner
researchers
also
identify
numerous
other
trends
related
to
OGD
somewhere
on
the
downslope
of
the
hype
cycle.
Trends
include
“Citizen
Developers”
(top
of
the
Peak
of
Inflated
Expectations)
and
“Open
Any
Data
in
Government”/”Open
by
Default”
(near
the
Bottom
of
the
Trough
of
Disillusionment).52,
53
The
OGD
community
seems
to
have
keyed
into
the
idea
of
the
Semantic
Web
as
the
future
of
OGD,
perhaps
because
it
is
one
of
the
most
tangible
visions
of
the
future
of
the
web.
Briefly,
the
Semantic
Web
focuses
on
making
heterogeneous
data
structures
able
to
interact
with
each
other
by
placing
those
structures
into
the
same
descriptive
framework.
This
allows
users
to
query
data
not
just
from
within
one
organization’s
datasets,
but
across
multiple
organizations,
without
those
organizations
having
to
50
Rick
Howard
and
Andrea
Di
Maio.
2013.
Hype
Cycle
for
Smart
Government,
2013.
Gartner,
Inc.,
G00249302,
45-‐46.
51
Ibid.,
47.
52
Ibid.,
7.
53
Neville
Cannon
and
Rick
Howard.
2014.
Hype
Cycle
for
Digital
Government,
2014.
Gartner,
Inc.,
G00249302,
8.
21. 19
coordinate
with
each
other.54
The
OGD
community
has
embraced
the
vision
of,
and
is
a
significant
driver
of
growth
in,
the
Semantic
Web.
Both
the
United
States
(data.gov)
and
the
UK
(data.gov.uk)
have
communities
devoted
to
converting
OGD
datasets
into
Semantic
Web
compliant
(RDF
format)
datasets.
As
of
2013,
governments
provided
nearly
one
sixth
of
the
data
available
on
the
Semantic
Web.55
Gartner,
for
its
part,
has
placed
the
Semantic
Web
at
nearly
the
exact
same
position
in
the
hype
cycle
as
it
has
placed
OGD
(see
fig.
2).56
Gartner
researchers
predict
that
OGD
will
hit
the
Plateau
of
Productivity
within
2-‐5
years
of
their
2013
report,
and
that
the
Semantic
Web
is
somewhere
between
five
and
ten
years
away
from
the
Plateau
in
its
2014
report.57
OGD
provides
an
excellent
opportunity
to
ignite
the
Semantic
Web,
and
it
seems
that
many
OGD
and
Semantic
Web
researchers
are
pushing
for
just
that.
Overall,
OGD
has
many
opportunities
to
influence
the
future
of
government,
the
economy,
and
the
Internet
as
we
know
it.
In
order
to
tap
this
potential,
OGD
programs
need
to
know
who
their
audience
is
and,
more
importantly,
who
their
audience
is
not.
54
Nigel
Shadbolt
et
al.
2011.
eGovernment.
In
Handbook
of
Semantic
Web
Technologies,
Berlin:
Springer-‐
Verlag,
841-‐842.
55
Nigel
Shadbolt
and
Kieron
O'Hara.
2013.
Linked
Data
in
Government.
Internet
Computing,
IEEE
17
(4),
75.
56
Gene
Phifer.
2014.
Hype
Cycle
for
Web
Computing,
2014.
Gartner,
Inc.,
G00263878,
7.
57
Ibid.
22. 1
Figure
1.
Gartner
Hype
Cycle
for
Smart
Government,
2013
(highlighting
added)58
58
Howard
and
Di
Maio.
2013.
Hype
Cycle
for
Smart
Government,
2013,
7.
20
23. 21
Figure
2.
Gartner
Hype
Cycle
for
Web
Computing,
2014
(highlighting
added)59
59
Gene
Phifer.
Hype
Cycle
for
Web
Computing,
2014,
7.
21
24. 22
3
Methods
3.1
Data
Collection
This
study
attempts
to
build
a
profile
of
an
“average”
OGD
user
based
on
information
from
two
major
OGD
programs
across
the
US:
Open
Raleigh
(Raleigh,
NC)
and
DataSF
(San
Francisco,
CA).
These
programs
were
chosen
for
their
size
and
reputation
within
the
community.
Other
programs
contacted
include
Open
Data
Philly
(Philadelphia,
PA),
NYC
Open
Data
(New
York,
NY),
Data
Boston
(Boston,
MA),
and
OpenData.gov
(federal).
None
of
these
other
programs
were
willing
or
able
to
provide
data.
Open
Data
Philly
is
no
longer
has
any
staff
support
and
the
open
data
portal
exists
as-‐is
for
the
foreseeable
future.
NYC
Open
Data
and
Data
Boston
did
not
collect
demographic
information,
and
were
not
interested
in
creating
a
survey
to
learn
more.
Finally,
OpenData.gov
claimed
it
had
user
demographics
and
use
data
that
they
were
willing
to
share,
but
repeated
attempts
to
obtain
that
data
were
ignored.
Data
for
this
project
will
come
from
two
different
sources:
surveys
and
analytics.
3.1.1
Surveys
The
City
of
Raleigh
recently
completed
a
user
survey
of
OGD
users
that
collected
information
including
demographics
and
use
patterns
of
Open
Raleigh.
This
survey
ran
from
March-‐October
2014,
and
was
promoted
on
the
Open
Raleigh
homepage,
as
well
25. 23
as
through
Twitter.
A
list
of
the
survey
questions
from
the
Open
Raleigh
user
survey
is
included
in
Appendix
A.
The
City
of
San
Francisco
also
recently
completed
a
survey
of
users.
DataSF
has
shared
an
anonymized
version
of
the
data
collected
from
their
survey.
A
list
of
survey
questions
for
the
DataSF
survey
is
included
in
Appendix
B.
3.1.2
Analytics
Open
Raleigh
uses
Google
Analytics
to
track
acquisition
(how
users
come
to
the
site),
behavior
(what
users
do
and
where
they
go
once
they
are
on
the
site),
and
a
few
demographics
(male
vs.
female
and
age).
DataSF
does
not
use
Google
Analytics,
but
makes
some
metadata
about
their
site
available
(such
as
popular
datasets,
search
terms,
etc.).
In
building
a
holistic
profile
of
how
an
OGD
user
looks
and
acts,
as
well
as
what
their
goals
are,
these
pieces
of
information
still
provide
useful
insight.
Using
analytics
in
combination
with
user
surveys
will
provides
a
much
more
reliable
profile
of
OGD
users.
Surveys
are
limited
in
their
ability
to
show
the
“average”
user
because
the
“average”
user
might
not
be
the
type
that
answers
surveys.
Analytics
can
fill
in
the
gaps
of
a
survey
by
collecting
limited
amounts
of
data
on
every
user
that
comes
to
a
site.
3.2
Data
Analysis
The
response
rates
for
user
surveys
are
low
enough
that
hand
coding
of
different
responses
to
match
each
other
where
appropriate
is
possible.
For
example,
both
26. 24
surveys
ask
how
users
want
to
make
use
of
the
platform,
but
give
slightly
different,
but
similar,
answers.
These
two
different
types
of
questions
ultimately
try
to
get
to
the
same
information:
what
users
are
doing
with
the
data.
This
study
chooses
one
single
way
of
representing
that
information
and
codes
the
non-‐conforming
questions
to
that
way.
Similar
issues
arise
for
demographic
questions
where
questions
about
race,
gender,
profession,
education,
etc.
are
all
asked
in
different
ways.
27. 25
4
Analysis
of
Open
Raleigh
(Raleigh,
NC)
4.1
Introduction
From
Feb.
22
to
Oct.
31,
Open
Raleigh
conducted
a
user
survey
to
learn
more
about
what
those
users
looked
like
and
how
they
used
Open
Raleigh’s
data.
The
survey
was
comprised
of
between
two
and
14
questions,
depending
on
previous
answers.
It
received
104
total
responses,
with
63
of
those
responses
completing
the
survey
in
its
entirety.
Open
Raleigh
logged
more
than
1,000,000
page
views
and
over
7,000,000
rows
of
data
loaded
in
the
time
that
the
survey
was
live.
4.2
Acquisition
The
most
common
ways
for
people
to
learn
about
Open
Raleigh
was
through
word
of
mouth
and
Twitter.60
For
those
who
chose
“Other”
the
most
common
responses
were
through
MeetUp
events
and
links
from
the
City
of
Raleigh
website.
Interestingly,
the
social
media
site
with
the
largest
user
base,
Facebook,
is
by
far
the
smallest
source
of
discovery
for
Open
Raleigh.
This
reveals
an
opportunity
for
Open
Raleigh
to
engage
with
a
potentially
different
segment
of
the
population
than
is
normally
served
through
events
focused
on
“civic
hacking”
and
Twitter,
as
have
been
60
See
Figure
3,
P.
31
28. 26
the
main
methods
of
advertising
to
this
point.
Facebook
users
are
more
likely
to
be
“average”
citizens,
rather
than
those
who
are
civically
inclined
(i.e.
those
following
Twitter
accounts
or
going
to
the
type
of
events
that
would
introduce
them
to
Open
Raleigh).
Nevertheless,
a
certain
amount
of
civic
activism
is
present
among
those
who
use
Open
Raleigh
regardless
of
their
data
analytics
or
programming
skills.61
4.3
Use
Those
who
use
Open
Raleigh
directly
(i.e.
not
through
a
third-‐party
application)
have
a
broad
range
of
interests.
How
users
view
Open
Raleigh
speaks
to
their
motivations
when
coming
to
the
site.
Most
users
believe
that
Open
Raleigh
represents
an
effort
by
the
City
of
Raleigh
to
improve
transparency
and
accessibility.62
Those
who
believe
that
Open
Raleigh
is
about
neither
of
those
issues
took
decidedly
more
pessimistic
views
of
Open
Raleigh
and
Raleigh
government
in
general
(“Raleigh
is
politically
twisted
and
stuck
way
in
the
past.
Missed
the
boat
a
long
time
ago-‐see
Charlotte.”).
Those
who
do
use
Open
Raleigh
either
download
individual
datasets
through
the
web
interface
or
have
the
programming
skills
to
make
use
of
the
API.
Most
of
the
respondents
had
simply
come
to
the
Open
Raleigh
web
portal
and
downloaded
a
dataset
to
browse.
Only
a
few
people
reported
using
Open
Raleigh
multiple
times,
and
61
See
Figure
4,
P.
31
62
See
Figure
5,
P.
31
29. 27
those
also
tended
to
be
ones
who
downloaded
many
datasets.
The
typical
use
pattern
that
emerges
here
is
that
people
hear
about
Open
Raleigh,
come
to
the
site,
download
a
dataset,
and
then
never
return
to
the
site
(or
return
a
couple
more
times
before
leaving
permanently).
This
use
pattern
goes
hand
in
hand
with
the
larger
issue
that
Open
Government
Data
programs
have
of
attracting
“average
citizen”
users
in
a
meaningful
way.
The
majority
(53%)
of
respondents
seem
to
be
using
Open
Raleigh
datasets
“Just
to
Browse.”63
Uses
beyond
general
browsing
(curiosity)
seem
to
equally
spread
between
academic
research,
making
different
kinds
of
applications,
and
“other”
uses.
When
asked
whether
there
are
more
datasets
they
would
like
to
see
on
Open
Raleigh,
most
respondents
indicated
that
they
were
happy
with
the
data
already
available.64
Of
the
20%
of
people
who
indicated
they
would
like
to
see
new
and
different
datasets,
the
majority
of
their
comments
indicated
a
lack
of
knowledge
about
datasets
already
in
the
Open
Raleigh
catalog.
This
could
indicate
either
lack
of
willingness
to
search
of
these
datasets,
or
(more
likely)
the
same
issue
of
user
unfriendliness
discussed
previously.
Overall,
survey
respondents
indicated
that
they
would
like
to
see
an
improved
user
interface.
Specific
suggestions
included,
“the
maps
are
too
small”,
“it's
difficult
to
find
datasets”,
“make
this
relevant
to
an
average
citizen”,
“it's
clunky
and
of
limited
use”,
and
“I
don't
want
to
have
to
sign
up
for
a
[S]ocrata
account…just
to
be
able
to
63
See
Figure
6,
P.
32
64
See
Figure
9,
P.
33
30. 28
submit
an
idea
for
a
new
dataset.”
These
are
largely
issues
with
the
Socrata
software.
One
suggestion,
“I
would
like
to
see
a
gallery
of
apps
or
data
to
inspire
me
when
I
first
access
the
site,”
is
a
change
that
Open
Raleigh
itself
can
make
and
would
go
a
long
way
to
improving
the
connection
to
the
average
citizen.
4.4
Demographics
In
many
ways,
Open
Raleigh
follows
larger
demographic
trends
of
those
who
work
in
technology
industries.65
Open
Raleigh
users
are
largely
white,
educated,
and
working-‐
age
(25-‐55).
However,
Raleigh
breaks
the
gender
mold
in
an
important
way
–
the
split
between
men
(53%)
and
women
(42%)
using
the
service
is
fairly
even.66
Compared
to
most
technology
companies,
the
employee
gender
split
is
closer
to
70%
male
to
30%
female.
Open
Raleigh
is
doing
an
outstanding
job
of
attracting
female
users.
Reasons
for
this
are
unclear,
but
may
be
impacted
by
the
support
that
Open
Raleigh
enjoys
from
Gail
Roper,
Raleigh’s
(female)
Chief
Information
Officer.
Because
many
of
Open
Raleigh’s
users
are
data
analysts
or
tech
savvy
people
that
make
things
for
public
consumption
with
Open
Raleigh
data,
the
core
users
act
more
as
employees
than
customers.
This
is
reflected
in
Open
Raleigh’s
occupational
breakdown
–
the
plurality
of
users
being
from
the
computer
and
mathematical
65
Carmel
DeAmicis
and
Biz
Carson.
"Eight
Charts
That
Put
Tech
Companies'
Diversity
Stats
into
Perspective."
Gigaom.
August
21,
2014.
Accessed
January
13,
2015.
https://gigaom.com/2014/08/21/eight-‐charts-‐that-‐put-‐tech-‐companies-‐diversity-‐stats-‐into-‐perspective/.
66
See
Figure
10,
P.
33
31. 29
industry.67
Those
who
answered
“Other”
tended
to
list
some
form
of
“government”
as
their
occupation,
indicating
nothing
about
what
they
do
for
the
government
(which
is
an
employer
rather
than
an
industry).
Whites
make
up
nearly
60%
of
both
the
Open
Raleigh
user
base
and
the
City
of
Raleigh
population
generally.68,69
However,
while
nearly
30%
of
Raleigh
citizens
are
black,
only
10%
of
Open
Raleigh
users
identified
that
way.
Although
black
employees
make
up
approximately
7%
of
the
technology
industry,
Open
Raleigh
should
specifically
work
to
improve
outreach
in
the
black
community.
Reaching
back
to
the
suggestion
of
“mak[ing]
this
relevant
to
the
average
citizen”,
Open
Raleigh’s
user
base
should
attempt
to
mirror
Raleigh’s
citizenry.
Other
ethnicities
are
represented
similarly
to
their
population
in
Raleigh,
suggesting
that
only
the
black
population
is
underserved.
Age
distribution
of
Open
Raleigh
users
is
generally
similar
to
that
of
Raleigh
Citizens.
A
cluster
around
ages
25-‐54
(working-‐age)
is
what
one
would
expect.70
The
bulk
of
Raleigh’s
population
ranges
from
20-‐54
as
well.
Of
particular
note
is
that
there
were
no
respondents
under
the
age
of
18.
Young
people,
especially
those
in
high
school,
have
the
ability
to
substantially
contribute
to
Open
Raleigh
by
working
on
projects
or
suggesting
unique
ideas
for
products
using
data
from
Open
Raleigh.
High-‐school-‐aged
citizens
may
be
able
to
put
more
sustained
work
into
a
project
than
a
working-‐age
adult
and
be
willing
to
do
so
in
exchange
for
experience
and
good
professional
contacts.
67
See
Figure
11,
P.
33
68
See
Figure
12,
P.
34
69
"Raleigh
Demographics."
City
of
Raleigh.
September
23,
2014.
Accessed
January
13,
2015.
http://www.raleighnc.gov/government/content/PlanDev/Articles/LongRange/RaleighDemographics.html.
70
See
Figure
13,
P.
34
32. 30
As
one
would
expect,
the
majority
of
Open
Raleigh
users
(over
80%)
have
some
sort
of
post-‐secondary
education.71
This
is
significantly
higher
than
the
City
of
Raleigh
itself,
in
which
only
47%
have
a
bachelor
degree
or
higher.
Again,
this
demonstrates
that
Open
Raleigh
(and
open
data
broadly)
is
more
accessible
to
those
with
the
prerequisite
education
to
understand
how
to
manipulate
data.
Finally,
and
perhaps
most
interestingly,
only
about
60%
of
respondents
were
citizens
of
Raleigh.72
Unfortunately,
this
survey
did
not
follow
up
with
those
who
did
not
live
in
Raleigh
to
find
out
their
places
of
residence.
However,
it
speaks
to
the
general
popularity
and
notoriety
of
Open
Raleigh
outside
of
the
city
(and
possibly
beyond
the
Triangle).
4.5
Conclusion
Open
Raleigh
is
a
strong
Open
data
program,
but
shows
many
of
the
same
weaknesses
of
open
data
programs
generally.
These
include
a
lack
of
relevance
to
the
“average
citizen”
coupled
with
a
high
barrier
for
entry.
Some
of
this
is
due
to
the
use
of
Socrata
as
the
platform
for
hosting
the
data.
While
Socrata
is
an
industry
leader
in
turnkey
open
data
platforms,
its
lack
of
focus
on
user
interface
makes
Open
Raleigh
inaccessible
to
the
average
citizen.
Ways
that
Open
Raleigh
can
attempt
to
improve
on
this
include
creating
a
gallery
of
average
citizen
friendly
apps
as
they
are
created
and
increasing
outreach
to
underrepresented
populations.
71
See
Figure
14,
P.
35
72
See
Figure
15,
P.
35
33. 31
4.6
Open
Raleigh
Figures
Figure
3
Figure
4
Figure
5
0
10
20
30
40
Percent
How
Did
You
Learn
About
Open
Raleigh?
0
20
40
60
80
100
Yes
No
Percent
Are
You
Interested
in
Civic
AcGvism?
0
20
40
60
80
Percent
Do
you
think
Open
Raleigh
is
about:
34. 32
Figure
6
Figure
7
Figure
8
0
20
40
60
Once
2-‐5
6-‐10
11-‐20
21+
Percent
How
Many
Times
Have
You
Used
Open
Raleigh?
0
50
100
0
1-‐5
6-‐10
11-‐20
21-‐50
51+
No.
of
Responses
How
Many
Times
Have
You
Downloaded
A
Data
Set
From
Open
Raleigh?
0
10
20
30
40
50
60
Percent
How
Have
You
Used
The
Data
Set
You
Downloaded
From
Open
Raleigh?
35. 33
Figure
9
Figure
10
Figure
11
0
20
40
60
80
100
No
Yes
Percent
Are
There
Any
Data
Sets
That
You
Would
Like
To
See
On
Open
Raleigh?
0
10
20
30
40
50
60
Male
Female
Other
Percent
What
Is
Your
Gender?
0
5
10
15
20
25
30
35
40
Percent
What
Is
Your
OccupaGon?
36. 34
Figure
12
Figure
13
0
10
20
30
40
50
60
70
Percent
What
Is
Your
Ethnicity
Origin
or
Race?
0
5
10
15
20
25
30
Under
18
18-‐24
25-‐34
35-‐44
45-‐54
55-‐64
65-‐74
75+
Percent
What
Is
Your
Age?
37. 35
Figure
14
Figure
15
0
5
10
15
20
25
30
35
40
Percent
What
Is
The
Highest
Level
Of
School
You
Have
Completed
Or
The
Highest
Degree
You
Have
Received?
0
20
40
60
80
Yes
No
Percent
Do
You
Live
In
Raleigh?
38. 36
5
Analysis
of
DataSF
(San
Francisco,
CA)
5.1
Introduction
The
City
of
San
Francisco,
CA
conducted
a
user
survey
in
mid-‐2014
by
publishing
a
link
to
the
survey
on
their
website.
DataSF
administrators
were
willing
to
provide
only
some
of
the
questions
in
an
anonymous
format.
Unlike
Open
Raleigh’s
survey,
the
DataSF
survey
only
received
17
responses,
making
the
data
gleaned
from
it
more
on
the
level
of
a
structured
focus
group
rather
than
a
large-‐scale
survey
of
users.
During
2014,
DataSF
received
more
than
12,000,000
page
views
and
loaded
more
than
one
billion
rows
of
data.
The
discrepancy
between
the
number
of
responses
and
the
number
of
page
views
makes
any
meaningful
conclusions
dubious
at
best.
Nevertheless,
DataSF
shows
some
interesting
characteristics.
5.2
Use
DataSF
asked
two
questions
related
to
use
of
the
service.
The
first
one,
“What
do
you
think
is
the
purpose
of
DataSF?”,
allowed
free
form
answers.
Despite
that,
each
answer
could
generally
be
categorized
into
improving
“Data
Accessibility”,
“Transparency”,
or
“Both”.
Overall,
54%
of
respondents
(seven
people)
felt
that
39. 37
DataSF’s
goal
was
to
improve
access
to
government
data,
38%
(five
people)
to
improve
transparency,
and
8%
(one
person)
thought
both
were
equally
the
goal.73
The
majority
of
respondents
reported
using
DataSF
to
“Find
Information
About
The
City”
and
“To
Download
And
Analyze
Data.”74
The
question
allowed
users
to
select
as
many
of
the
potential
answer
options
as
they
felt
were
appropriate.
This
suggests
that
many
of
DataSF’s
users
come
to
the
site
looking
for
a
specific
dataset
that
they
then
download
and
interact
with
for
their
own
unique
purpose.
Approximately
41%
of
respondents
(10
people)
interact
with
the
data
to
create
end-‐user
products
that
can
benefit
other
citizens
that
do
not
have
data
analytics
or
programming
skills
(“To
Create
Data
Visualizations”,
“To
Build
Web
or
Mobile
Applications”,
and/or
“Research”).
However,
given
the
small
response
rate
to
this
survey
and
the
probability
that
heavy
users
are
more
likely
to
fill
the
survey
out,
that
number
is
almost
certainly
inflated.
5.3
Demographics
DataSF
sought
data
on
user
professions
and
sectors
of
employment,
but
did
not
ask
about
more
basic
demographic
information
(age,
sex,
race,
etc.).
This
makes
it
difficult
to
piece
together
a
strong
portrait
of
“average”
DataSF
users.
From
the
data
that
was
provided,
53%
(9
people)
of
users
were
from
the
private
sector,
with
local
government
employees
being
the
second
largest
user
group
at
35%
of
respondents
(six
73
See
Figure
16,
P.
39
74
See
Figure
17,
P.
39
40. 38
people).75
Additionally,
68%
of
respondents
(13
people)
classified
themselves
as
either
“Analyst”
or
“Programmer”.76
These
are
the
same
job
types
that
one
would
expect
people
who
make
end-‐user
applications
and
data
visualizations
to
have.
Finally,
the
DataSF
survey
shows
that
just
over
80%
of
DataSF
users
(14
people)
either
live
or
work
in
San
Francisco
(meaning
they
have
some
vested
interest
in
the
city).77
5.4
Conclusion
DataSF
is
one
of
the
most
robust
open
data
cities
in
the
United
States
by
some
measures.78
DataSF
has
an
entire
section
of
their
site
dedicated
to
end-‐user
applications
that
immediately
make
the
service
relevant
to
the
average
citizen,
thus
mitigating
one
of
the
major
problems
in
OGD.
Unfortunately,
there
is
some
mixed
information
in
the
DataSF
survey
regarding
whether
the
majority
of
the
users
are
making
only
one
trip
to
find
answers
to
specific
questions
or
if
they
are
a
larger
group
of
technology-‐savvy
citizens
that
make
heavy
use
of
the
service
to
create
apps
for
average
citizens.
75
See
Figure
18,
P.
40
76
See
Figure
19,
P.
40
77
See
Figure
20,
P.
41
78
Open
Data
Index.
Open
Knowledge
Foundation.
41. 39
5.5
DataSF
Figures
Figure
16
Figure
17
0
20
40
60
Data
Accessbility
Transparency
Both
Percent
What
Do
You
Think
Is
The
Purpose
Of
DataSF?
0
10
20
30
40
50
60
70
Percent
How
are
you
using
DataSF?
42. 40
Figure
18
Figure
19
0
10
20
30
40
50
60
Percent
What
Sector
Do
You
Work
In?
0
5
10
15
20
25
30
35
40
45
Percent
How
Would
You
Characterize
Your
Role?
43. 41
Figure
20
Figure
21
0
20
40
60
80
100
Yes
No
Percent
Do
You
Live
Or
Work
In
San
Francisco?
0
20
40
60
Yes
No
Percent
Do
You
Work
For
The
City
And
County
Of
San
Francisco?
44. 42
6
Discussion
in
Combination
6.1
Comparison
of
Open
Raleigh
and
DataSF
Raleigh,
NC
and
San
Francisco,
CA
both
have
robust
OGD
initiatives.
According
to
the
Open
Knowledge
Foundation,
San
Francisco’s
DataSF
is
the
second-‐best
municipal
OGD
program
in
the
country,
while
Raleigh
ranks
a
respectable
29th
.79
While
the
DataSF
survey
is
not
robust
enough
to
draw
substantial
conclusions
on
its
own,
many
of
the
trends
seen
in
the
data
correspond
well
to
the
data
in
Open
Raleigh,
suggesting
a
pattern.
Most
tellingly,
users
of
both
services
seem
to
follow
the
pattern
of
downloading
a
single
dataset
just
to
browse.
On
Open
Raleigh
over
half
of
users
(53%)
were
there
“Just
to
Browse”
a
dataset;
only
21%
made
either
a
web
or
mobile
application.
Similarly,
only
18%
of
DataSF
users
were
interested
in
making
a
web
or
mobile
application
with
the
data.
This
suggests
that
these
open
data
initiatives
have
a
small
core
of
dedicated
power
users
that
make
end-‐user
applications,
but
that
most
of
their
traffic
comes
from
single-‐use
visitors
looking
for
specific
information.
Interestingly,
Open
Raleigh
has
far
more
users
what
live
outside
the
City
of
Raleigh
than
does
DataSF
(36%
for
Open
Raleigh
vs.
18%
for
DataSF).
The
difference
in
79
Ibid.
45. 43
question
wording
should
not
make
any
difference
due
to
San
Francisco’s
unique
governmental
structure
as
the
only
consolidated
city-‐county
in
California.80
Essentially,
the
DataSF
question
is
the
same
as
the
Open
Raleigh
question
despite
their
wording
differences.
Nevertheless,
the
difference
between
the
two
programs
is
difficult
to
explain.
Both
cities
have
numerous
smaller
cities
in
their
metro
area.
Raleigh
has
Durham,
Cary,
and
Chapel
Hill
nearby
while
San
Francisco
has
Oakland,
Berkeley,
and
Redwood.
While
both
cities
are
part
of
substantial
technology
hubs,
San
Francisco’s
metro
area
is
home
to
over
seven
million
people
as
of
the
2010
census,
whereas
Raleigh
had
just
under
two
million
people.81,
82
Further
research
is
needed
to
explore
why
this
difference
exists,
or
if
it
really
exists
at
all.
Overall,
the
data
given
suggests
similar
use
patterns
between
Open
Raleigh
and
DataSF.
The
power
users
create
nearly
all
of
the
end-‐user
applications,
though
the
bulk
of
dataset
downloads
(separate
from
API
calls)
are
done
by
“average”
citizens
looking
to
answer
specific
questions.
6.2
Issues
With
Data
The
data
provided
here
consists
of
two
surveys
of
open
data
programs
on
opposite
sides
of
the
United
States.
There
are
numerous
issues
with
the
data
that
affect
the
strength
of
the
profiles
built
here.
80
"Board
of
Supervisors
-‐
Does
San
Francisco
Have
a
City
Council?"
San
Francisco
311.
Accessed
March
18,
2015.
http://sf311.org/index.aspx?page=262.
81
"San
Francisco
Bay
Area."
Bay
Area
Census.
Accessed
March
18,
2015.
http://www.bayareacensus.ca.gov/bayarea.htm.
82
"Raleigh
Demographics."
City
of
Raleigh.
46. 44
First,
these
surveys
were
not
created
in
concert
with
each
other;
they
represent
two
completely
different
processes
with
different
goals.
This
affects
the
ability
to
bring
these
data
together
into
a
cohesive
picture
of
open
data
users
and
use
patterns.
Future
work
should
create
a
single
survey
for
distribution
by
all
open
data
programs.
Second,
the
Open
Raleigh
and
DataSF
surveys
each
had
less
than
100
responses.
The
low
response
rate
(especially
from
DataSF)
severely
limits
the
confidence
with
which
profiles
of
users
can
be
built.
The
number
of
responses
that
would
be
considered
statistically
valid
varies
from
program
to
program.
Additionally,
statistical
significance
in
response
rates
will
also
vary
with
the
existential
question
of
what
that
open
data
program
audience
should
be
(discussed
in
section
6.4
below).
Ideally,
future
work
will
expand
the
focus
from
municipal
open
data
to
open
government
data
programs
at
multiple
levels
of
government
(city,
county,
state,
and
federal).
Demographics
and
use
patterns
may
vary
with
each
of
these
different
levels
and
in
different
parts
of
the
country.
Third,
these
surveys
were
not
collected
from
a
similar
pool
of
potential
respondents
in
a
controlled
way.
As
user
groups
grow
and
shrink
over
time,
they
may
change
their
use
patterns
and
demographic
makeup
substantially.
In
order
to
ensure
that
change
over
time
is
not
affecting
the
outcome
of
profiles,
open
data
programs
should
send
surveys
out
during
the
same
time
and
use
the
same
promotion
methods
as
far
as
is
practicable.