More Related Content
Similar to Up pricing third session
Similar to Up pricing third session (20)
More from Moises Cielak (20)
Up pricing third session
- 1. 11/6/18
1
Customer Perception Driven Pricing
• With evolutionary products, Customers…
– have experience with the product category
– can conceptualize potential variations on those products
– understand the value of the benefits delivered
– hold price expectations
– can make informed tradeoffs between competing alternatives.
• Example
– Breyer’s Ice cream with Hershey’s Chocolate Chips
– Case Forklifts with automatic vs. manual transmissions
– Security software bundled with online data backup offerings
– Tide with color safe bleach
© 2012 Cengage Learning. All Rights Reserved. May not be scanned, copied or duplicated, or posted to a publicly accessible website, in whole or in part.
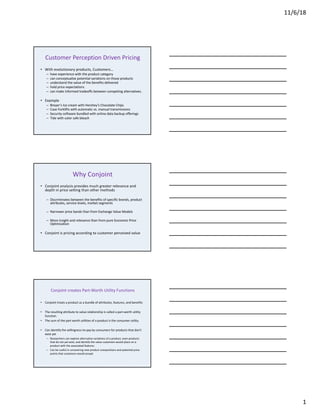
Why Conjoint
• Conjoint analysis provides much greater relevance and
depth in price setting than other methods
– Discriminates between the benefits of specific brands, product
attributes, service levels, market segments
– Narrower price bands than from Exchange Value Models
– More insight and relevance than from pure Economic Price
Optimization
• Conjoint is pricing according to customer perceived value
© 2012 Cengage Learning. All Rights Reserved. May not be scanned, copied or duplicated, or posted to a publicly accessible website, in whole or in part.
Conjoint creates Part-Worth Utility Functions
• Conjoint treats a product as a bundle of attributes, features, and benefits
• The resulting attribute to value relationship is called a part-worth utility
function.
• The sum of the part worth utilities of a product is the consumer utility.
• Can identify the willingness-to-pay by consumers for products that don’t
exist yet
– Researchers can explore alternative variations of a product, even products
that do not yet exist, and identify the value customers would place on a
product with the associated features
– Can be useful in uncovering new product compositions and potential price
points that customers would accept
© 2012 Cengage Learning. All Rights Reserved. May not be scanned, copied or duplicated, or posted to a publicly accessible website, in whole or in part.
- 2. 11/6/18
2
Conjoint is a Market Research Based Tool
• As a market research technique, the quantification of
value comes from the perspective of the customer, not
the company
• Has similar challenges to other market research
techniques
– Shows a snapshot of customer willingness to pay with
limited ability to demonstrate how product valuations will
evolve
– Requires markets with many customers, not just a few (In
B2B markets, this would include Seagull, not Hawk
markets)
© 2012 Cengage Learning. All Rights Reserved. May not be scanned, copied or duplicated, or posted to a publicly accessible website, in whole or in part.
Customer Valuations Vary
• Conjoint analysis can reveal the dispersion of value that different customers place
on a product or its features
– This dispersion can lead to a range of prices that appear to be acceptable to the market
for a product
– The acceptable prices range to come out of a conjoint analysis is much narrower than
that from a raw exchange value model, but broader than that from economic price
optimization
• Dispersion of valuation between consumers can be meaningfully used to enhance
profitability through Segmentation
– Customers will place different value on a product than the producing firm, both greater
and lower valuation
– Greater valuations can derive from customers having alternative uses for a product than
was originally intended by the producer, or from satisfying a need greater than was
anticipated.
– Lower valuations can derive from customers perceiving a wider variety of alternatives
than originally anticipated, or no longer needing a set of benefits delivered.
– If consumer dispersion between valuations of specific features can be aggregated into
meaningfully different groups, conjoint analysis can form the basis of highly valuable
market segmentation
© 2012 Cengage Learning. All Rights Reserved. May not be scanned, copied or duplicated, or posted to a publicly accessible website, in whole or in part.
Example: Mango Juice
• While fresh mango juice is common within tropical areas, it is harder to
find in more northern latitudes
• Potentially, a new hot consumer product
• Mango juice is relatively expensive to produce in relation to other juices,
such as grape or orange
• Producers vary between offering pure Mango Juice and Mango Fruit
Blends
© 2012 Cengage Learning. All Rights Reserved. May not be scanned, copied or duplicated, or posted to a publicly accessible website, in whole or in part.
- 3. 11/6/18
3
Attributes under Consideration
• 32 ounce container of Mango Juice has been determined
• Formulation:
– Pure
– Fruit Blend
• Branding
– National Brand
– Boutique Brand
• Price levels
– $4 or
– $7
• Each of three attribute is posed at two different levels for this example,
but more attributes can be included and more levels can be considered
© 2012 Cengage Learning. All Rights Reserved. May not be scanned, copied or duplicated, or posted to a publicly accessible website, in whole or in part.
Attribute Alternatives
Price
Ingredient Ingredient
Brand
Pure Mango
Juice
Premium Niche
Brand
$7
Mango Fruit
Blend
Premium Niche
Brand
$7
Pure Mango
Juice
Premium Niche
Brand
$4
Mango Fruit
Blend
Premium Niche
Brand
$4
Pure Mango
Juice
National Brand
$7
Mango Fruit
Blend
National Brand
$7
Pure Mango
Juice
National Brand
$4
Mango Fruit
Blend
National Brand
$4
© 2012 Cengage Learning. All Rights Reserved. May not be scanned, copied or duplicated, or posted to a publicly accessible website, in whole or in part.
Rank Ordering
Price
Ingredient Ingredient
Brand
Pure Mango
Juice
Premium Niche
Brand
$7
Rank = 6
Mango Fruit
Blend
Premium Niche
Brand
$7
Rank = 8
Pure Mango
Juice
Premium Niche
Brand
$4
Rank = 2
Mango Fruit
Blend
Premium Niche
Brand
$4
Rank = 4
Pure Mango
Juice
National Brand
$7
Rank = 5
Mango Fruit
Blend
National Brand
$7
Rank = 7
Pure Mango
Juice
National Brand
$4
Rank = 1
Mango Fruit
Blend
National Brand
$4
Rank = 3
• Research subjects are asked to rank order their preferences
© 2012 Cengage Learning. All Rights Reserved. May not be scanned, copied or duplicated, or posted to a publicly accessible website, in whole or in part.
- 4. 11/6/18
4
Scoring
• The researcher then proceeds to prepare the data for evaluation by scoring it
from 0 to 7, where the lowest score is that which yields the lowest utility and
the highest score yields the highest utility.
Price
Ingredient Ingredient
Brand
Pure Mango
Juice
Premium Niche
Brand
$7
Score = 2
Mango Fruit
Blend
Premium Niche
Brand
$7
Score = 0
Pure Mango
Juice
Premium Niche
Brand
$4
Score = 6
Mango Fruit
Blend
Premium Niche
Brand
$4
Score = 4
Pure Mango
Juice
National Brand
$7
Score = 3
Mango Fruit
Blend
National Brand
$7
Score = 1
Pure Mango
Juice
National Brand
$4
Score = 7
Mango Fruit
Blend
National Brand
$4
Score = 5
© 2012 Cengage Learning. All Rights Reserved. May not be scanned, copied or duplicated, or posted to a publicly accessible website, in whole or in part.
Part Worth Utility
Feature Part Worth
Utility
Ingredient Pure Mango (2+3+6+7)/4 4.5
Fruit Blend (0+1+4+5)/4 2.5
Brand Premium
Niche
(2+0+6+4)/4 3.0
National (3+1+7+5)/4 4.0
Price $7 (2+0+3+1)/4 1.5
$4 (6+4+7+5)/4 5.5
• Part-worth Utility is found by averaging product scores among attribute
• Part Worth Utility measured in Utils, an economist metric of utility.
© 2012 Cengage Learning. All Rights Reserved. May not be scanned, copied or duplicated, or posted to a publicly accessible website, in whole or in part.
Product Utility
• To find the utility of a product, we simply add the part worth utilities
• We can see that the part-worth utility valuation creates the same
utility ranking as was reported in the survey ranking
Product Utility (Utils) Utility
Ranking
Pure Mango, Premium Niche Brand, $7 4.5 + 3.0 + 1.5 = 9.0 6
Mango Fruit Blend, Premium Niche Brand, $7 2.5 + 3.0 + 1.5 = 7.0 8
Pure Mango, Premium Niche Brand, $4 4.5 + 3.0 + 5.5 = 13.0 2
Mango Fruit Blend, Premium Niche Brand, $4 2.5 + 3.0 + 5.5 = 11.0 4
Pure Mango, National Brand, $7 4.5 + 4.0 + 1.5 = 10.0 5
Mango Fruit Blend, National Brand, $7 2.5 + 4.0 + 1.5 = 8.0 7
Pure Mango, National Brand, $4 4.5 + 4.0 + 5.5 = 14.0 1
Mango Fruit Blend, National Brand, $4 2.5 + 4.0 + 5.5 = 12.0 3
© 2012 Cengage Learning. All Rights Reserved. May not be scanned, copied or duplicated, or posted to a publicly accessible website, in whole or in part.
- 5. 11/6/18
5
Using Utils to determine Price Differentials
• Because price was one of the attributes being
measured in the conjoint analysis, we can
place a monetary value on Utils.
– Over the price range from $7 to $4, the part-worth
utility ranges from 5.5 to 1.5.
– Thus, a differential Util is valued at $.75/util
( )
( )5.15.5
4$7$
-
-
=Util
© 2012 Cengage Learning. All Rights Reserved. May not be scanned, copied or duplicated, or posted to a publicly accessible website, in whole or in part.
Potential Compelling Offers
• The preference value this participant places on a national brands versus
boutique brands is 1 util, or $0.75.
– The premium niche brand detracts value from the product for this participant
with respect to national brands.
• The preference value this participant places on a Pure Mango Juice versus
a Mango Fruit Blend is 2 utils, or $1.50.
– Purity in mango juice adds value for this participant.
• Potential products.
– Market a boutique brand of pure mango juice competing against an
established national brand of mango fruit blend priced at $4 would have to
market their product at a price less than $4.75 to attract this research
participant.
– $4.75 is found by adding the util difference between premium niche versus
national (-1.0 utils) and the util difference between pure mango juice and
mango fruit blend (2.0 utils), which yields 1 util, where 1 util is valued, by the
customer, at $.75
© 2012 Cengage Learning. All Rights Reserved. May not be scanned, copied or duplicated, or posted to a publicly accessible website, in whole or in part.
The Larger Market
• Different customers will have different utility rankings,
and therefore different part-worth utilities for the
various attributes
• The aggregate market’s part-worth utility for specific
attributes is the average of the individual participants
part worth utility.
• If there are meaningful differences between groups of
market research participants in their utility rankings,
researchers can segment the market and uncover the
utility different segments would place on different
product compositions.
© 2012 Cengage Learning. All Rights Reserved. May not be scanned, copied or duplicated, or posted to a publicly accessible website, in whole or in part.
- 6. 11/6/18
6
Deliverable….
• Which variables would you
guys use to build a conjoint
annalysis today? According to
the product chosen for your
class ….
© 2012 Cengage Learning. All Rights Reserved. May not be scanned, copied or duplicated, or posted to a publicly accessible website, in whole or in part.
© 2012 Cengage Learning. All Rights Reserved. May not be scanned, copied or duplicated, or posted to a publicly accessible website, in whole or in part.
5 Steps to Conjoint Analysis
1. Attributes Definition
2. Stimulus Presentation
3. Response Measurement
4. Evaluation Criterion
5. Data Analysis
© 2012 Cengage Learning. All Rights Reserved. May not be scanned, copied or duplicated, or posted to a publicly accessible website, in whole or in part.
- 7. 11/6/18
7
1. Attribute Definition
• The attributes and attribute level lists need to be full, relevant, and executable.
– Conjoint can only value an attribute this is included in the research, and only within the
range of levels examined
– Adding more attributes quickly adds complexity, and costs, but also delivers more insight
and flexibility
• Attribute Types
– Physical attributes
– Performance benefits
– Psychological positioning.
• Attribute Levels
– Thee attributes are examined at specific discrete levels, not on a continuous scale
– Need to ensure that the levels span the dimension under investigation, but is fine
enough to indicate intermediate points.
– For example: Commuter bicycle the tires at three levels of narrow, medium, or wide
width, or the selection could be expanded to include five levels with extra wide and
extra narrow.
© 2012 Cengage Learning. All Rights Reserved. May not be scanned, copied or duplicated, or posted to a publicly accessible website, in whole or in part.
2. Stimulus Presentation
• Verbal
– “Brand: National”
– The attribute is listed along with its level
– Advantages:
• simplicity in execution
• efficiency in collection of data
• variety in number of attributes and levels which can be
considered in a single study
© 2012 Cengage Learning. All Rights Reserved. May not be scanned, copied or duplicated, or posted to a publicly accessible website, in whole or in part.
2. Stimulus Presentation
• Paragraph
– “The brand would be a nationally well known brand.”
– Attribute is described using natural language in
complete sentences
– Advantage:
• provides a more realistic and complete description of the
product which would lead to more reliable measurements
of results.
– Disadvantage:
• Descriptions will be long
• it limits the total number of descriptions to a small number
© 2012 Cengage Learning. All Rights Reserved. May not be scanned, copied or duplicated, or posted to a publicly accessible website, in whole or in part.
- 8. 11/6/18
8
2. Stimulus Presentation
• Pictorial
– Visual props used in an interview setting.
– Advantage:
• Realistic
• Pictorial representations are more likely to accurately
communicate the meaning of different attribute levels
• Participants are less likely to suffer from information
overload in reviewing multiple lists of features,
• the task itself is more interesting and less fatiguing
– Disadvantage:
• the cost to prepare and present the stimulus can be high.
© 2012 Cengage Learning. All Rights Reserved. May not be scanned, copied or duplicated, or posted to a publicly accessible website, in whole or in part.
3. Response Measurement
• Rank ordering
– Nonmetric measurement
– Participants are provided with a stack of cards
where each card holds a product description or
stimulus presentation. Participants are then
asked to divide the cards into two halves of
preferred and not preferred products, and then
repeat the procedure of starting with the
preferred half, moving through out the pile, until
the ranking has been complete.
© 2012 Cengage Learning. All Rights Reserved. May not be scanned, copied or duplicated, or posted to a publicly accessible website, in whole or in part.
3. Response Measurement
• Paired comparisons
– Nonmetric measurement
– Two products are presented at a time and the
participant is asked to state their preference.
Which commuter cycle do you prefer?
Grey
Disc Brakes
700x38C Street tires
Made in China
Well known brand
Price is several dollars
more than average
Black
Pivot Brakes
26” X 1.95”
Rugged tires
Made in the USA
Unknown brand
Price is average
OR
© 2012 Cengage Learning. All Rights Reserved. May not be scanned, copied or duplicated, or posted to a publicly accessible website, in whole or in part.
- 9. 11/6/18
9
3. Response Measurement
• Rating scales
– Participants are asked to rate
their level of interest in a
product.
– The scale can be continuous as
shown in the exhibit or discrete,
such as giving a product a rating
between 1 and 100 in whole
numbers
– Functionally, researchers have
shown that rating scales and
rank ordering can yield similar
results under many
circumstances
• Commuter Cycle
– The cycle is Grey
– The cycle has disc brakes
– The cycle is better than average
– The cycle is several dollars more than average
– The cycle is made in China
– The label on the cycle is a well known brand
• Based on the information above, how likely is it
that you would purchase this commuter cycle
Not at All
Likely
Very
Likely
© 2012 Cengage Learning. All Rights Reserved. May not be scanned, copied or duplicated, or posted to a publicly accessible website, in whole or in part.
4. Evaluation Criterion
• Criteria used to rank preferences
– Overall Preference or Intention to Buy
• Overall Preference
– When studying more established markets, preference
evaluation have been identified to be more useful in estimating
market shares.
• Intention to Buy
– Suitable for new product classes and service that consumers to
not purchase currently.
– These studies help researchers estimate the potential market
size.
© 2012 Cengage Learning. All Rights Reserved. May not be scanned, copied or duplicated, or posted to a publicly accessible website, in whole or in part.
5. Data Analysis
• The type of data analysis that is conducted will depend upon the prior
decisions regarding response type.
• Rank ordering
– Recognize that we don’t really know by how much one alternative is
preferred over another.
– We can only analyze the ordering of preferences through techniques such as
monotone analysis of variance (MONANOVA), PREFMAP, or LINMAP.
• Paired Comparisons
– Participants have been asked to state their probability of choice,
– LOGIT and PROBIT methods can be used to accommodate the fact that
probabilities lie between zero and one.
• Rating scores
– Regression analysis such as ordinary least squares (OLS) or minimizing sum of
absolute errors (MSAE).
© 2012 Cengage Learning. All Rights Reserved. May not be scanned, copied or duplicated, or posted to a publicly accessible website, in whole or in part.
- 10. 11/6/18
10
A rose is a rose by any other name
• Conjoint Analysis is marketed under a variety
of names
– Discrete choice and tradeoff analysis are two of
the more popular names
– Regardless of name, each variant shares the same
basic principles
© 2012 Cengage Learning. All Rights Reserved. May not be scanned, copied or duplicated, or posted to a publicly accessible website, in whole or in part.
Summary
• Conjoint analysis tends to dominate pricing challenges with evolutionary,
differentiated products
• Conjoint analysis treats a product as a sum of its parts, including features,
attributes and benefits
• Conjoint analysis reveals the part-worth utility that customers place on
specific attributes.
• Dispersion between the part-worth utility functions of customers can be
used to identify market segments and estimate market shares of products
serving those market segments.
• Project Plan: attribute definition, product description selection, response
type selection, evaluation criterion, and data analysis
© 2012 Cengage Learning. All Rights Reserved. May not be scanned, copied or duplicated, or posted to a publicly accessible website, in whole or in part.
Price Variability in Autos
• Large variation of prices for a similar good within
the same category
– Tata Nano $2500
– Chevrolet Malibu $28,000
– Bentley Flying Spur $170,000
– a factor of 68 between the lowest price production car
and the highest price product auto
• What justifies the price difference: Benefits
• Benefits based pricing is a direct extension of the
economics of pricing
© 2012 Cengage Learning. All Rights Reserved. May not be scanned, copied or duplicated, or posted to a publicly accessible website, in whole or in part.
- 11. 11/6/18
11
Price to Benefits Map
• Price Boundary Theory
– Identify relevant competing
alternatives
– Define the value differential
– Pricing accordingly
• The price to benefits map plots
the position of products in
terms of perceived products
and perceived benefits….
– Visual representation of how
customers perceive the value
trade off.
PerceivedPrice
Perceived Benefits
Tata
Nano
Lexus LS
Chevrolet
Malibu
BMW 7
Series
Bentley Flying
Spur
© 2012 Cengage Learning. All Rights Reserved. May not be scanned, copied or duplicated, or posted to a publicly accessible website, in whole or in part.
EVM Model Delivers Price to Value
Stent Exchange Value Model Results
0
500
1000
1500
2000
2500
3000
3500
4000
Standard Stent Druge Eluting Stent
Strent
EvaluatedValue
© 2012 Cengage Learning. All Rights Reserved. May not be scanned, copied or duplicated, or posted to a publicly accessible website, in whole or in part.
Conjoint Delivers Price to Value
Mango Juice Conjoint Analysis Results
$3.00
$3.50
$4.00
$4.50
$5.00
$5.50
$6.00
Mango Fruit
Blend,
Premium
Niche Brand
Mango Fruit
Blend,
National
Brand
Pure Mango,
Premium
Niche Brand
Pure Mango,
National
Brand
Product Features
PerceivedValue
© 2012 Cengage Learning. All Rights Reserved. May not be scanned, copied or duplicated, or posted to a publicly accessible website, in whole or in part.
- 12. 11/6/18
12
The Market Expects Price to Value
Exhaust Fan Prices (Grainger)
$800
$900
$1,000
$1,100
$1,200
$1,300
$1,400
$1,500
$1,600
0 1000 2000 3000 4000 5000 6000 7000
Capacity (CFM)
Price
© 2012 Cengage Learning. All Rights Reserved. May not be scanned, copied or duplicated, or posted to a publicly accessible website, in whole or in part.
Pricing Areas
• Value Equivalence Line
– Where price increases
proportional to benefits
increases
• Value Advantaged
– Excess benefits beyond what is
captured in price
• Value Disadvantaged
– Priced higher than what would
be justified based on the
measure of benefits alone
PerceivedPrice
Perceived Benefits
Value
Advantaged
Value
Disadvantaged
Zone of
Indifference
Value
Equivalence
Line
© 2012 Cengage Learning. All Rights Reserved. May not be scanned, copied or duplicated, or posted to a publicly accessible website, in whole or in part.
Zone of Indifference
• Around the value equivalence line is a zone of indifference
– Small variations in price or benefits around the value equivalence line have
non measureable effect on sales volume
• Not all products will fall along the value equivalence line
– Outside of this zone of indifference, lies the value advantaged zone and the
value disadvantaged zone.
– Products lying in the value advantaged or disadvantaged zones are either
priced significantly lower or higher than the corresponding levels of benefits,
as perceived by customers
• Elasticity is a key ingredient for determining the width of this zone.
• There is a range of pricing moves that will not impact purchasing behavior
at all
– Range of demand inelasticity, as the next nearest competitor is out of the
comparison metric
– Can be a source of a painless price increase, thus improving profitability
© 2012 Cengage Learning. All Rights Reserved. May not be scanned, copied or duplicated, or posted to a publicly accessible website, in whole or in part.
- 13. 11/6/18
13
Variance in Price Elasticity
• Big Number syndrome
– large changes in price have non-linear
effect on elasticity of demand
– Zone of credibility
• Below expectation price the offering has no
credible value.
• Above expectation price and customers do
not believe it is possible to deliver that
many benefits
• Benefit Bracketed
– Benefit Floor: Required minimal level of
benefits
– Benefit Ceiling : Exceeding a maximum
level, maximum WTP for benefits … more
horsepower in a car becomes unnecessary
• Price Capped
– Budget constraints
– Price category spending constraints
• Variance by segment
– different customer segments have
different price sensitivities
• Variance with time
– customer needs change over time, product
lifecycle and expectation of growing
benefits for same dollar
• Variance by price communication method
– daily, monthly, or annual payment
schemes can affect price sensitivity
• Variance by discounting method
– off invoice discounts vs. on receipt
discounts have different effects on
perceived price
• Creating demand vs. shifting shares
– market growth by lowering price of item or
is it just steeling a fixed share
• Cross-product elasticity.
– Switching between categories: cars vs.
bicycles
– As aluminum became cheaper, it displaced
steel in beverage cans, later displaced
itself by plastic
– Paper or plastic bags
© 2012 Cengage Learning. All Rights Reserved. May not be scanned, copied or duplicated, or posted to a publicly accessible website, in whole or in part.
Value Advantaged
• At times, companies will choose to price
aggressively, thus providing more benefits than
expected at a given price
• Unharvested Value
– Some authors refer to products priced in the
value advantaged zone as suffering from
“unharvested value” because the company has
the opportunity with products that are “value
advantaged” to raise the prices.
– Consider it a pricing error
– Ex: selling front row seats at the same price as
lawn seats in a large amphitheatre
• Market Share Taking
– Customers perceive that more benefits are
delivered at a given price through the value
advantaged product, and rationally choose to
select that product.
– Warning: deliberately pricing products in the
value advantaged zone is likely to instigate a
competitive reaction, such as a potential price
war, harming overall industry health
• Hypercompetition
– Certain product categories, technology driven
sectors in particular, enjoy sequential
improvements in product quality over time
• Autos and gas mileage
• DRAM decreases in costs per kb each time a new
photolithography standard becomes available
• LCD TV’s, computer processors, etc likewise enjoy
such costs reductions over time
– Aggressively pricing new technology that offers
significant costs advantages over legacy
technology is a common trait in certain markets.
Forms the basis for the concept of
Hypercompetion,
– See D’Aveni
© 2012 Cengage Learning. All Rights Reserved. May not be scanned, copied or duplicated, or posted to a publicly accessible website, in whole or in part.
Value Disadvantaged
• At the other end of the spectrum,
companies will at times price a product
high in comparison to the perceived
benefits of that offering.
• Missed Opportunities
– Some authors refer to this as missed
opportunities, as the firm could have sold
a higher volume if their prices were more
inline with expectation levels
– Consider it too a pricing error
– Ex: Unsold advertising space within a
poplar magazine
• Usually results in a loss of market share
• Can be stable if the product does offer
superior benefits along a dimension not
measured
– Can be used effectively to capture profits
from a segment that seeks value and
derives benefits from a source of features
or placement that is along another
dimension than that measured.
– Ex: Bentley Silver Spur @ $170,000 vs.
Porsche 911 GT2 @ $194,000
– Both priced relatively high, but for a sedan
seeking buyer, the Porsche is priced too
high as it fails to provide luxurious seating.
Meanwhile, for the performance seeking
buyer, the Bentley Silver Spur is priced to
high for the level of performance sought.
• In this case, it is suggested that the market
be segmented, and generate specific Price
to Benefits maps for the independent
market segments.
– i.e. luxury sedans as one segment and
luxury sports cars as another segment
© 2012 Cengage Learning. All Rights Reserved. May not be scanned, copied or duplicated, or posted to a publicly accessible website, in whole or in part.
- 14. 11/6/18
14
Constructing Price to Benefits Maps
• Executive Approach
– Identify competing products and their features , benefits, and prices. Position them on
the price to value map according to management impressions of the valuation of
competing benefits
• Delphi Approach
– Use a defined or identified market transaction prices and independent expert
evaluations of “benefits”
• Consumer Research Approach
– Measure the level of perceived benefits and perceived price for a number of
products, as well as the variation in prices in which customers are indifferent
to changes.
– Plot the products according to the mean perceived price and mean perceive
benefits. Use the variation in prices to define ellipses of uncertainty about the
mean price and benefits for the products.
© 2012 Cengage Learning. All Rights Reserved. May not be scanned, copied or duplicated, or posted to a publicly accessible website, in whole or in part.
Dispersion in Perceived Price
• Within the market, a single product
may be sold at a number of different
prices, and the perceived price may at
times vary away from the actual
transaction price
– Varies between customers
• Hidden price vs. explicit price
statements
– Phone tariff structures of incumbent
vs. new entrant
• Usage rates and flat fees… price per
unit can vary
– Distribution Channel and Locations –
each gives variation in price.
– Promotional discounts
• Couponing and price promotions
• Can create challenges in cross channel
cannibalization.
• Perception mismatch
– Customer may place an expected price
on a product based upon the last time
they purchased that product, however
due to changes in economic situations,
the price will change over time.
Especially true during inflationary
times.
PerceivedPrice
Perceived Benefits
Large
Dispersion in
Perceived
Price
© 2012 Cengage Learning. All Rights Reserved. May not be scanned, copied or duplicated, or posted to a publicly accessible website, in whole or in part.
Dispersion in Perceived Benefits
• Perception of benefits gained from utilizing a product varies among customers – orientation
of segmentation
– Most common error, to include to multiple and disparate market segments as one in making a Price
to Benefits map
• Poor marketing communication techniques
– Can be due to miscommunication of the benefits where some MarComm focuses on one set of
benefits while other MarComm focuses on another set of benefits, leaving the recipients of the
message confused as to the exact set of benefits or their value – Can be an area to “fix” within the
company
– Arises naturally when different segments pay attention to promotional activity differently. Some
segments are more responsive to marketing communication than others, driving a dispersion in
perceived benefits (McDonalds Healthy Choices)
• Common also in experience and credence goods,
– the benefits of the product can only be poorly perceived prior to purchase, if they are ever observed
(credence goods)
– customers with direct and recent exposure to the product are likely to have a more accurate reading
of the benefits than those with less exposure to the product
• Dispersion in risk tolerance affects benefits perception
– Risk aversion and aversion to change may cause many customers to discount the perceived benefits,
while other customers seek the benefits precisely because they bring about change
– Also seen in business markets, where executive management seeks change and improvement while
mid-level management seeks stability and steady career improvement
© 2012 Cengage Learning. All Rights Reserved. May not be scanned, copied or duplicated, or posted to a publicly accessible website, in whole or in part.
- 15. 11/6/18
15
Dispersion in Perceived BenefitsPerceivedPrice
Perceived Benefits
Large
Dispersion in
Perceived
Benefits
© 2012 Cengage Learning. All Rights Reserved. May not be scanned, copied or duplicated, or posted to a publicly accessible website, in whole or in part.
Benefit Sources
• Functional benefits
– physical nature or performance characteristics of the product
– Examples: Cars, jewel clarity and size, square footage &
neighborhood,
• Process benefits
– lowering transactional costs
– quicker, safer, easier, reduced search costs, etc
• Relationship benefits
– accrue to the customer from a mutually beneficial relationship
with the seller
– emotional connection to the brand or sales representative,
loyalty rewards, information provisions, - lower search costs or
design costs.
© 2012 Cengage Learning. All Rights Reserved. May not be scanned, copied or duplicated, or posted to a publicly accessible website, in whole or in part.
Market Confusion
Simultaneous Dispersion in Perceived Price and Benefits
PerceivedPrice
Perceived Benefits
Large Dispersion in Perceived
Benefits and Price
Leading to poor purchases, and
ultimately brand betrayal or lost
opportunities
© 2012 Cengage Learning. All Rights Reserved. May not be scanned, copied or duplicated, or posted to a publicly accessible website, in whole or in part.
- 16. 11/6/18
16
New Product Positioning or
Repositioning
• Key Pricing issue in Product Launch/Repositioning is where
on the Price to Benefits map should the product fit?
– Where is the customer addressable horizon?
• Customers from a higher price / higher benefit region?
• Customers from a lower price / lower benefits region?
– Where are the adjacencies from which the new product will
take market share or grow the market?
– What is the likely response of the nearest competitor?
– Is the new position defensible?
• Choices:
• Value Equivalence
• Value Advantaged
• Value Disadvantaged
– For Each, why would you take one stance vs. another?
© 2012 Cengage Learning. All Rights Reserved. May not be scanned, copied or duplicated, or posted to a publicly accessible website, in whole or in part.
Price Neutral
• Pricing along the Zone of
indifference
• Occurs when there is a opening in
the Price to Benefits map that is
currently un-served
– From whom will you see a
response, those closest to you in
the Price to Benefits map.
• Somewhat unlikely to have a
strong competitive response
• Will capture profits in proportion
to benefits
• Safest from a pricing perspective.
Puts pressure on other marketing
levers, distribution and promotion,
in driving volume
PerceivedPrice
Perceived Benefits
New
Product
© 2012 Cengage Learning. All Rights Reserved. May not be scanned, copied or duplicated, or posted to a publicly accessible website, in whole or in part.
Penetration Pricing
• Pricing at a low level compared to level
of benefits offered
• Using price as a means to gain market
share
• Can come from increasing the level of
benefits of a product, but leaving the
price unchanged, thus driving the
product into the value advantaged zone
• Easy from a promotion perspective, but
can be deleterious for the firm
– Substantial loss of potential profit
– Can incur a negative competitive
response
• Potential competitive response
– Most likely direct response is a price
decrease by competitors,
– Less likely is a benefits increase, as
these take time through re-engineering
the product
– Show who is most affected.
PerceivedPrice
Perceived Benefits
New Product
Priced to
Penetrate the
Market
Likely
Competitive
Response is a
Price
Decrease
© 2012 Cengage Learning. All Rights Reserved. May not be scanned, copied or duplicated, or posted to a publicly accessible website, in whole or in part.
- 17. 11/6/18
17
Skim Pricing
• Pricing high with respect to
competitors comparable price to
benefits offer
• Price in the value disadvantaged
zone
• Skim profits from early customers
with the expectation of lowering
prices later
• Perceived as a Safe move from a
competitive response perspective,
however
– Can be a pricing error in terms of
forgone profits from missing
volume target
– Provides insufficient motivation
for the market to purchase the
product at the higher price point,
given the alternatives
• Use only if offer taps into a metric
of benefits not foreseen by most
competitors
PerceivedPrice
Perceived Benefits
New Product
Priced to Skim
the Market
© 2012 Cengage Learning. All Rights Reserved. May not be scanned, copied or duplicated, or posted to a publicly accessible website, in whole or in part.
Summary
• Prices should reflect value
• On any pricing move, you will take share primarily from
other products that are near the new pricing position
on the price to value map
• Price Neutral Positioning posses the fewest
competitive threats
• Value Advantaged Positioning imposes a threat on
competitors
• Value Disadvantaged Positioning challenges the need
to capture customers
• Customer may be uncertain regarding your price
position. Communicate Clearly.
© 2012 Cengage Learning. All Rights Reserved. May not be scanned, copied or duplicated, or posted to a publicly accessible website, in whole or in part.
• Why do prices end in nines?
• If private transactions are just that, private, why
do customers care what others paid?
• How do customers perceive prices and offerings?
• Are their inherent biases that influence the
perception of value and price?
• Can a firm influence a customer’s perception of
the value?
• Stretch question: Is the best price always the one
that accurately reflects value?
© 2012 Cengage Learning. All Rights Reserved. May not be scanned, copied or duplicated, or posted to a publicly accessible website, in whole or in part.
Agenda
- 18. 11/6/18
18
Quantitative Methods Alone are Insufficient for Pricing
Decisions
• Pricing a product proportional to value is fundamental principal in
strategic pricing, however value is a subjective matter
• Value Based Pricing Techniques all suffer from an inability to fully include
subjective behavior
– Exchange value models reveal the potential value within a product, yet
depend upon the benefits that are quantified within the model, and which
benefits should be quantified is a subjective decision.
– Conjoint analysis reveals the current perceived value, but not the potential to
change value perceptions
– Economic price optimization ignores the other marketing variables under
control: branding, placement, price structure,
• Convincing customers of the value shifts the pricing challenge to
marketing communication and sales professionals, who must confront
certain decision making biases of customers.
• Customer beliefs are under the influence of the firm
© 2012 Cengage Learning. All Rights Reserved. May not be scanned, copied or duplicated, or posted to a publicly accessible website, in whole or in part.
Influencing Price Acceptance
• There are numerous factors that influence how customers perceive value and
price.
• Many of these factors arise from deeper, psychological influences, and
perhaps even biologically evolutionary influences in their development and
expression in human behavior
• Rather than taking an approach of attempting to correct human behavior and
make people somehow more logical in our purchase decision making, it is
more usually efficient to
– Understand decision biases in purchasing behavior
– Uncover approaches to reducing psychological
dissonance,
– Understand the limitations to pricing power
– And thus facilitate customer decisions to purchase
© 2012 Cengage Learning. All Rights Reserved. May not be scanned, copied or duplicated, or posted to a publicly accessible website, in whole or in part.
Brain as a Predictive Machine
• Current research in neuroeconomics is revealing many intriguing insights
into how humans think
– In one model, the human brain continuously generates predictions about
what to expect in the environment.
– For example, if you see a chair that you have never seen before, you can still
determine what it is, its function, approximate weight, approximate price, and
other such characteristics.
– To derive these expectations rapidly we rely on surprisingly little information.
– Neural circuits mediate vital mental skills that translate information into
impressions, preferences, judgments, and predictions, and therefore
willingness to pay
• Consider us as COGNATIVE MISERS relying on HURISTICS to make decisions
faster
© 2012 Cengage Learning. All Rights Reserved. May not be scanned, copied or duplicated, or posted to a publicly accessible website, in whole or in part.
- 19. 11/6/18
19
It’s your brain too.
Use yours, Don’t fix theirs.
• Some of the better understood factors that influence
price perceptions and value perceptions have been
well documented in research.
• Some decrease price sensitivity and can be influenced
by the firm’s actions and decisions, thus form an area
to improve the pricing power of the firm
• Others provide insights into the psychological
influences to a customers price sensitivity and
willingness to pay, thus providing guidance to restrain
inappropriate pricing practices
© 2012 Cengage Learning. All Rights Reserved. May not be scanned, copied or duplicated, or posted to a publicly accessible website, in whole or in part.
• True Economic Costs
1. Shared Cost Effect
2. Switching Costs
3. Expenditure Effect
4. Difficult Comparison Effect
• Perceptual Challenges
5. Price Endings in 9s
6. Fairness Effect
7. Overconfidence in Future Economic
Efficiency
8. Small Pie Bias
9. Promotional Influence
10. Prospect Theory
– Losses Weigh Heavier than Gains
– Inflection at the Point of Reference
– Diminishing Sensitivity
– Risk Aversion in the Positive Frame and
Risk Seeking in the Negative Frame
– Utility Function from Prospect Theory
– Prescriptions
• Effects Related to Prospect Theory
11. Reference Price Effects
12. Endowment Effect
13. Anchoring
14. Comparison Set Effect
15. Framing Effect
16. Order Bias
17. End-benefit Effect
© 2012 Cengage Learning. All Rights Reserved. May not be scanned, copied or duplicated, or posted to a publicly accessible website, in whole or in part.
Behavioral Effects that
Influence Price Sensitivity
Shared Cost Effect
• Price sensitivity is reduced when customers use
other people’s money to pay for a product
– For instance, business travelers often receive full
reimbursement for travel expenses.
– Airline loyalty programs enable airlines to marginally
increase prices because the price is paid by the
business but the choice of airline is influenced by the
traveler
– To a lesser degree, rebates to lower price sensitivity
due to the partial payment of the product through the
rebate.
© 2012 Cengage Learning. All Rights Reserved. May not be scanned, copied or duplicated, or posted to a publicly accessible website, in whole or in part.
- 20. 11/6/18
20
Four Funds of Money
Funds Source
FundsPurpose
Themselves Someone Else
ThemselvesSomeoneElse
1
Moderate Price Sensitivity
High Utility Personal Sensitivity
2
Moderate Price Sensitivity
High Utility Sensitivity
of Gift Giving
3
Low Price Sensitivity
High Utility Personal Sensitivity
4
Low Price Sensitivity
Low Utility Sensitivity
© 2012 Cengage Learning. All Rights Reserved. May not be scanned, copied or duplicated, or posted to a publicly accessible website, in whole or in part.
Four Funds of Money
1. People spend their own money on themselves. When they do so, they
pay high attention to gaining utility from the product and getting the most
utility per dollar spent.
2. People spend their own money on someone else. When they do so, they
are seeking to maximize the utility of the gift recipient as well as maximize
their utility in giving the gift. Thus, they remain price sensitive but the
definition of utility changes.
3. People spend someone else’s money on themselves. In this case, the
customer will be very benefit oriented, but less price sensitive, than when
drawing from prior funds of money.
4. And lastly, people will spend someone else’s money on someone else,
such as in the case of buying products for a business. In the absence of
decision making oversight and proper incentives, people drawing from
this last source of funds are neither very price nor benefit sensitivity
© 2012 Cengage Learning. All Rights Reserved. May not be scanned, copied or duplicated, or posted to a publicly accessible website, in whole or in part.
Switching Costs
• Economic Switching costs are any costs
(opportunity and direct) related to switch
between suppliers.
• They arise from product-specific investments
buyers make, which may come derive from in
monetary or psychological factors.
• Product specific investments decrease price
sensitivity for existing customers
© 2012 Cengage Learning. All Rights Reserved. May not be scanned, copied or duplicated, or posted to a publicly accessible website, in whole or in part.
- 21. 11/6/18
21
• Complimentary goods
– A customer purchases an iPod and later purchases an iPod
docking station to listen to their music in the home. The
docking station is a complimentary good, and purchasing the
docking station makes the customer more likely to repurchase
an iPod upon the next purchase occasion.
• Learning
– A customer purchases Dreamweaver and learns how to make
websites. Switching to Pagemaker requires relearning.
• Engineering Costs
– A customer learns how to implement a specific chip for a
specific application. Changing the chip requires re-engineering,
re-certification, and other direct costs. (Product Yields / TQM)
• Brand Loyalty
© 2012 Cengage Learning. All Rights Reserved. May not be scanned, copied or duplicated, or posted to a publicly accessible website, in whole or in part.
Switching Costs from
Product Specific Investments
Expenditure Effect
• The expenditure effect refers to the relationship
between the price tag and the willingness of customers
to shop around
– With large expenditure products, customers have an
incentive to search for alternatives and price compare in
order to reduce their expenditure.
– With products that are associated with smaller
expenditures, the financial incentive to price compare is
reduced while the search costs remain.
– The willingness of customers to evaluate alternatives
depends on how large the expenditure is relative to the
effort necessary to reduce it. Higher price sensitivity when
expenditure is larger portion of budget.
© 2012 Cengage Learning. All Rights Reserved. May not be scanned, copied or duplicated, or posted to a publicly accessible website, in whole or in part.
Difficult Comparison Influence
• By making product and price comparisons
difficult, marketers can increase search costs
and the decision making uncertainty of
customers, thus discouraging product
switching and reducing price sensitivity.
© 2012 Cengage Learning. All Rights Reserved. May not be scanned, copied or duplicated, or posted to a publicly accessible website, in whole or in part.
- 22. 11/6/18
22
Branded Commodities
• Aspirin
– Branded pain relief medicine and unbranded generic
medicine contain the chemically identical active
ingredients.
– However consumers are reluctant to trust an
unbranded supplier and tend to have a higher
willingness to pay for pain relief medicine.
– Branding itself makes inter-product comparisons more
difficult and enables higher prices.
• Whole Foods Pricing
– Quaker Oats: $3.49
– 365 Whole Foods Store Brand: $2.99
© 2012 Cengage Learning. All Rights Reserved. May not be scanned, copied or duplicated, or posted to a publicly accessible website, in whole or in part.
• Vonage vs. AT&T
– Incumbents like to make the price comparison more
challenging between offers, obfuscate the benefits
and price, thus increasing the information gathering
challenge for potential switchers and discouraging
brand switching
– New Entrants / Attacker like to make the price
comparison explicit to enable decision making and
brand switching
© 2012 Cengage Learning. All Rights Reserved. May not be scanned, copied or duplicated, or posted to a publicly accessible website, in whole or in part.
New Entrants vs. Incumbents
Market Share Fights
Product Size
• Velký or Malý Pivo?
– At a hospoda in Prague, one can enjoy large beer for 20 CzK or small beer for
14 CzK. On the face of it, a small beer appears cheaper.
– However a large provides 0.5 liters of beer, making the unit costs of 4.0 CzK
per deciliter, while small is only 0.3 liters of beer, making the unit costs 4.7 CzK
per deciliter.
– On a per deciliter basis, large is less expensive than small.
– In this case, the difficult comparison effect enables the supplier to provide
product at a higher per unit price but at a lower perceived price.
• Hieneken 5 L Mini Keg or 24 Pack?
© 2012 Cengage Learning. All Rights Reserved. May not be scanned, copied or duplicated, or posted to a publicly accessible website, in whole or in part.
- 23. 11/6/18
23
1. Shared Cost Effect
• Four funds of money implies industrial purchases involve
several decision makers and decision criteria
2. Switching Costs
• Product specific investments, whether real or psychological,
increase switching costs and decrease price sensitivity for
existing customers
3. Expenditure Effect
• In industrial markets, increases in the absolute size or strategic
importance of the purchase drive increases in the incentives to
search for alternatives, and therefore price sensitivity
4. Difficult Comparison Effect
• Making comparisons difficult between offers increases search
costs and therefore decreases price sensitivity.
© 2012 Cengage Learning. All Rights Reserved. May not be scanned, copied or duplicated, or posted to a publicly accessible website, in whole or in part.
True Economic Costs
• True Economic Costs
1. Shared Cost Effect
2. Switching Costs
3. Expenditure Effect
4. Difficult Comparison Effect
• Perceptual Challenges
5. Price Endings in 9s
6. Fairness Effect
7. Overconfidence in Future Economic
Efficiency
8. Small Pie Bias
9. Promotional Influence
10. Prospect Theory
– Losses Weigh Heavier than Gains
– Inflection at the Point of Reference
– Diminishing Sensitivity
– Risk Aversion in the Positive Frame and
Risk Seeking in the Negative Frame
– Utility Function from Prospect Theory
– Prescriptions
• Effects Related to Prospect Theory
11. Reference Price Effects
12. Endowment Effect
13. Anchoring
14. Comparison Set Effect
15. Framing Effect
16. Order Bias
17. End-benefit Effect
© 2012 Cengage Learning. All Rights Reserved. May not be scanned, copied or duplicated, or posted to a publicly accessible website, in whole or in part.
Behavioral Effects that
Influence Price Sensitivity
Price Ending in Nines
• One of the most studied
psychological influences is one that
drives prices to end in nines
– If there weren’t psychological
factors driving the tendency to end
prices in nines, we should expect a
random distribution, meaning that
each digit would end the price
about 10% of the time.
– Frequency analysis of price endings
from zero to nine reveal that prices
tend to end in nines, and less so in
fives and zeros
0% 10% 20% 30% 40% 50% 60% 70%
0
1
2
3
4
5
6
7
8
9
PricesEndingintheDigit
Occurance Frequency
© 2012 Cengage Learning. All Rights Reserved. May not be scanned, copied or duplicated, or posted to a publicly accessible website, in whole or in part.
- 24. 11/6/18
24
Debunking Hearsay on 9 endings
• A common hearsay reason for ending prices in nines is due to historical
artifact relating odd pricing and shrinkage at the cash register
• This theory is WRONG
– The theory went as follows: Even-priced merchandise would often be paid in
cash with the exact amount allowing clerks to pocket the cash. By using odd
amounts, clerks would have to use the cash register to make change, thus
making the pocketing of the customer cash by clerks obvious to shoppers as
well as book keepers who would later review the cash register tally.
– Yet if it was only a theft prevention measure, then all odd prices would be
more common than those ending in zero.
– We see from the data that clearly there is more going on in price setting than
would arise from a historical artifact.
– In fact, ending a price in nines can increase the sales of an item over other
prices.
© 2012 Cengage Learning. All Rights Reserved. May not be scanned, copied or duplicated, or posted to a publicly accessible website, in whole or in part.
• The effect of ending a price in nines
also extends beyond the last,
rightmost digit.
– Informal research has examined
selling behavior and odd price points
such as $24.99, $29.99 or $28.53,
– While the lowest price tends to sell
more than either of the higher prices
as predicted by a downward sloping
demand curve, an odd observation is
associated with the price points of
$28.53 versus $29.99
– The product sells better when priced
at $29.99 over $28.53, a direct
contradiction of economic theory.
Quantity
Price
QH
PH
QM
PM
QL
PL
Economically
Predicted
Quantity
Price
QH
PH
QM
PM
QL
PL
Observed
© 2012 Cengage Learning. All Rights Reserved. May not be scanned, copied or duplicated, or posted to a publicly accessible website, in whole or in part.
Ending in Nines Does Have Economic
Impact
• Meaning
– Prices ending in nines tends to imply discounts.
– Prices ending in zeros are suspected to imply quality
– Poster shops vs. art galleries
• Cognitive Accessibility.
– Round numbers such as zero and five are easily perceived, remembered, and
compared.
– Thus, zeros and fives may facilitate price comparison and lead to increased
price sensitivity
• Underestimation effect by Left Right encoding
– With the Arabic numeral system, consumers encode numbers from left to
right. Furthermore, the most important digits are always on the left.
– Time pressed and cognitively busy consumers attempting to make decisions
regarding value, alternatives, and tradeoffs, and are encouraged to read only
the leftmost digit and discard the remaining digits as a means to save on
mental energy and time.
– The result is an illusion is created which makes the $9.99 product appear
much cheaper than $10,00
© 2012 Cengage Learning. All Rights Reserved. May not be scanned, copied or duplicated, or posted to a publicly accessible website, in whole or in part.
Measured Behavioral Effects of Nine
Endings
- 25. 11/6/18
25
Measured Behavioral Effects of Nine
Endings
• Framing effect.
– Pricing just below the round ending price can be framed as a round number
with a small gain
– The small gain may mildly encourages a purchase on a psychological basis
– It invokes “wins” in a mental bargaining with the vendor
• Pricing endings effects are culturally dependent.
– Price endings in fives were observed to be over represented in Poland shortly
after perestroika liberalized much of the soviet block countries. The Polish
tendency for fives has been attributed to the confrontational bargaining
position of an ex-soviet Poland that led Polish consumers to perceive the 9-
ending prices as a loss above the lower round number rather than as a gain
from a higher round number
– In contrast, price endings in eights were found over represented in Asian and
Japanese countries, where the number eight represents luck and prosperity
© 2012 Cengage Learning. All Rights Reserved. May not be scanned, copied or duplicated, or posted to a publicly accessible website, in whole or in part.
Fairness Effect
• Marshall’s and Smith’s microeconomic theory is
structured on the assumption of a self-interest as the
sole primary motive.
– If prices are perceived as too high for the benefits
delivered, customers are free not to purchase.
– Likewise, if prices are too low for a business to persist, they
are free not to produce.
– However such a cursory examination of fairness issues in
trading does a pricing, sales, and marketing professional
disservice.
• In trading, the concept of fairness is persistently
present.
© 2012 Cengage Learning. All Rights Reserved. May not be scanned, copied or duplicated, or posted to a publicly accessible website, in whole or in part.
Fairness & The Brain
• Findings in brain physiology, especially evolutionary
neuroscience, show that the transactional commercial
market evolved from the interplay of our self-
preservational (egoistic) and affectional (empathetic)
neural circuitries.
– Thus, sharing within families, gift giving, and commercial
activities are all reliant upon an overlapping set of cognitive
functions.
– The presence of sharing motives in commercial transactions
drives expectations with respect to price and benefits.
– Consumers expect that the price represents a sharing of the
surplus benefits between the company and the customer.
– When prices are out of line with these expectations, customers
can call foul and the fairness effect will dampen consumer
willingness to pay.
© 2012 Cengage Learning. All Rights Reserved. May not be scanned, copied or duplicated, or posted to a publicly accessible website, in whole or in part.
- 26. 11/6/18
26
Fairness Perceptions
• Customers perceive prices as fair when they are within
expectations based on past interaction with the
category
– Large price increases can be misperceived as “profit
taking” on behalf of suppliers and producers, or as taking
advantage of less powerful customers.
• Customers perceive prices as unfair when they vary
randomly between customers
– This latter effect plagued Amazon in 2005 when customers
uncovered price experimentation and discrimination at
their website.
• The issue of fairness is not spread equally among all
products. It has a larger role in necessity goods than
those related to discretionary purchase.
© 2012 Cengage Learning. All Rights Reserved. May not be scanned, copied or duplicated, or posted to a publicly accessible website, in whole or in part.
Overconfidence in Future Economic
Efficiency
• With some products, customers purchase them with an expectation of
performing in some specific behavioral pattern in the future, however
people are systematically poor in their ability to predict their own future
behavior
• Example: Customers selected from a contract of menus from three U.S.
health clubs.
– Members who choose a monthly subscription over priced at $70 attended the
gym on average 4.3 times per month, making a per-visit price of more than
$17. These same members could have selected to pay $10 per visit using a 10-
vist pass.
– Furthermore, customers who chose the monthly subscription were 17% more
likely to stay enrolled past the first year than annual members, which is
surprising due to the fact that monthly members pay a higher fee for the
privilege of cancelling their contract at will.
– The inability of expressed behavior to match expected behavior was attributed
to overconfidence by the customers with respect to their future self-control
and future economic efficiency.
© 2012 Cengage Learning. All Rights Reserved. May not be scanned, copied or duplicated, or posted to a publicly accessible website, in whole or in part.
Small Pie Bias
• The Small pie bias is found from
research on negotiations
– Negotiators consistently
underestimate the size of the
bargaining zone, or in other
words, believe they are
negotiating over a smaller pie
than truly exists.
– By implication, they over
estimate the share of the surplus
they capture in the negotiation.
– In other words, the small pie bias
leads sellers to settle for too little
of a price.
© 2012 Cengage Learning. All Rights Reserved. May not be scanned, copied or duplicated, or posted to a publicly accessible website, in whole or in part.
- 27. 11/6/18
27
Overcoming the Small Pie Bias
• To overcome the small pie bias, it is suggested that sellers
make price expectations of the buyers reservation price,
and use the negotiation to seek disconfirming information
that updates their beliefs of the buyer’s reservation price.
– The disconfirming information is elicited from buyers by sellers
when sellers make initial offers that are outside of their
expected buyer reservation price.
– In the negotiation, they can use buyer reactions to update their
expectations of they buyers reservation price, and thus price the
transaction closer to the buyers reservation price.
© 2012 Cengage Learning. All Rights Reserved. May not be scanned, copied or duplicated, or posted to a publicly accessible website, in whole or in part.
Promotional Sensitivity
• Promotions influence price optimization
through two key paths:
1. The message communicated affects price
sensitivity.
2. The market attracted through promotions
holds a different price sensitivity than the
market overall
© 2012 Cengage Learning. All Rights Reserved. May not be scanned, copied or duplicated, or posted to a publicly accessible website, in whole or in part.
What You Say Influences their
Willingness to Pay
• Price oriented promotions leads towards both lower prices and increased
consumer price sensitivity.
– One form of price oriented promotions are those that focus on the brand and
the price alone.
– Such promotions are commonly found in local circulars prepared with
distributors to highlight the availability of a well known brand at a local outlet.
• Value oriented promotions, tend to lead to lower price sensitivity of
consumers.
– Value oriented promotions are those which focus on the brand and the
features or benefits of the product.
– They are commonly found in national advertising efforts which are driven by
the original producing firm.
• The effect of promotional messages has also been found in negotiations
research.
– Using key selling points enables sellers to achieve a higher final transaction
prices in a negotiation.
© 2012 Cengage Learning. All Rights Reserved. May not be scanned, copied or duplicated, or posted to a publicly accessible website, in whole or in part.
- 28. 11/6/18
28
Who You Talk to Influences Willingness
to Pay
• The secondary effect of promotions on price
sensitivity arises from the ability of advertising to
increase the size of the addressable market.
– Advertising sensitive consumers tend to be more price
sensitive consumers.
– By bringing new customer into the market that are
more price sensitive than the market overall,
advertising has an indirect effect of overall increasing
the price sensitivity of the market.
© 2012 Cengage Learning. All Rights Reserved. May not be scanned, copied or duplicated, or posted to a publicly accessible website, in whole or in part.
Perceptual Challenges
• Price Endings in 9s
– Meaning, Accessibility, Encoding, Framing all imply price endings influence
price acceptance
• Fairness Effect
– The expectation of fairness increases with economic sophistication, and
influences price changes, differentials, and discrimination
• Overconfidence in Future Economic Efficiency
– People believe are overconfident in their ability to change outcomes and
behave in an economically efficient manner
• Small Pie Bias
– Negotiators routinely believe the range of acceptable prices is smaller than it
is, and moreover anchor their expectation price around their walk-away price
• Promotional Influence
– What you say and who you say it to influences the ability to capture a good
price
© 2012 Cengage Learning. All Rights Reserved. May not be scanned, copied or duplicated, or posted to a publicly accessible website, in whole or in part.
Behavioral Effects that
Influence Price Sensitivity
• True Economic Costs
1. Shared Cost Effect
2. Switching Costs
3. Expenditure Effect
4. Difficult Comparison Effect
• Perceptual Challenges
5. Price Endings in 9s
6. Fairness Effect
7. Overconfidence in Future Economic
Efficiency
8. Small Pie Bias
9. Promotional Influence
10. Prospect Theory
– Losses Weigh Heavier than Gains
– Inflection at the Point of Reference
– Diminishing Sensitivity
– Risk Aversion in the Positive Frame and
Risk Seeking in the Negative Frame
– Utility Function from Prospect Theory
– Prescriptions
• Effects Related to Prospect Theory
11. Reference Price Effects
12. Endowment Effect
13. Anchoring
14. Comparison Set Effect
15. Framing Effect
16. Order Bias
17. End-benefit Effect
© 2012 Cengage Learning. All Rights Reserved. May not be scanned, copied or duplicated, or posted to a publicly accessible website, in whole or in part.
- 29. 11/6/18
29
Prospect Theory
• The research question asked: How are people
systematically non-utility maximizing?
– Basic tenet of economics is that people seek to
maximize their utility in a transaction
– Numerous studies have found aberrations to this basic
tenet, ways in which humans are predictably irrational
– Prospect Theory attempts to define fundamental
heuristics to predict how humans are predictably
irrational
– It does so by asking: How do people choose among
risky prospects
© 2012 Cengage Learning. All Rights Reserved. May not be scanned, copied or duplicated, or posted to a publicly accessible website, in whole or in part.
NON-Utility Maximizing
Which offer would you accept
50% Chance at € 10,000 € 4,500 with certainty
50% Chance of Loosing
€ 10,000
Loosing € 4,500
with certainty
© 2012 Cengage Learning. All Rights Reserved. May not be scanned, copied or duplicated, or posted to a publicly accessible website, in whole or in part.
Prospect Theory
• Prospect Theory examines predictable manners in
which human beings (customers) reliably make choices
which fail to maximize their utility, all else held equal
• Prospect Theory explains many consumer behavioral
effects, and therefore, strategic pricing opportunities
• More recent research is uncovering neural links which
explain prospect theory with respect to evolutionary
pressures
© 2012 Cengage Learning. All Rights Reserved. May not be scanned, copied or duplicated, or posted to a publicly accessible website, in whole or in part.
- 30. 11/6/18
30
Losses loom larger than gains
• The aggravation that one experiences in losing
a sum of money appears to be greater than
the pleasure associated with gaining the same
amount.
• Utility functions for losses are considerably
steeper than those for gains.
© 2012 Cengage Learning. All Rights Reserved. May not be scanned, copied or duplicated, or posted to a publicly accessible website, in whole or in part.
Shift of Reference
• Imagine a person who is involved in a business venture, has already lost
$2000, and is now facing a choice between a sure gain of $1000 and a 50%
chance to win $2000 or nothing
• If he has not yet adapted to his losses, he is likely to code the problem as a
choice between -$2000 @ 50% and -$1000 rather than a choice between
$2000 @ 50% and $1000
• He is more likely to take the risky choice when he views the prospective
outcomes from the first frame than the second
• The fact that the tendency to bet on long-shots increases in the course of
the betting day provides support for the hypothesis that a failure to adapt
to losses induces risk taking
© 2012 Cengage Learning. All Rights Reserved. May not be scanned, copied or duplicated, or posted to a publicly accessible website, in whole or in part.
Diminishing Sensitivity
• Our perceptual apparatus is attuned to the evaluation of changes or
differences rather than to the evaluation of absolute magnitude.
• It is easier to discriminate between a change of 3° and a change of 6° in
room temperature than it is to discriminate between a change of 13° and
change of 16°.
• Thus, the difference in value between the gain of 100 and the gain of 200
appears to be greater than the difference between a gain of 1100 and a
gain of 1200.
• Similarly, the difference between a loss of 100 and a loss of 200 appears to
be greater than the difference between a loss of 1100 and a loss of 1200.
• The marginal value of both losses and gains decreases with their
magnitude.
© 2012 Cengage Learning. All Rights Reserved. May not be scanned, copied or duplicated, or posted to a publicly accessible website, in whole or in part.
- 31. 11/6/18
31
Reflection Effect
• Choices made in the negative frame are the mirror of
those made in the positive frame
• Risk aversion in the positive domain is accompanied by
risk seeking in the negative domain
– People eschew risks when the risks reduce the chance that
something very pleasurable will happen
– People seek risks when the risks reduce the chance that
something very painful will happen
• Certainty increases aversion to losses as well as
desirability of gains
© 2012 Cengage Learning. All Rights Reserved. May not be scanned, copied or duplicated, or posted to a publicly accessible website, in whole or in part.
More Loss Averse than Gain Seeking
• A $10 loss causes more pain
than a $10 gain causes pleasure
Losses
B
Value –
(Pain)
Value +
(Pleasure)
Gains
A
Perceived
Real
Highlight GainMinimize Pain
© 2012 Cengage Learning. All Rights Reserved. May not be scanned, copied or duplicated, or posted to a publicly accessible website, in whole or in part.
© 2012 Cengage Learning. All Rights Reserved. May not be scanned, copied or duplicated, or posted to a publicly accessible website, in whole or in part.
Declining Sensitivity
• Two $5 losses cause more pain than
one $10 loss
• Two $5 gains cause more pleasure
than one $10 gain
• Both losses and gains suffer from
declining perceived impact
Unbundle GainBundle Pain
Losses
B
Value -
Value +
Gains
A
Value Function
Perceived
Real
- 32. 11/6/18
32
Certainty and Pricing
• Price Guarantees
• Guarantees to match or better the lowest price accelerate customer
purchases
– Consumers are uncertain of their ability to attain the lowest price at any
particular retail outlet
– Promises to ensure the lowest price or reimbursing with a check for the
difference enables customers to purchase with greater confidence
• Uses
– Infrequently purchased consumer goods
– Matches lowest price in the market (Orbitz), matches lowest advertised price
(electronics), or redeems competitors coupons (grocers)
• Result
– Higher volumes
– Potential to reduce competitive price pressure and shift the pressure to other
dimensions of competition (costs, customer experience, distribution,
promotion, etc.)
© 2012 Cengage Learning. All Rights Reserved. May not be scanned, copied or duplicated, or posted to a publicly accessible website, in whole or in part.
Reference Point Sensitivity
• People are more averse to a 5%
chance of not receiving $50
than a 95% chance of gaining
$50
Losses
B
Value -
Value +
Gains
A
Value Function
© 2012 Cengage Learning. All Rights Reserved. May not be scanned, copied or duplicated, or posted to a publicly accessible website, in whole or in part.
Reframe Pains as Gains
Reference Point Management and
Sales
• Placing the product in customers’ hands at
bazaars
– Increases the “instant endowment effect”, thus
increasing their willingness to pay
• Asking customers to imagine the positive
implications of using the product
– If you had $5,000 more to invest in your company,
what would you do with it?
– Our offer will save you that $5,000 in the next 12
months so you can achieve your goal.
© 2012 Cengage Learning. All Rights Reserved. May not be scanned, copied or duplicated, or posted to a publicly accessible website, in whole or in part.
- 33. 11/6/18
33
Overarching Insights from Prospect
Theory
• Organisms habituate
to steady states
• The marginal
response to changes
is diminishing
• Pain is more urgent
than pleasure
© 2012 Cengage Learning. All Rights Reserved. May not be scanned, copied or duplicated, or posted to a publicly accessible website, in whole or in part.
Losses
B
Value -
Value +
Gains
A
Value Function
Prospect Theory
It’s Real. It’s Human. It’s Usable.
• Utility theory in economics assumes humans are “rational”.
• We aren’t, or at least not rational in the sense that utility
theory predicts.
• Behavioral economics, from evolutionary, neural activity,
and experimental studies, better describes how customers
make purchasing decisions.
• Sales and Marketing Executives can use these insights to
influence price acceptance and deal flow.
© 2012 Cengage Learning. All Rights Reserved. May not be scanned, copied or duplicated, or posted to a publicly accessible website, in whole or in part.
• True Economic Costs
1. Shared Cost Effect
2. Switching Costs
3. Expenditure Effect
4. Difficult Comparison Effect
• Perceptual Challenges
5. Price Endings in 9s
6. Fairness Effect
7. Overconfidence in Future Economic
Efficiency
8. Small Pie Bias
9. Promotional Influence
10. Prospect Theory
– Losses Weigh Heavier than Gains
– Inflection at the Point of Reference
– Diminishing Sensitivity
– Risk Aversion in the Positive Frame and
Risk Seeking in the Negative Frame
– Utility Function from Prospect Theory
– Prescriptions
• Effects Related to Prospect Theory
11. Reference Price Effects
12. Endowment Effect
13. Anchoring
14. Comparison Set Effect
15. Framing Effect
16. Order Bias
17. End-benefit Effect
© 2012 Cengage Learning. All Rights Reserved. May not be scanned, copied or duplicated, or posted to a publicly accessible website, in whole or in part.
Behavioral Effects that Influence Price
Sensitivity
- 34. 11/6/18
34
Reference Price Effect
• The reference price effect refers to the influence
that past prices observed by customers within a
category have on the expectation prices they hold
– Buyers often are not able to remember the prices of
items they had recently purchased.
– Even though consumers don’t have perfect recall of
past observed prices, what recall they do hold
influences their willingness to pay, or reference price.
– The reference price effect has been studied largely in
frequently purchased consumer goods markets and
can be expected to hold in other markets as well.
© 2012 Cengage Learning. All Rights Reserved. May not be scanned, copied or duplicated, or posted to a publicly accessible website, in whole or in part.
Reference Price Challenges
• Consumer price expectations can
be modeled as an exponential
smoothing of current and last
observed prices
– RPt = aPt-1 + (1-a)Pt
• Promotional discounts reset price
expectations to a lower level,
dampening demand in future
periods when the product is
offered at full price
• Full price periods will increase
price expectations, increasing
demand during promotional
periods
© 2012 Cengage Learning. All Rights Reserved. May not be scanned, copied or duplicated, or posted to a publicly accessible website, in whole or in part.
Time
Price
Reference
Price
Observed
Price
Reference Price Effect and Promotions
• Firms cycling between periods of sales promotions and
regular price periods are therefore exasperating the sharp
increase in demand during the sales promotion and sharp
decline in demand following the sales promotion.
– If that firm is using a profit sensitivity analysis alone to guide
their use of sales promotions, they may be misled into
constantly holding sales promotion, and furthermore increasing
the size of the discount, in order to continue stimulating
demand.
– The result would be a disastrous implosion of price and
destruction of profits.
– To prevent this, the reference price effect is one of many
reasons pricing professionals must go beyond purely
quantitative analysis in managing price promotions.
© 2012 Cengage Learning. All Rights Reserved. May not be scanned, copied or duplicated, or posted to a publicly accessible website, in whole or in part.
- 35. 11/6/18
35
Endowment Effect
• According to the endowment effect, people
place more value in something once they
possess it than they otherwise would.
• The endowment effect was observed from
experiments in which students were given
items and then allowed to make trades in
order to optimize their gift.
• The trades didn’t occur.
© 2012 Cengage Learning. All Rights Reserved. May not be scanned, copied or duplicated, or posted to a publicly accessible website, in whole or in part.
Mug Valuations
• Decorated mugs (retail value of about $5) were placed in front of one-
third of a group of students
• To recipients of the mug - You now own the object in your possession. You
have the option of selling it if a price, which will be determined later, is
acceptable to you. What is your minimum asking price?
• To students without a mug - You have the option to either receive a mug
or a sum of money to be determined later. What is the minimum amount
of cash you would accept instead of receiving the mug?
• Average Asking Price from Mug Holders $7.12
• Average Bid Price from Non-Mug Holders $3.12
• Possessing the mug instantly increased the value
© 2012 Cengage Learning. All Rights Reserved. May not be scanned, copied or duplicated, or posted to a publicly accessible website, in whole or in part.
Anchoring
• People anchor price expectations based upon
information gathered early in the decision making
process.
• Once they have anchored on the initial information,
changing expectations can be difficult as it involves
relearning or uncovering new evidence that
demonstrates the fallacy of applying earlier formed
expectations in the current situation.
• Anchoring strongly sets consumer reservation prices.
© 2012 Cengage Learning. All Rights Reserved. May not be scanned, copied or duplicated, or posted to a publicly accessible website, in whole or in part.
- 36. 11/6/18
36
Comparison Set Influence
• Customer’s price expectations are influenced by the alternatives
under consideration when making a purchase decision
– When lower priced goods are in the comparison set, customers tend
to have lower price expectations.
– When higher priced goods are in the comparison set, customers tend
to have higher price expectations.
• Adjust the comparison set towards a more favorable group.
– For instance, comparing a the price of a small car to that of a larger,
more expensive car rather than the price of a motorcycle or
alternative means of transportation.
• Include other factors
– For instance, consider a product that has a lower overall cost of
ownership than its next nearest competitor, but a higher upfront cost.
– Sellers can expand the price comparison to include total lifetime costs
rather than simply purchase price.
© 2012 Cengage Learning. All Rights Reserved. May not be scanned, copied or duplicated, or posted to a publicly accessible website, in whole or in part.
Framing Effect
• Research into the framing effect shows that
how a transaction is framed can affect the
customers willingness to pay.
© 2012 Cengage Learning. All Rights Reserved. May not be scanned, copied or duplicated, or posted to a publicly accessible website, in whole or in part.
Order Bias
• Order Bias, an effect related to anchoring, is
found in the selection of acceptable prices and
products.
– The order of presentation of prices effects the
selection of customers of products and acceptable
prices.
– With fast moving consumer good, the highest average
price was obtained when prices were presented in
descending order.
– The order bias was not statistically observed for
household appliances in some studies, yet it is still
suspected to hold outside of the FMCG market.
© 2012 Cengage Learning. All Rights Reserved. May not be scanned, copied or duplicated, or posted to a publicly accessible website, in whole or in part.
- 37. 11/6/18
37
Loss Aversion and Order Bias
© 2012 Cengage Learning. All Rights Reserved. May not be scanned, copied or duplicated, or posted to a publicly accessible website, in whole or in part.
NIS at $69
NAV at $39
N360 at $79
NIS at $69
NAV at $39
N360 at $79
DescendingAscending
• Loss aversion: In comparison to a reference point, consumers are
more averse to losses than they are seeking of gains to that
reference point.
• On average, consumers tend to select a higher priced product when
presented in descending order rather than ascending order.
Offer Order
• Supports common practice for sales and marketing
communications to present a range of optional
products within the same category by starting at the
highest price product first and moving down.
– The belief is that many consumers will rest upon a higher
priced good rather than continue to exhaust all the
purchasing possibilities by moving throughout the price
points from highest to lowest.
– Thus, in sales of automobiles, mattresses, and other
consumer durables, it is common practice to show models
starting from the most expensive item and moving
downward from there.
– Also works in business markets
© 2012 Cengage Learning. All Rights Reserved. May not be scanned, copied or duplicated, or posted to a publicly accessible website, in whole or in part.
End-Benefit Influence
• Price sensitivity is influenced by the amount the product contributes to
the end benefits sought by a customer
– Products that contribute a high portion of the end-benefit sought by a
customer are associated with lower price sensitivity than those which are
ancillary to the end-benefit sought.
• The end-benefit effect has implications for promotional messages.
– In promoting a product, marketers are wise to stress relation of product to
goal attainment rather than simply focus on its features and attributes.
– For instance, Nutrisystem promotes its diet not on the basis of providing
packaged food products and only partially on the ability of the Nutrisystem
diet to encourage weight loss. The focal message of Nutrisystem is that their
diet enables customers to look better, be healthier, and command a positive
impression at special occasions.
– Position offerings as tightly related to the full end-benefit can make customers
less cost sensitive.
© 2012 Cengage Learning. All Rights Reserved. May not be scanned, copied or duplicated, or posted to a publicly accessible website, in whole or in part.
- 38. 11/6/18
38
11. Reference Price Effects
• Past prices observed by customers influence expected prices to pay.
12. Endowment Effect
• The moment someone has an item, they place greater value on it than they otherwise would.
13. Anchoring
• People anchor price expectations based upon information gathered early in the decision making
process.
14. Comparison Set Effect
• Customer’s price expectations are influenced by the alternatives under consideration when making
a purchase decision. Lower priced alternatives decrease price expectations. Higher priced
alternatives increase price expectations.
15. Framing Effect
• The frame through which a customer perceives an offer influences their willingness to pay.
16. Order Bias
• Present any range of optional products within the same category by starting at the highest price
product first and moving down.
17. End-benefit Effect
• Position offerings as tightly related to the full end-benefit can make customers less cost sensitive.
© 2012 Cengage Learning. All Rights Reserved. May not be scanned, copied or duplicated, or posted to a publicly accessible website, in whole or in part.
Perceptual Challenges
Behavioral Effects that
Influence Price Sensitivity
• True Economic Costs
1. Shared Cost Effect
2. Switching Costs
3. Expenditure Effect
4. Difficult Comparison Effect
• Perceptual Challenges
5. Price Endings in 9s
6. Fairness Effect
7. Overconfidence in Future Economic
Efficiency
8. Small Pie Bias
9. Promotional Influence
10. Prospect Theory
– Losses Weigh Heavier than Gains
– Inflection at the Point of Reference
– Diminishing Sensitivity
– Risk Aversion in the Positive Frame and
Risk Seeking in the Negative Frame
– Utility Function from Prospect Theory
– Prescriptions
• Effects Related to Prospect Theory
11. Reference Price Effects
12. Endowment Effect
13. Anchoring
14. Comparison Set Effect
15. Framing Effect
16. Order Bias
17. End-benefit Effect
© 2012 Cengage Learning. All Rights Reserved. May not be scanned, copied or duplicated, or posted to a publicly accessible website, in whole or in part.
Summary
• Price cannot be quantitative optimized in the
absence of considering qualitative influences.
• There are many psychological, decision bias,
neurological, and behavioral effects that
influence how customers perceive prices, make
evaluations, and select between competing
offers.
• Sales and marketing executives can use the
effects to influence price acceptance and improve
profit capture.
© 2012 Cengage Learning. All Rights Reserved. May not be scanned, copied or duplicated, or posted to a publicly accessible website, in whole or in part.