Learning & CourseOutcomes
LO1: To understand Dimensionality Reduction Techniques
LO2: To differentiate Types of Techniques
CO2: Evaluate and analyze process and thread scheduling
techniques, discerning their benefits and challenges.
5.
Introduction: Dimensionality Reduction
The number of input features, variables, or columns present in a given dataset is
known as dimensionality, and the process to reduce these features is called
dimensionality reduction.
A dataset contains a huge number of input features in various cases, which makes the
predictive modeling task more complicated. Because it is very difficult to visualize
or make predictions for the training dataset with a high number of features, for such
cases, dimensionality reduction techniques are required to use.
Dimensionality reduction technique can be defined as, "It is a way of converting the
higher dimensions dataset into lesser dimensions dataset ensuring that it provides
similar information.’’
It is commonly used in the fields that deal with high-dimensional data, such as
speech recognition, signal processing, bioinformatics, etc. It can also be used for data
visualization, noise reduction, cluster analysis, etc.
6.
The Curse ofDimensionality
Handling the high-dimensional data is very difficult in practice, commonly known as
the curse of dimensionality.
If the dimensionality of the input dataset increases, any machine learning algorithm
and model becomes more complex.
As the number of features increases, the number of samples also gets increased
proportionally, and the chance of overfitting also increases.
If the machine learning model is trained on high-dimensional data, it becomes
overfitted and results in poor performance.
7.
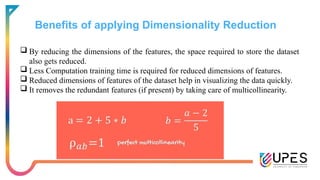
Benefits of applyingDimensionality Reduction
By reducing the dimensions of the features, the space required to store the dataset
also gets reduced.
Less Computation training time is required for reduced dimensions of features.
Reduced dimensions of features of the dataset help in visualizing the data quickly.
It removes the redundant features (if present) by taking care of multicollinearity.
8.
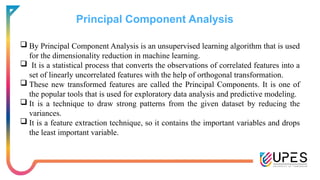
Principal Component Analysis
By Principal Component Analysis is an unsupervised learning algorithm that is used
for the dimensionality reduction in machine learning.
It is a statistical process that converts the observations of correlated features into a
set of linearly uncorrelated features with the help of orthogonal transformation.
These new transformed features are called the Principal Components. It is one of
the popular tools that is used for exploratory data analysis and predictive modeling.
It is a technique to draw strong patterns from the given dataset by reducing the
variances.
It is a feature extraction technique, so it contains the important variables and drops
the least important variable.
9.
Principal Components inPCA
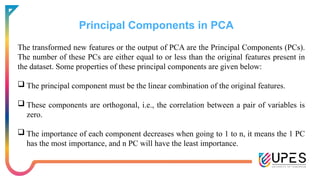
The transformed new features or the output of PCA are the Principal Components (PCs).
The number of these PCs are either equal to or less than the original features present in
the dataset. Some properties of these principal components are given below:
The principal component must be the linear combination of the original features.
These components are orthogonal, i.e., the correlation between a pair of variables is
zero.
The importance of each component decreases when going to 1 to n, it means the 1 PC
has the most importance, and n PC will have the least importance.
10.
MCQs
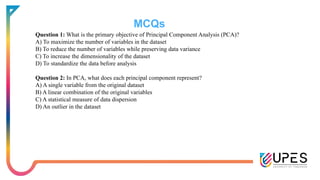
Question 1: Whatis the primary objective of Principal Component Analysis (PCA)?
A) To maximize the number of variables in the dataset
B) To reduce the number of variables while preserving data variance
C) To increase the dimensionality of the dataset
D) To standardize the data before analysis
Question 2: In PCA, what does each principal component represent?
A) A single variable from the original dataset
B) A linear combination of the original variables
C) A statistical measure of data dispersion
D) An outlier in the dataset
11.
Answers
Answer 1: B)To reduce the number of variables while preserving data variance
Answer 2 : B) A linear combination of the original variables
12.
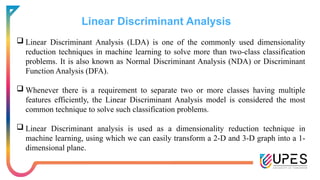
Linear Discriminant Analysis
Linear Discriminant Analysis (LDA) is one of the commonly used dimensionality
reduction techniques in machine learning to solve more than two-class classification
problems. It is also known as Normal Discriminant Analysis (NDA) or Discriminant
Function Analysis (DFA).
Whenever there is a requirement to separate two or more classes having multiple
features efficiently, the Linear Discriminant Analysis model is considered the most
common technique to solve such classification problems.
Linear Discriminant analysis is used as a dimensionality reduction technique in
machine learning, using which we can easily transform a 2-D and 3-D graph into a 1-
dimensional plane.
13.
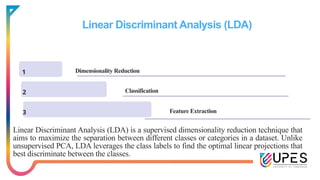
Linear Discriminant Analysis(LDA)
1 Dimensionality Reduction
2
3 Feature Extraction
Linear Discriminant Analysis (LDA) is a supervised dimensionality reduction technique that
aims to maximize the separation between different classes or categories in a dataset. Unlike
unsupervised PCA, LDA leverages the class labels to find the optimal linear projections that
best discriminate between the classes.
Classification
14.
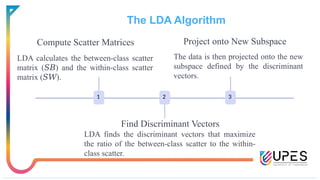
The LDA Algorithm
ComputeScatter Matrices Project onto New Subspace
LDA calculates the between-class scatter
matrix ( ) and the within-class scatter
𝑆𝐵
matrix ( ).
𝑆𝑊
The data is then projected onto the new
subspace defined by the discriminant
vectors.
1 2 3
Find Discriminant Vectors
LDA finds the discriminant vectors that maximize
the ratio of the between-class scatter to the within-
class scatter.
15.
Dimensionality Reduction withLDA
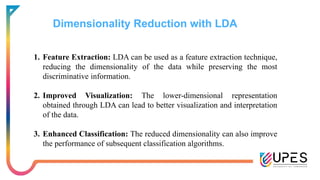
1. Feature Extraction: LDA can be used as a feature extraction technique,
reducing the dimensionality of the data while preserving the most
discriminative information.
2. Improved Visualization: The lower-dimensional representation
obtained through LDA can lead to better visualization and interpretation
of the data.
3. Enhanced Classification: The reduced dimensionality can also improve
the performance of subsequent classification algorithms.
16.
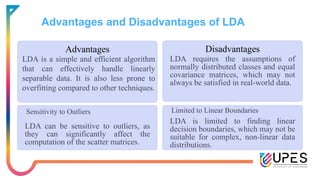
Advantages and Disadvantagesof LDA
Advantages Disadvantages
LDA requires the assumptions of
normally distributed classes and equal
covariance matrices, which may not
always be satisfied in real-world data.
Sensitivity to Outliers
LDA can be sensitive to outliers, as
they can significantly affect the
computation of the scatter matrices.
Limited to Linear Boundaries
LDA is limited to finding linear
decision boundaries, which may not be
suitable for complex, non-linear data
distributions.
LDA is a simple and efficient algorithm
that can effectively handle linearly
separable data. It is also less prone to
overfitting compared to other techniques.
17.
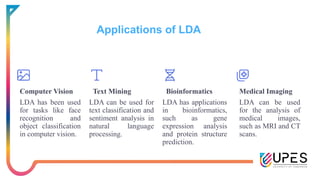
Applications of LDA
ComputerVision
LDA has been used
for tasks like face
recognition and
object classification
in computer vision.
Text Mining
LDA can be used for
text classification and
sentiment analysis in
natural language
processing.
Bioinformatics
LDA has applications
in bioinformatics,
such as gene
expression analysis
and protein structure
prediction.
Medical Imaging
LDA can be used
for the analysis of
medical images,
such as MRI and CT
scans.
18.
Question 1: Whatis the primary goal of Linear Discriminant Analysis (LDA)?
A) To reduce the dimensionality of the dataset
B) To maximize the variance within each class
C) To find the principal components of the dataset
D) To find a linear combination of features that characterizes or separates two or more classes
Answer: D) To find a linear combination of features that characterizes or separates two or more classes
Question 2: How does LDA differ from PCA?
A) LDA aims to maximize the variance within each class, while PCA maximizes total variance in the dataset
B) LDA is used for unsupervised learning, while PCA is used for supervised learning
C) LDA does not involve eigen decomposition, unlike PCA
D) LDA does not perform dimensionality reduction, unlike PCA
Answer: A) LDA aims to maximize the variance within each class, while PCA maximizes total variance in the
dataset
Question 3: In LDA, what are the key components used to classify data points?
A) Covariance matrix and eigenvalues
B) Mean vectors and covariance matrix
C) Principal components and variance explained
D) Regression coefficients and residuals
Answer: B) Mean vectors and covariance matrix
19.
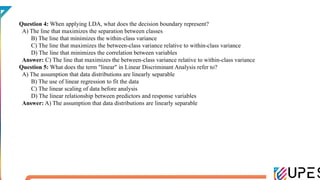
Question 4: Whenapplying LDA, what does the decision boundary represent?
A) The line that maximizes the separation between classes
B) The line that minimizes the within-class variance
C) The line that maximizes the between-class variance relative to within-class variance
D) The line that minimizes the correlation between variables
Answer: C) The line that maximizes the between-class variance relative to within-class variance
Question 5: What does the term "linear" in Linear Discriminant Analysis refer to?
A) The assumption that data distributions are linearly separable
B) The use of linear regression to fit the data
C) The linear scaling of data before analysis
D) The linear relationship between predictors and response variables
Answer: A) The assumption that data distributions are linearly separable
20.
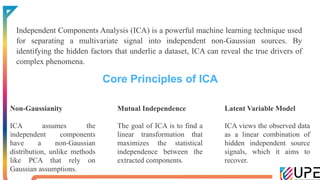
Independent Components Analysis(ICA) is a powerful machine learning technique used
for separating a multivariate signal into independent non-Gaussian sources. By
identifying the hidden factors that underlie a dataset, ICA can reveal the true drivers of
complex phenomena.
Core Principles of ICA
Non-Gaussianity
ICA assumes the
independent components
have a non-Gaussian
distribution, unlike methods
like PCA that rely on
Gaussian assumptions.
Mutual Independence
The goal of ICA is to find a
linear transformation that
maximizes the statistical
independence between the
extracted components.
Latent Variable Model
ICA views the observed data
as a linear combination of
hidden independent source
signals, which it aims to
recover.
21.
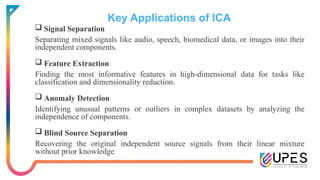
Key Applications ofICA
Signal Separation
Separating mixed signals like audio, speech, biomedical data, or images into their
independent components.
Feature Extraction
Finding the most informative features in high-dimensional data for tasks like
classification and dimensionality reduction.
Anomaly Detection
Identifying unusual patterns or outliers in complex datasets by analyzing the
independence of components.
Blind Source Separation
Recovering the original independent source signals from their linear mixture
without prior knowledge.
22.
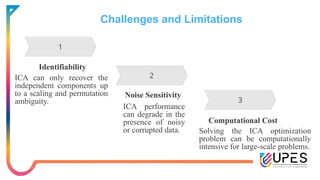
Challenges and Limitations
Identifiability
ICAcan only recover the
independent components up
to a scaling and permutation
ambiguity.
Noise Sensitivity
ICA performance
can degrade in the
presence of noisy
or corrupted data.
Computational Cost
Solving the ICA optimization
problem can be computationally
intensive for large-scale problems.
23.
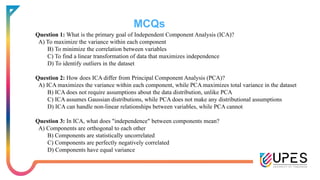
MCQs
Question 1: Whatis the primary goal of Independent Component Analysis (ICA)?
A) To maximize the variance within each component
B) To minimize the correlation between variables
C) To find a linear transformation of data that maximizes independence
D) To identify outliers in the dataset
Question 2: How does ICA differ from Principal Component Analysis (PCA)?
A) ICA maximizes the variance within each component, while PCA maximizes total variance in the dataset
B) ICA does not require assumptions about the data distribution, unlike PCA
C) ICA assumes Gaussian distributions, while PCA does not make any distributional assumptions
D) ICA can handle non-linear relationships between variables, while PCA cannot
Question 3: In ICA, what does "independence" between components mean?
A) Components are orthogonal to each other
B) Components are statistically uncorrelated
C) Components are perfectly negatively correlated
D) Components have equal variance
24.
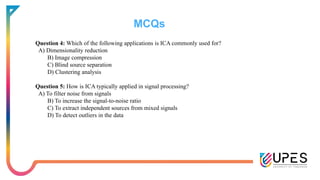
MCQs
Question 4: Whichof the following applications is ICA commonly used for?
A) Dimensionality reduction
B) Image compression
C) Blind source separation
D) Clustering analysis
Question 5: How is ICA typically applied in signal processing?
A) To filter noise from signals
B) To increase the signal-to-noise ratio
C) To extract independent sources from mixed signals
D) To detect outliers in the data
25.
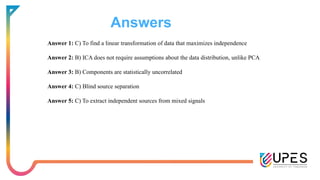
Answers
Answer 1: C)To find a linear transformation of data that maximizes independence
Answer 2: B) ICA does not require assumptions about the data distribution, unlike PCA
Answer 3: B) Components are statistically uncorrelated
Answer 4: C) Blind source separation
Answer 5: C) To extract independent sources from mixed signals
26.
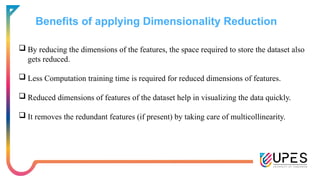
Benefits of applyingDimensionality Reduction
By reducing the dimensions of the features, the space required to store the dataset also
gets reduced.
Less Computation training time is required for reduced dimensions of features.
Reduced dimensions of features of the dataset help in visualizing the data quickly.
It removes the redundant features (if present) by taking care of multicollinearity.
27.
References
1. Tharwat, A.(2016). Principal component analysis-a tutorial. International Journal of Applied Pattern
Recognition, 3(3), 197-240.
2. Jolliffe, I. T. (2002). Principal component analysis. Wiley Online Library.
3. Hyvärinen, A., & Oja, E. (2000). Independent component analysis: Algorithms and applications. Neural
Networks, 13(4-5), 411-430.
4. Su, S., Li, S., Xu, T., & Gong, P. (2020). A sparse principal component analysis method with applications to
genome-wide association studies. Statistical Applications in Genetics and Molecular Biology, 19(4), Article 5.
5. Li, M., Ma, Y., & Zhou, M. (2022). Robust linear discriminant analysis. Journal of Machine Learning Research,
23(37), 1-38.
6. Hyvärinen, A., & Karhunen, J. (2021). Fast and robust fixed-point algorithms for independent component
analysis. IEEE Transactions on Neural Networks and Learning Systems, 32(1), 334-346.