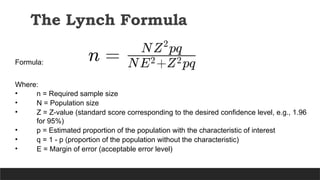
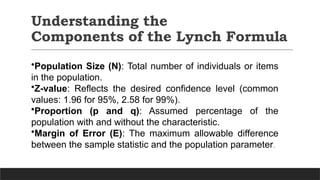
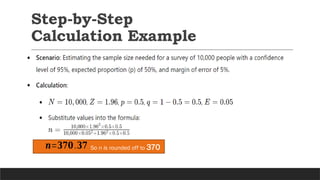
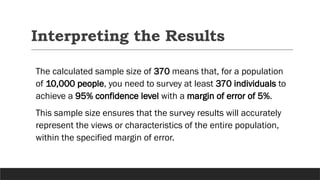
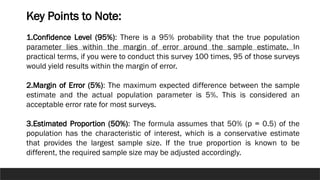
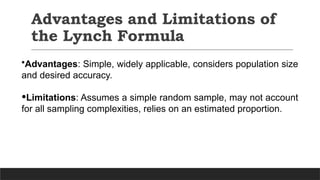
Understanding
the Lynch
Formula in
Statistics
A K E Y TO O L FO R R E L I A B I L I T Y
M E A S U R E M E N T
CHERIELYN V. TABANGIN
Introduction to the Lynch
Formula
Definition: The Lynch Formula is a statistical formula used to
calculate the minimum sample size needed for a survey or study.
•Developed by John Lynch, it provides a way to measure how
consistently a test performs over time or across different groups.
Purpose: To ensure that the sample size is sufficient to represent
the population accurately while considering cost and logistical
constraints.
Importance of Reliability in
Statistics
Definition of Reliability:
•The degree to which an assessment tool
produces stable and consistent results.
Why Reliability Matters:
•Ensures the accuracy and consistency of data.
•Helps in making valid inferences from the data
collected.
The Lynch Formula
Formula:
Where:
• n = Required sample size
• N = Population size
• Z = Z-value (standard score corresponding to the desired confidence level, e.g., 1.96
for 95%)
• p = Estimated proportion of the population with the characteristic of interest
• q = 1 - p (proportion of the population without the characteristic)
• E = Margin of error (acceptable error level)
Understanding the
Components of the Lynch Formula
•Population Size (N): Total number of individuals or items
in the population.
•Z-value: Reflects the desired confidence level (common
values: 1.96 for 95%, 2.58 for 99%).
•Proportion (p and q): Assumed percentage of the
population with and without the characteristic.
•Margin of Error (E): The maximum allowable difference
between the sample statistic and the population parameter.
Step-by-Step
Calculation Example
So n is rounded off to 370
𝒏=𝟑𝟕𝟎.𝟑𝟕
Interpreting the Results
The calculated sample size of 370 means that, for a population
of 10,000 people, you need to survey at least 370 individuals to
achieve a 95% confidence level with a margin of error of 5%.
This sample size ensures that the survey results will accurately
represent the views or characteristics of the entire population,
within the specified margin of error.
Key Points to Note:
1.Confidence Level (95%): There is a 95% probability that the true population
parameter lies within the margin of error around the sample estimate. In
practical terms, if you were to conduct this survey 100 times, 95 of those surveys
would yield results within the margin of error.
2.Margin of Error (5%): The maximum expected difference between the sample
estimate and the actual population parameter is 5%. This is considered an
acceptable error rate for most surveys.
3.Estimated Proportion (50%): The formula assumes that 50% (p = 0.5) of the
population has the characteristic of interest, which is a conservative estimate
that provides the largest sample size. If the true proportion is known to be
different, the required sample size may be adjusted accordingly.
Advantages and Limitations of
the Lynch Formula
•Advantages: Simple, widely applicable, considers population size
and desired accuracy.
•Limitations: Assumes a simple random sample, may not account
for all sampling complexities, relies on an estimated proportion.
Practical Applications of the
Lynch Formula
•Use in social science research, public health studies, market
research, etc.
•Example scenarios: Political polling, product surveys,
epidemiological studies.
Thank You for
listening!

Understanding the Lynch Formula in Statistics.pptx

  • 1.
    Understanding the Lynch Formula in Statistics AK E Y TO O L FO R R E L I A B I L I T Y M E A S U R E M E N T CHERIELYN V. TABANGIN
  • 2.
    Introduction to theLynch Formula Definition: The Lynch Formula is a statistical formula used to calculate the minimum sample size needed for a survey or study. •Developed by John Lynch, it provides a way to measure how consistently a test performs over time or across different groups. Purpose: To ensure that the sample size is sufficient to represent the population accurately while considering cost and logistical constraints.
  • 3.
    Importance of Reliabilityin Statistics Definition of Reliability: •The degree to which an assessment tool produces stable and consistent results. Why Reliability Matters: •Ensures the accuracy and consistency of data. •Helps in making valid inferences from the data collected.
  • 4.
    The Lynch Formula Formula: Where: •n = Required sample size • N = Population size • Z = Z-value (standard score corresponding to the desired confidence level, e.g., 1.96 for 95%) • p = Estimated proportion of the population with the characteristic of interest • q = 1 - p (proportion of the population without the characteristic) • E = Margin of error (acceptable error level)
  • 5.
    Understanding the Components ofthe Lynch Formula •Population Size (N): Total number of individuals or items in the population. •Z-value: Reflects the desired confidence level (common values: 1.96 for 95%, 2.58 for 99%). •Proportion (p and q): Assumed percentage of the population with and without the characteristic. •Margin of Error (E): The maximum allowable difference between the sample statistic and the population parameter.
  • 6.
    Step-by-Step Calculation Example So nis rounded off to 370 𝒏=𝟑𝟕𝟎.𝟑𝟕
  • 7.
    Interpreting the Results Thecalculated sample size of 370 means that, for a population of 10,000 people, you need to survey at least 370 individuals to achieve a 95% confidence level with a margin of error of 5%. This sample size ensures that the survey results will accurately represent the views or characteristics of the entire population, within the specified margin of error.
  • 8.
    Key Points toNote: 1.Confidence Level (95%): There is a 95% probability that the true population parameter lies within the margin of error around the sample estimate. In practical terms, if you were to conduct this survey 100 times, 95 of those surveys would yield results within the margin of error. 2.Margin of Error (5%): The maximum expected difference between the sample estimate and the actual population parameter is 5%. This is considered an acceptable error rate for most surveys. 3.Estimated Proportion (50%): The formula assumes that 50% (p = 0.5) of the population has the characteristic of interest, which is a conservative estimate that provides the largest sample size. If the true proportion is known to be different, the required sample size may be adjusted accordingly.
  • 9.
    Advantages and Limitationsof the Lynch Formula •Advantages: Simple, widely applicable, considers population size and desired accuracy. •Limitations: Assumes a simple random sample, may not account for all sampling complexities, relies on an estimated proportion.
  • 10.
    Practical Applications ofthe Lynch Formula •Use in social science research, public health studies, market research, etc. •Example scenarios: Political polling, product surveys, epidemiological studies.
  • 11.