Download to read offline


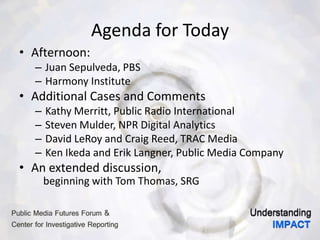

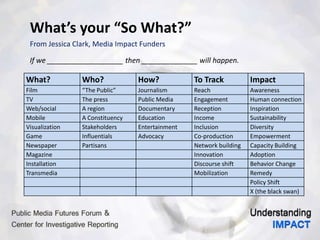
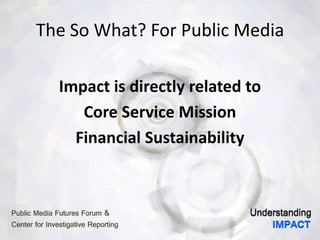
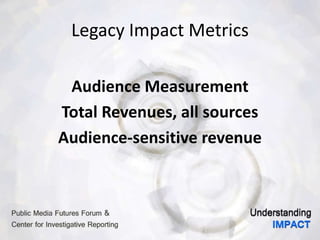
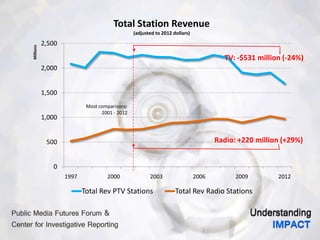
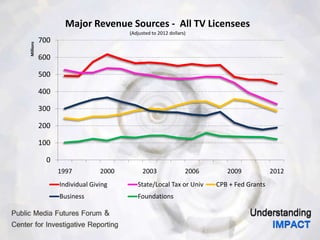
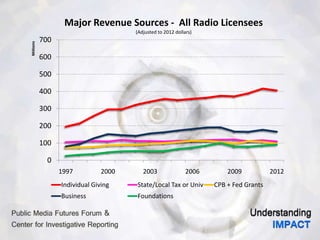
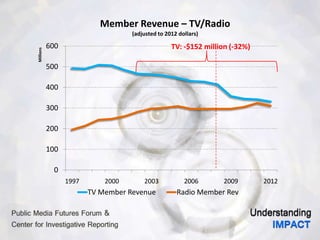
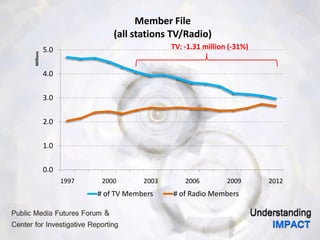
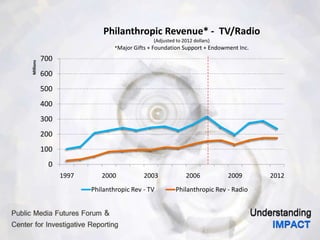
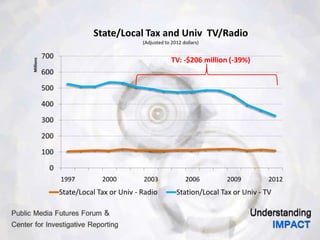


The document outlines the agenda for a seminar focused on public media impact, featuring discussions from various speakers and topics related to funding, measurement, and engagement strategies. It highlights key data on revenue streams for television and radio, emphasizing the need for clarity in impact measurement and collaboration among public media professionals. The goals include learning from case studies, identifying data points, and developing follow-up actions to enhance the sustainability and effectiveness of public media initiatives.


