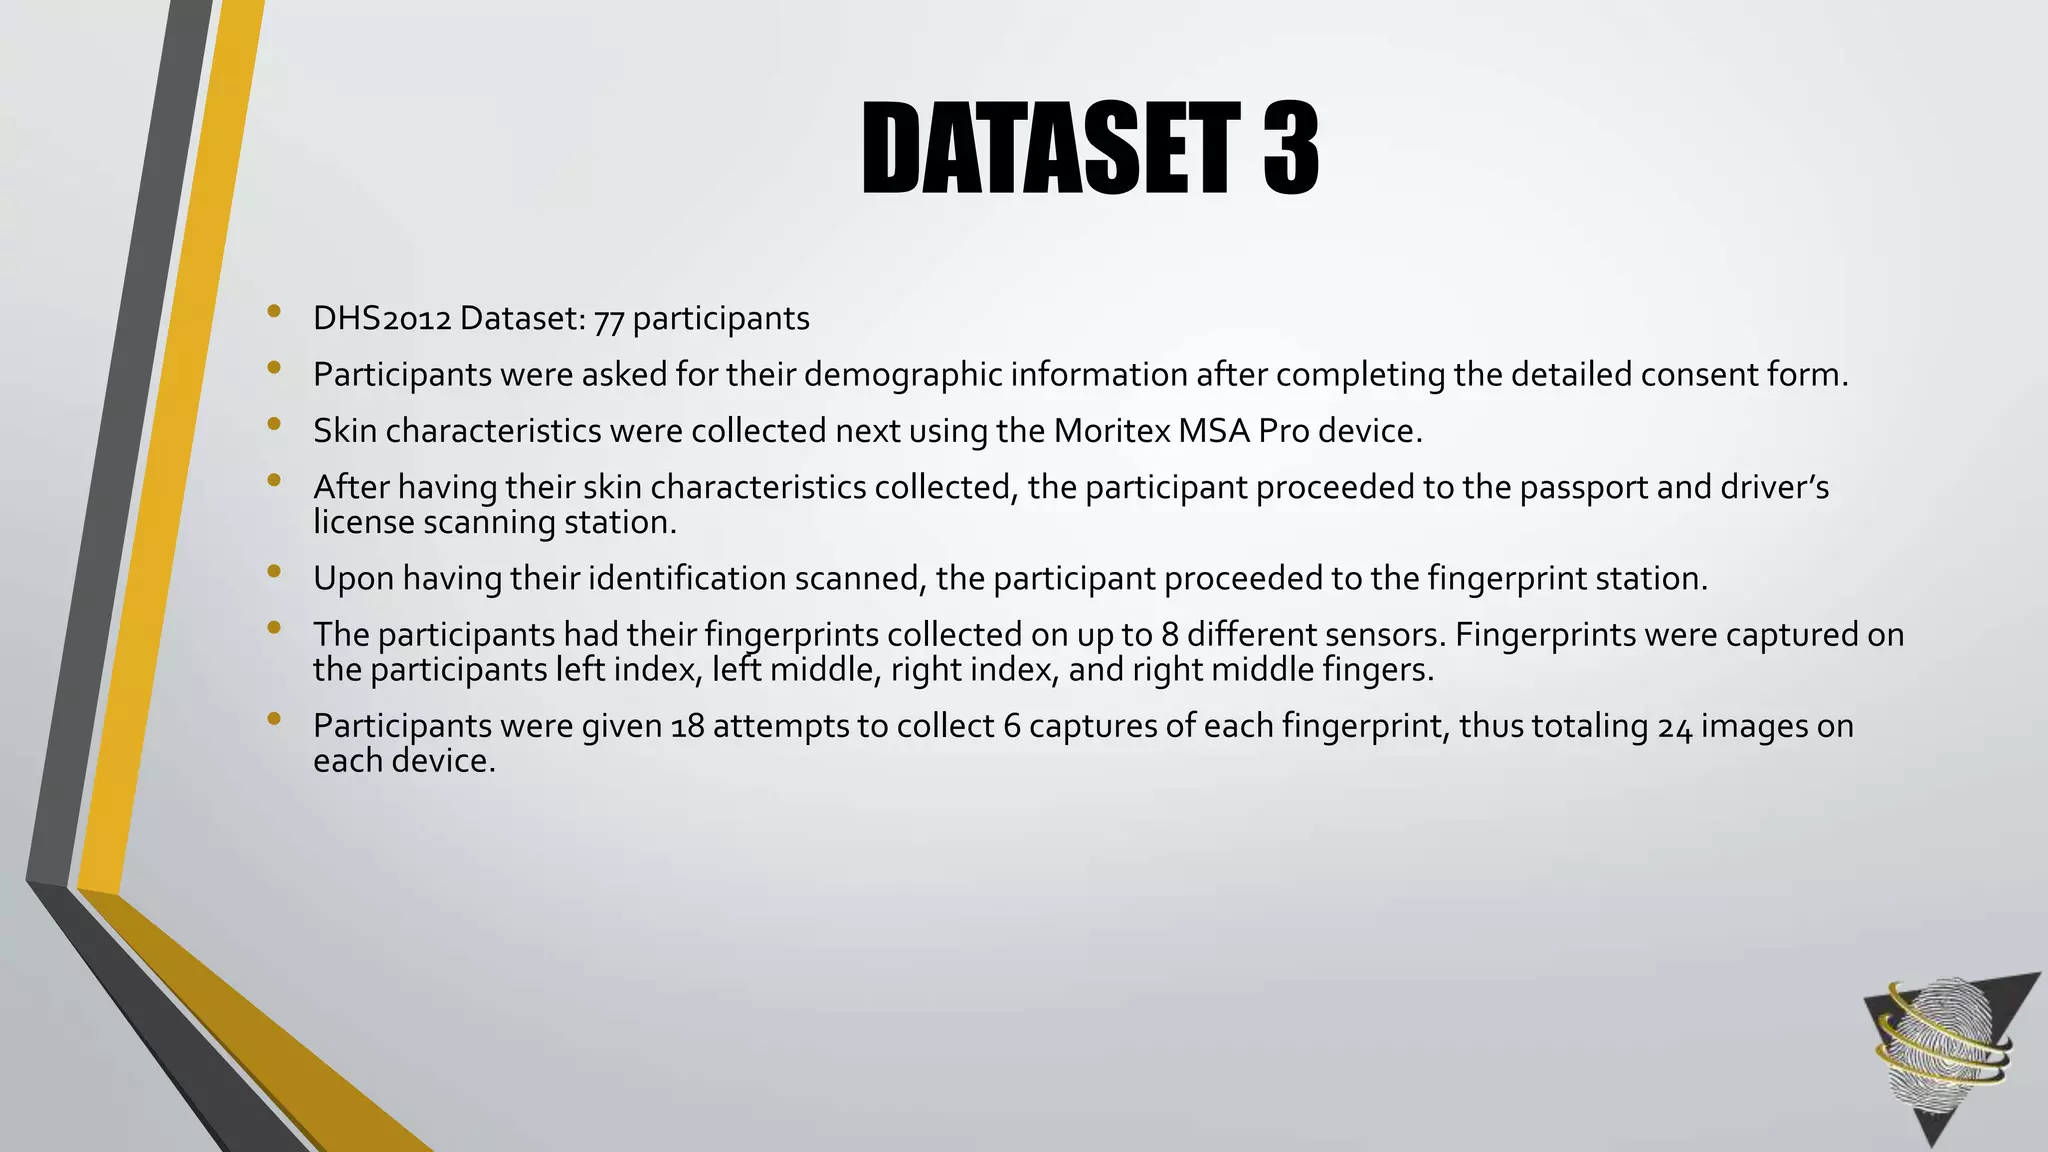
Downloaded 17 times

![MOTIVATION
• Articles have linked skin moisture, oiliness, and elasticity to
image quality but most do not have data on skin measurements
to statistically prove the interaction effects.[5][7][15][16][21][22]
• There is no methodology or consistent measure for collecting
these fingerprint skin measurements.
• Measurements are collected across different types of
devices.[2][7][14]
• Collecting poor quality data can be time consuming and
expensive. It costs about $2.00 per capture using traditional
capture stations.[1]](https://image.slidesharecdn.com/moetprojectoutlineforupload-140829151315-phpapp01/75/Understanding-Fingerprint-Skin-Characteristics-and-Image-Quality-5-2048.jpg)
![SIGNIFICANCE
• This problem is important because collecting the skin
characteristic data is time consuming and if
unnecessary, can save that time.
• Collecting poor fingerprint data can be costly.
• Image quality affects performance therefore the best
image quality should always try to be achieved. [8]](https://image.slidesharecdn.com/moetprojectoutlineforupload-140829151315-phpapp01/75/Understanding-Fingerprint-Skin-Characteristics-and-Image-Quality-7-2048.jpg)
![SKIN STRUCTURE
Figure 1: Layers of the
skin[11]](https://image.slidesharecdn.com/moetprojectoutlineforupload-140829151315-phpapp01/75/Understanding-Fingerprint-Skin-Characteristics-and-Image-Quality-8-2048.jpg)
![PORES
• A pore is defined as a very small opening on the
surface of your skin that liquid comes out through
when you sweat. [12]
•These pore structures are what creates the
moisture on a fingerprint.](https://image.slidesharecdn.com/moetprojectoutlineforupload-140829151315-phpapp01/75/Understanding-Fingerprint-Skin-Characteristics-and-Image-Quality-9-2048.jpg)
![SEBACEOUS GLANDS
• A sebaceous gland is the organ responsible for
producing the oil content (sebum) on the skin.[18]
• Free sebaceous glands open directly onto the
skin’s surface (pg 385)[18]](https://image.slidesharecdn.com/moetprojectoutlineforupload-140829151315-phpapp01/75/Understanding-Fingerprint-Skin-Characteristics-and-Image-Quality-10-2048.jpg)
![OILINESS
• Oiliness is defined as excessively high in naturally
secreted oils. [10]](https://image.slidesharecdn.com/moetprojectoutlineforupload-140829151315-phpapp01/75/Understanding-Fingerprint-Skin-Characteristics-and-Image-Quality-11-2048.jpg)
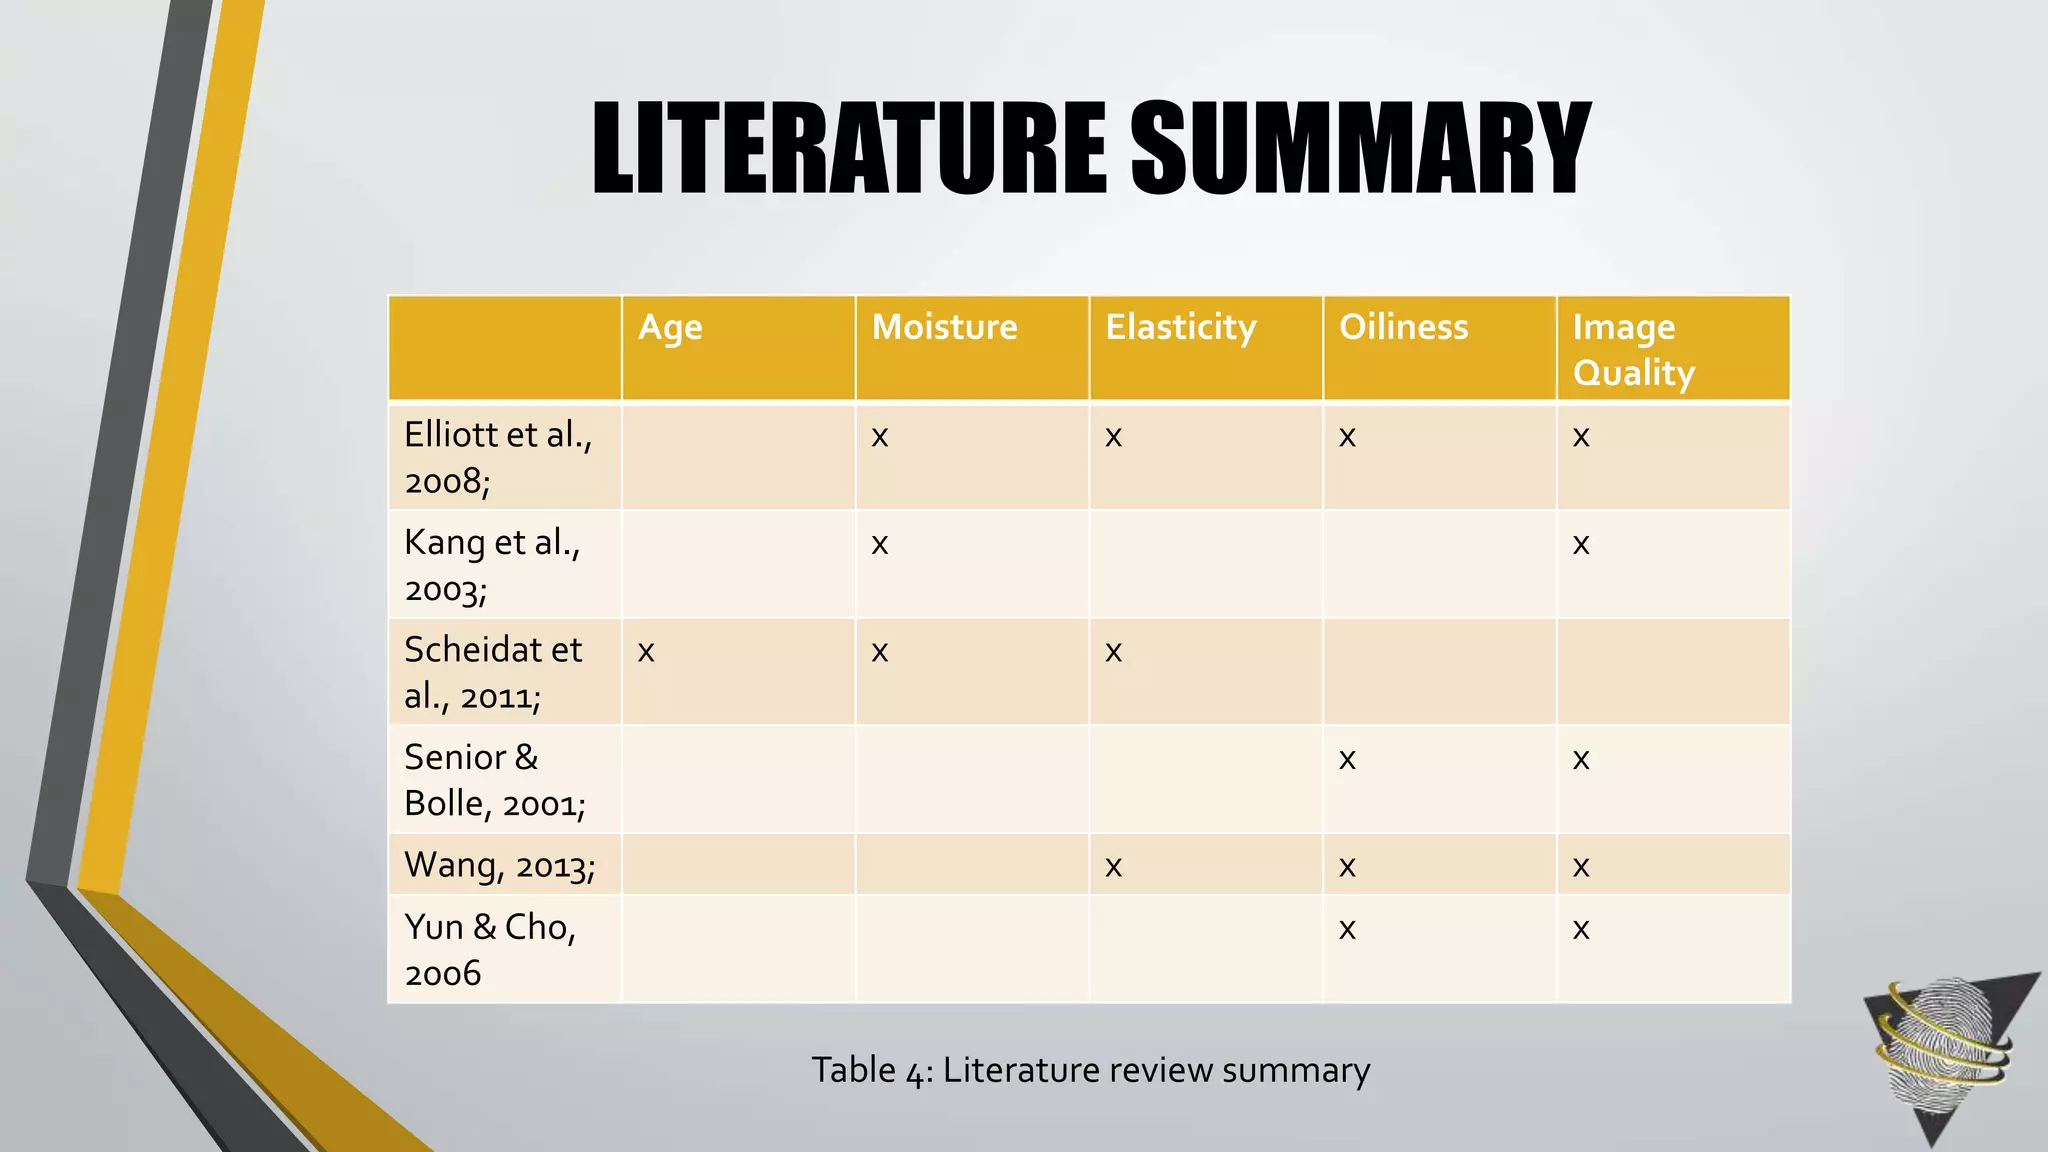
![LITERATURE
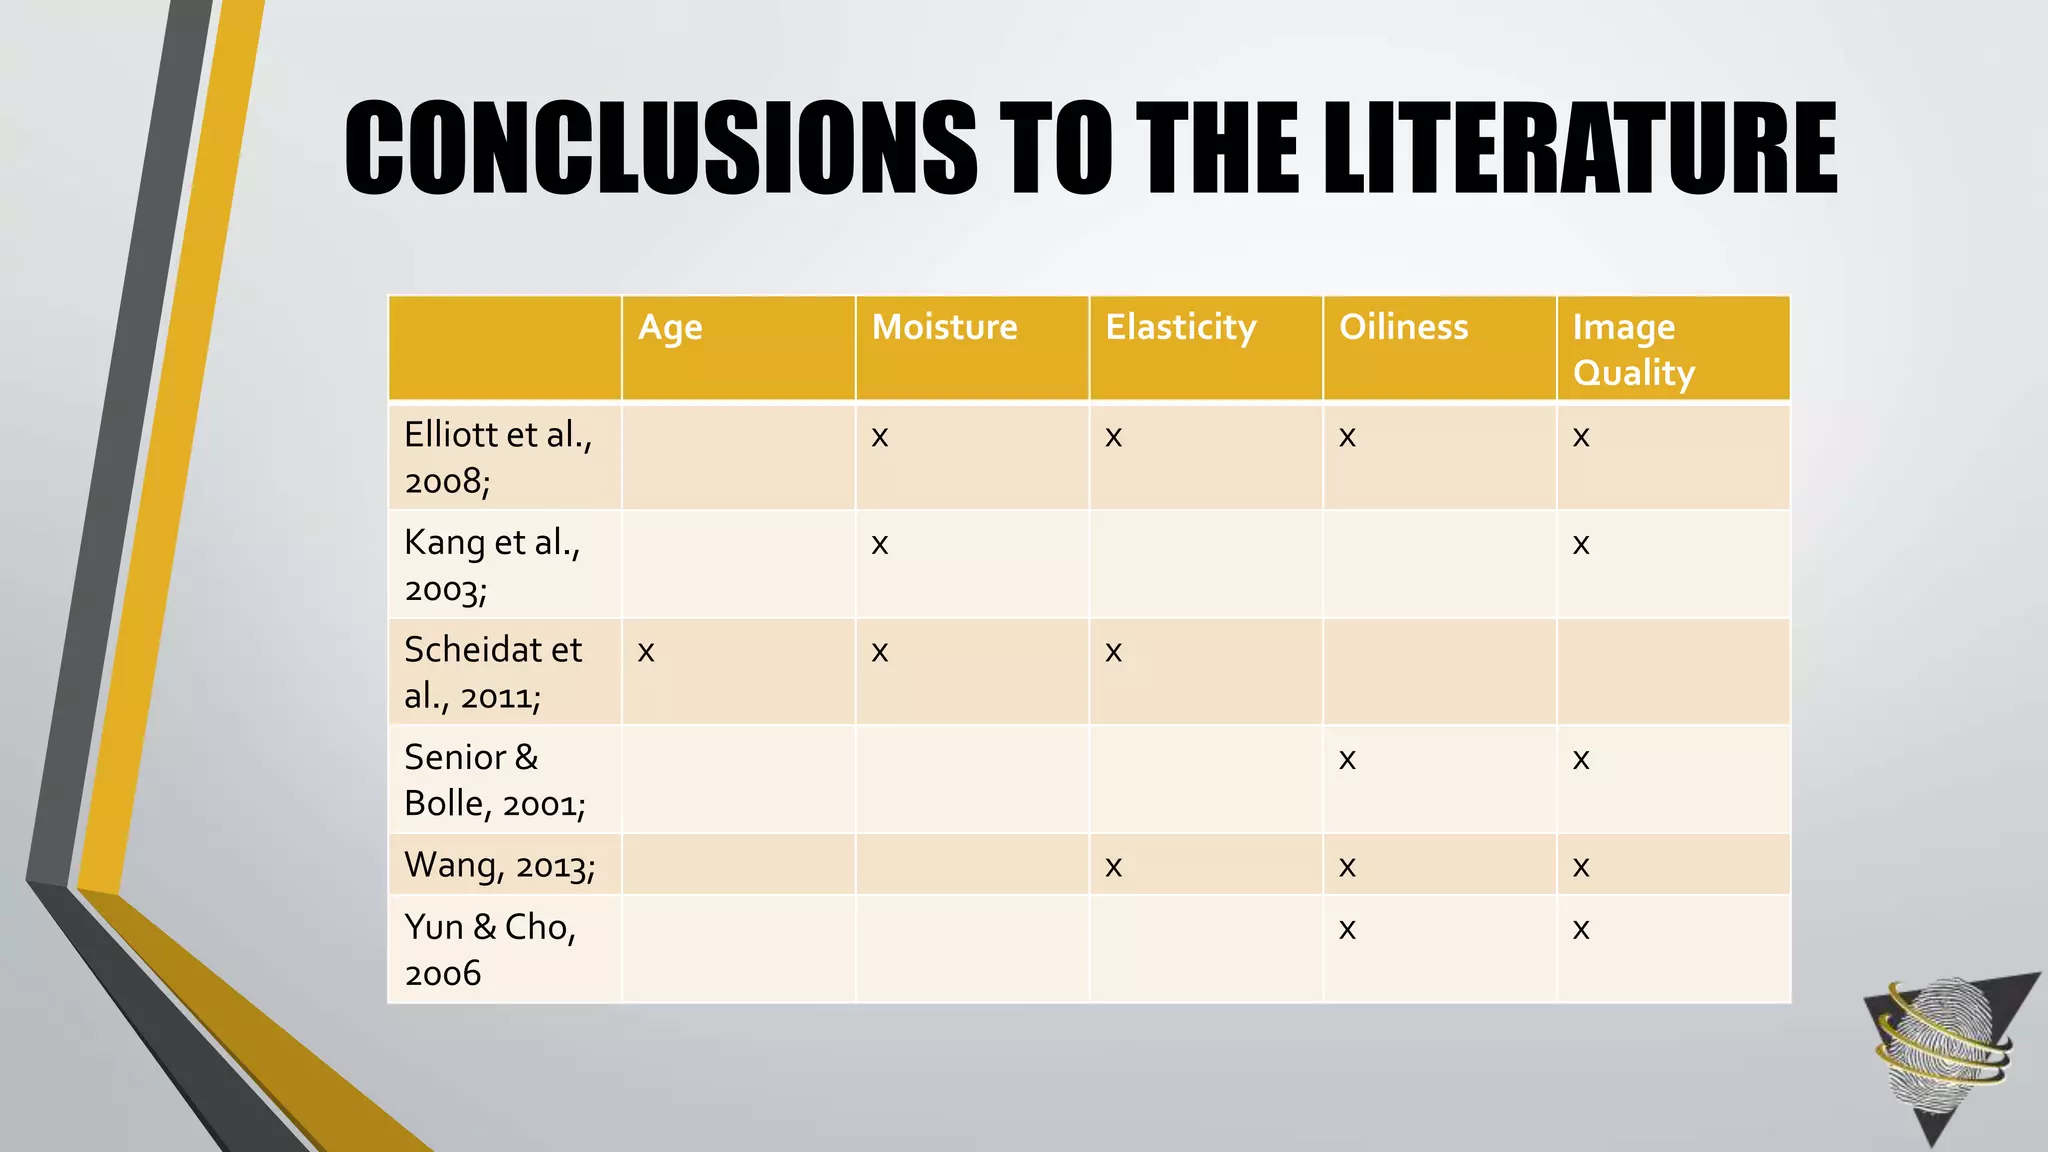
• Senior & Bolle (2001) stated that oil on the
fingerprint often leads to poor image quality.[16]](https://image.slidesharecdn.com/moetprojectoutlineforupload-140829151315-phpapp01/75/Understanding-Fingerprint-Skin-Characteristics-and-Image-Quality-12-2048.jpg)
![LITERATURE
•Wang (2013) stated that oil on the fingerprint
often leads to poor image quality.[15]](https://image.slidesharecdn.com/moetprojectoutlineforupload-140829151315-phpapp01/75/Understanding-Fingerprint-Skin-Characteristics-and-Image-Quality-13-2048.jpg)
![LITERATURE
•Yun & Cho (2006) stated that oil on the fingerprint
often leads to poor image quality.[22]](https://image.slidesharecdn.com/moetprojectoutlineforupload-140829151315-phpapp01/75/Understanding-Fingerprint-Skin-Characteristics-and-Image-Quality-14-2048.jpg)
![MOISTURE
• Moisture is defined as liquid diffused or condensed
in a relatively small quantity. [9]](https://image.slidesharecdn.com/moetprojectoutlineforupload-140829151315-phpapp01/75/Understanding-Fingerprint-Skin-Characteristics-and-Image-Quality-15-2048.jpg)
![LITERATURE
• Kang et al. (2003) stated that when moisture is
lower, image quality will be greatly reduced rather
than when the moisture is higher.[7]](https://image.slidesharecdn.com/moetprojectoutlineforupload-140829151315-phpapp01/75/Understanding-Fingerprint-Skin-Characteristics-and-Image-Quality-16-2048.jpg)
![ELASTICITY
• Elasticity is defined as resilience, or the ability of
something to return to its original shape after it
has been manipulated. [4][13]](https://image.slidesharecdn.com/moetprojectoutlineforupload-140829151315-phpapp01/75/Understanding-Fingerprint-Skin-Characteristics-and-Image-Quality-17-2048.jpg)
![LITERATURE
•Wang (2013) also stated that elasticity can cause
distortion which leads to poor image quality.[21]
•Wang (2013) stated that too much force or too
little force also affect the image quality.[21]](https://image.slidesharecdn.com/moetprojectoutlineforupload-140829151315-phpapp01/75/Understanding-Fingerprint-Skin-Characteristics-and-Image-Quality-18-2048.jpg)
![IMAGE QUALITY
• Fingerprint image quality is defined as the
measure of ridge and valley clarity and the ability
to extract the important features of the finger.[3]](https://image.slidesharecdn.com/moetprojectoutlineforupload-140829151315-phpapp01/75/Understanding-Fingerprint-Skin-Characteristics-and-Image-Quality-20-2048.jpg)
![FIDELITY IMAGE QUALITY
• Fidelity image quality is described as the degree to
which a sample is an accurate representation of its
source. [17]](https://image.slidesharecdn.com/moetprojectoutlineforupload-140829151315-phpapp01/75/Understanding-Fingerprint-Skin-Characteristics-and-Image-Quality-21-2048.jpg)
![LITERATURE
• Elliott et al. (2008) related moisture, oiliness, and
elasticity to image quality.[5]
• Elliott et al. (2008) stated that there is a
relationship between the skin characteristics and
image quality but it isn’t a linear relationship.[5]](https://image.slidesharecdn.com/moetprojectoutlineforupload-140829151315-phpapp01/75/Understanding-Fingerprint-Skin-Characteristics-and-Image-Quality-22-2048.jpg)


![AGE
Figure 4: Age breakdown for Dataset 11
[1] Datarun 1456](https://image.slidesharecdn.com/moetprojectoutlineforupload-140829151315-phpapp01/75/Understanding-Fingerprint-Skin-Characteristics-and-Image-Quality-34-2048.jpg)
![GENDER
[1] Datarun 1456
Figure 5: Gender breakdown for Dataset 11](https://image.slidesharecdn.com/moetprojectoutlineforupload-140829151315-phpapp01/75/Understanding-Fingerprint-Skin-Characteristics-and-Image-Quality-35-2048.jpg)
![ETHNICITY
[1] Datarun 1456
Figure 6: Ethnicity breakdown for Dataset 11](https://image.slidesharecdn.com/moetprojectoutlineforupload-140829151315-phpapp01/75/Understanding-Fingerprint-Skin-Characteristics-and-Image-Quality-36-2048.jpg)

![AGE
[1] Datarun 1457
Figure 7: Age breakdown for Dataset 21](https://image.slidesharecdn.com/moetprojectoutlineforupload-140829151315-phpapp01/75/Understanding-Fingerprint-Skin-Characteristics-and-Image-Quality-39-2048.jpg)
![GENDER
[1] Datarun 1457
Figure 8: Gender breakdown for Dataset 21](https://image.slidesharecdn.com/moetprojectoutlineforupload-140829151315-phpapp01/75/Understanding-Fingerprint-Skin-Characteristics-and-Image-Quality-40-2048.jpg)

![AGE
Figure 9: Age breakdown for Dataset 31
[1] Datarun 1455](https://image.slidesharecdn.com/moetprojectoutlineforupload-140829151315-phpapp01/75/Understanding-Fingerprint-Skin-Characteristics-and-Image-Quality-43-2048.jpg)
![GENDER
Figure 10: Gender breakdown for Dataset 31
[1] Datarun 1455](https://image.slidesharecdn.com/moetprojectoutlineforupload-140829151315-phpapp01/75/Understanding-Fingerprint-Skin-Characteristics-and-Image-Quality-44-2048.jpg)
![ETHNICITY
Figure 11: Ethnicity breakdown for Dataset 31
[1] Datarun 1455](https://image.slidesharecdn.com/moetprojectoutlineforupload-140829151315-phpapp01/75/Understanding-Fingerprint-Skin-Characteristics-and-Image-Quality-45-2048.jpg)

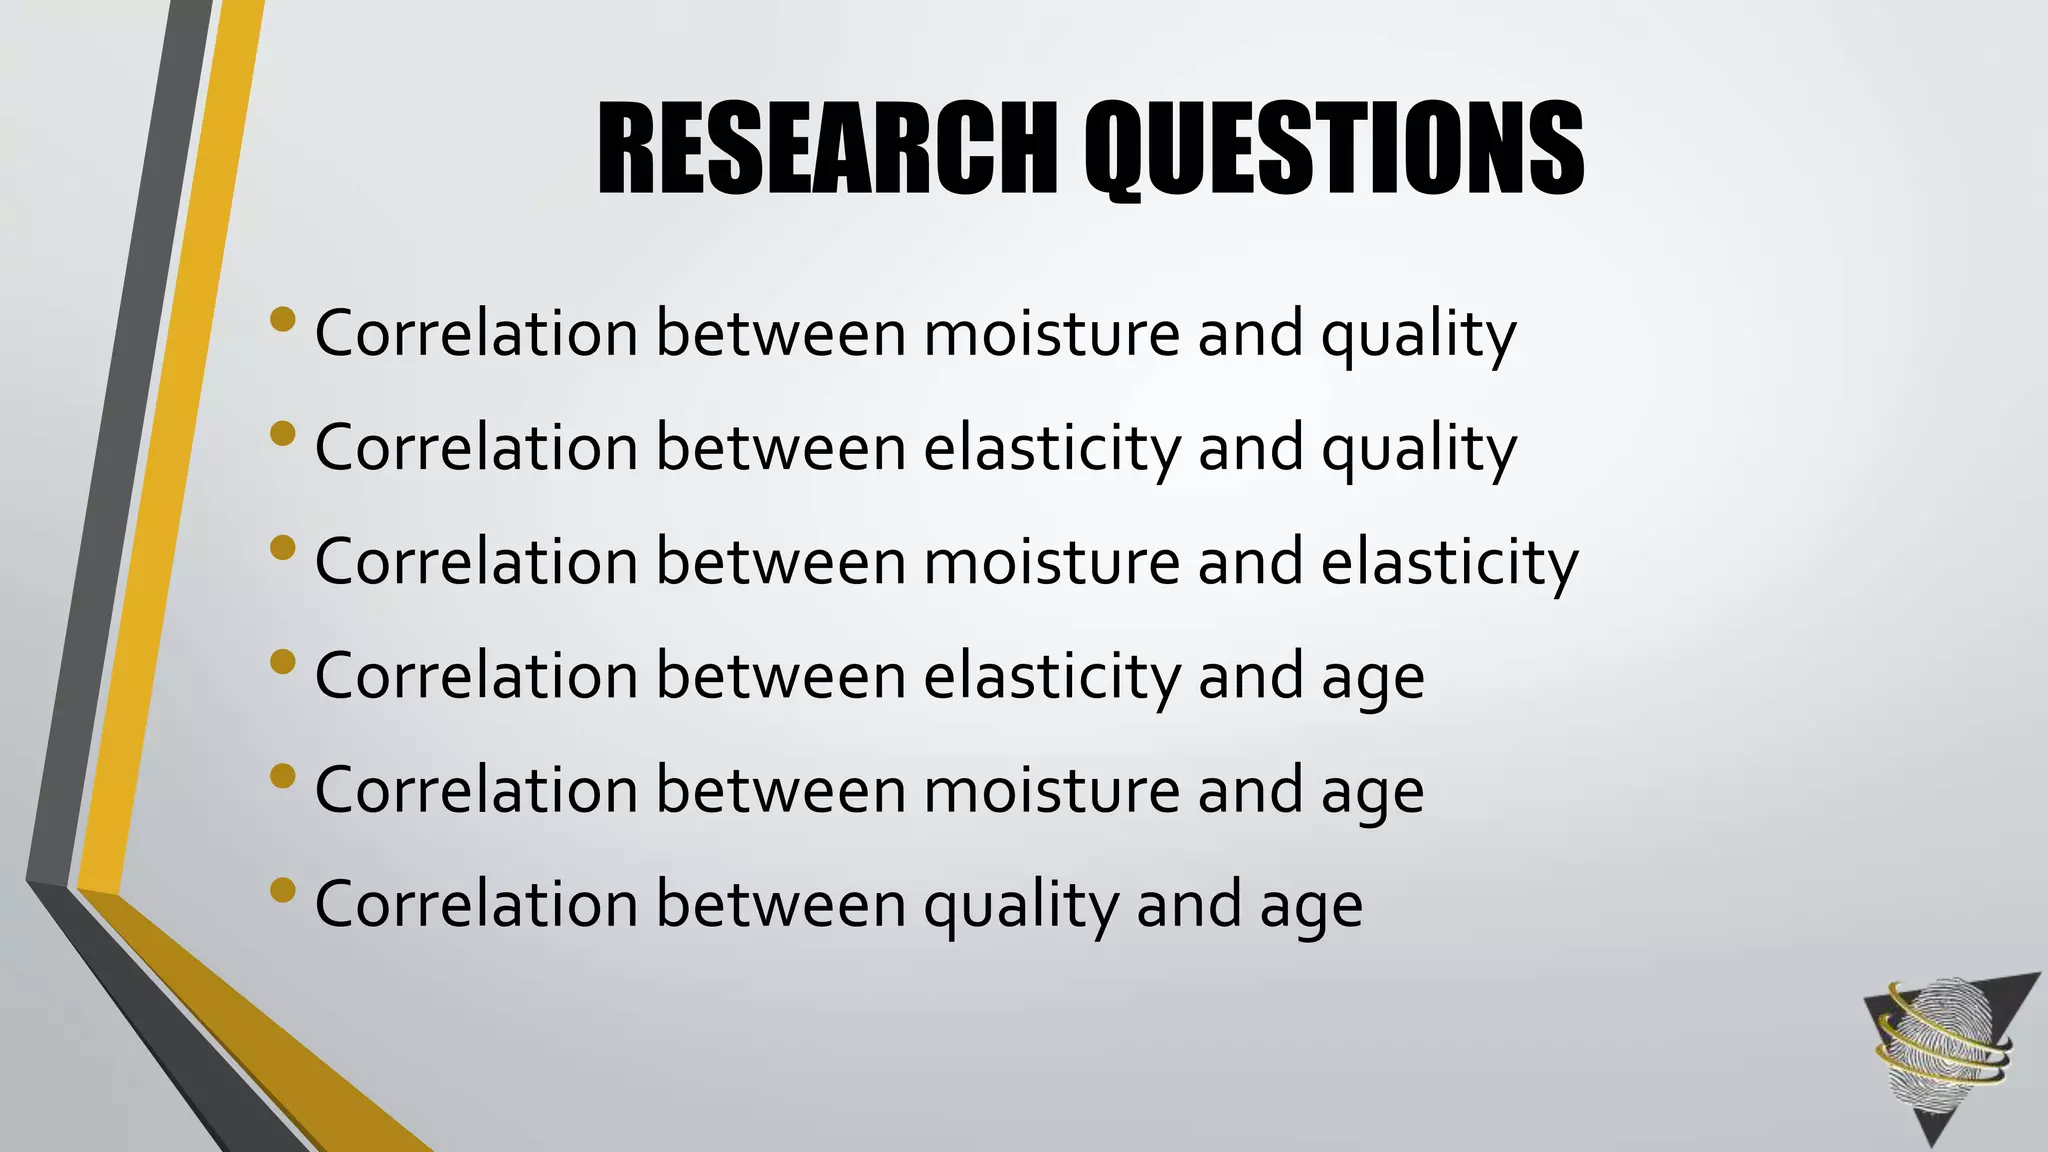

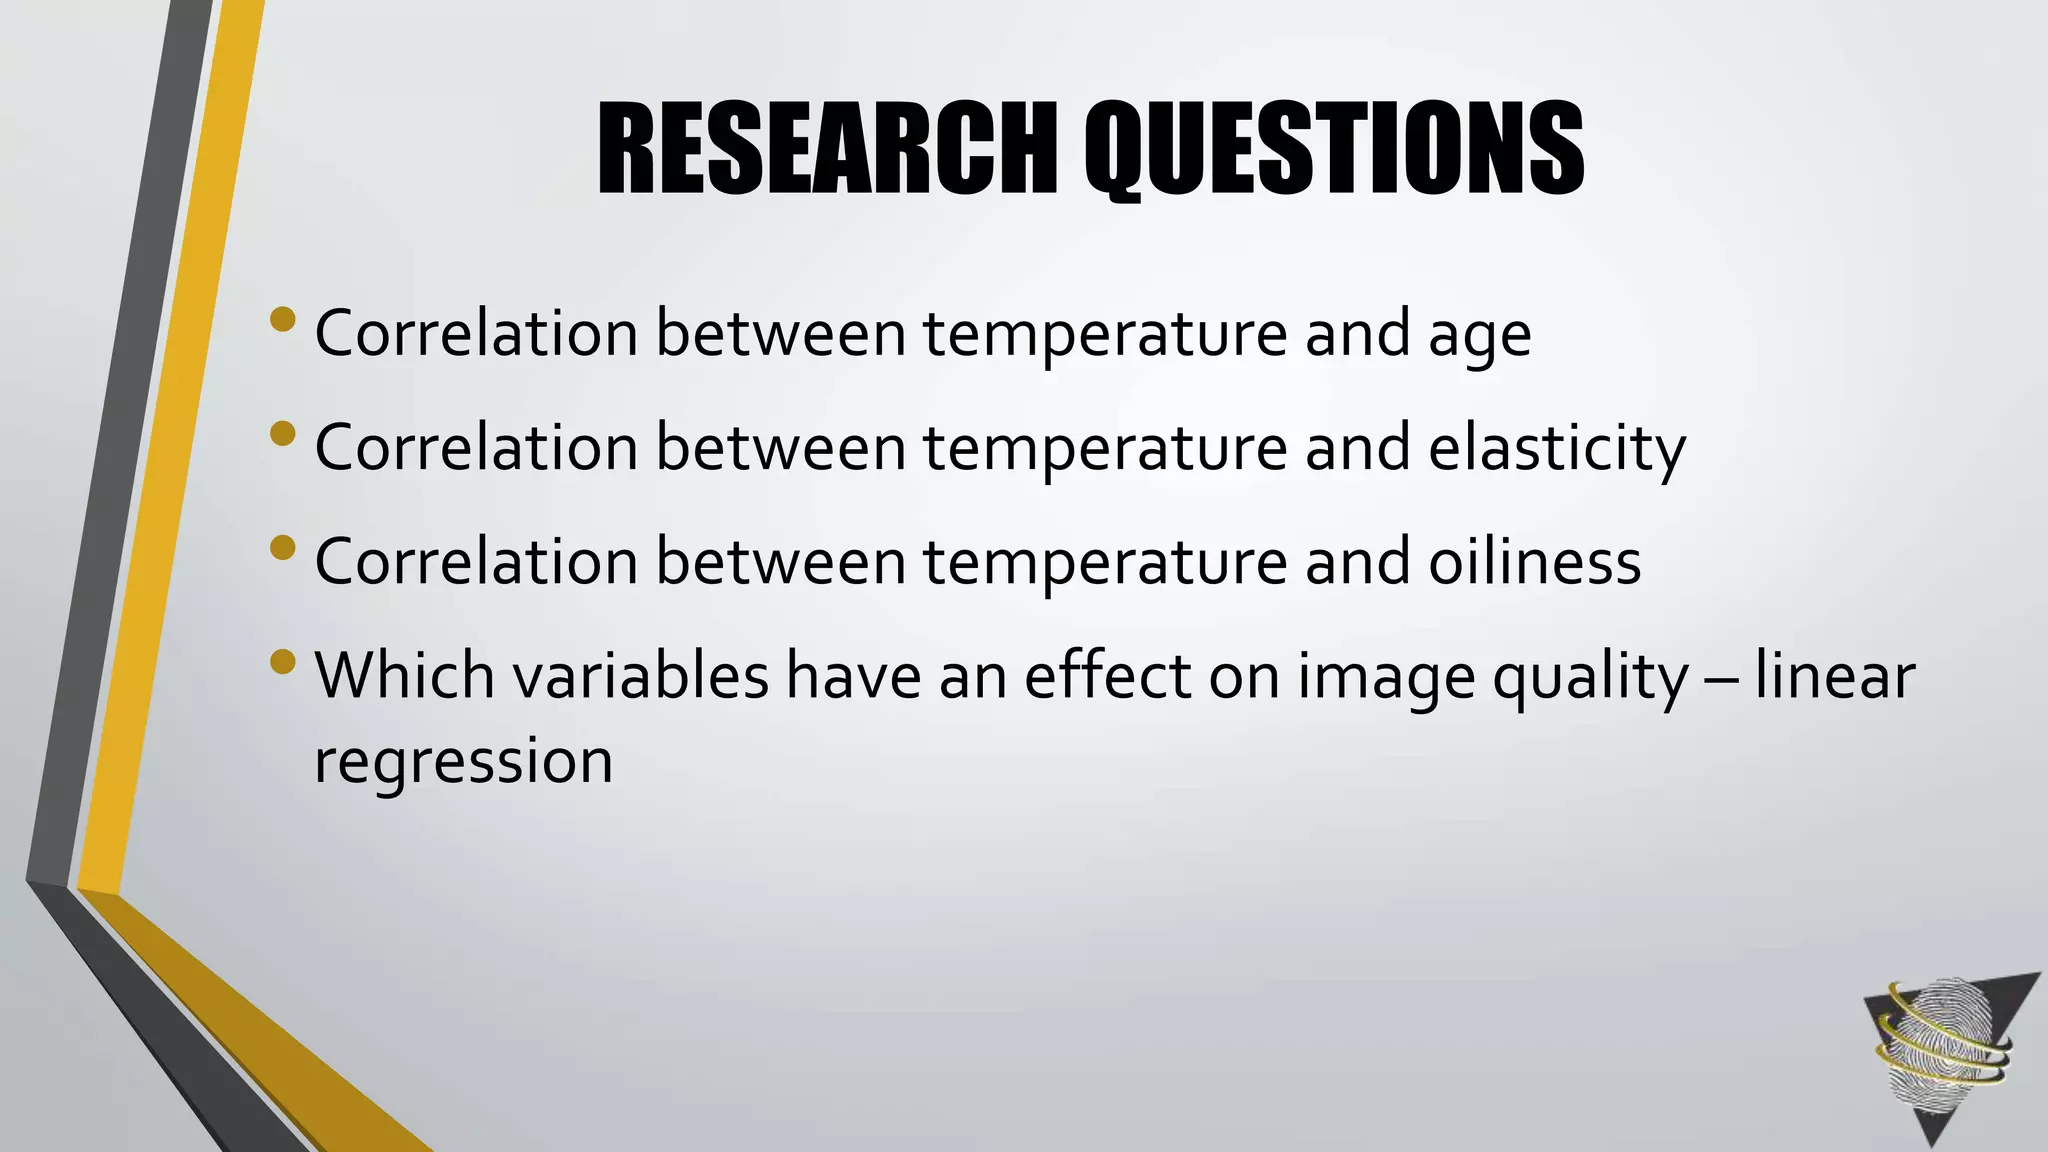
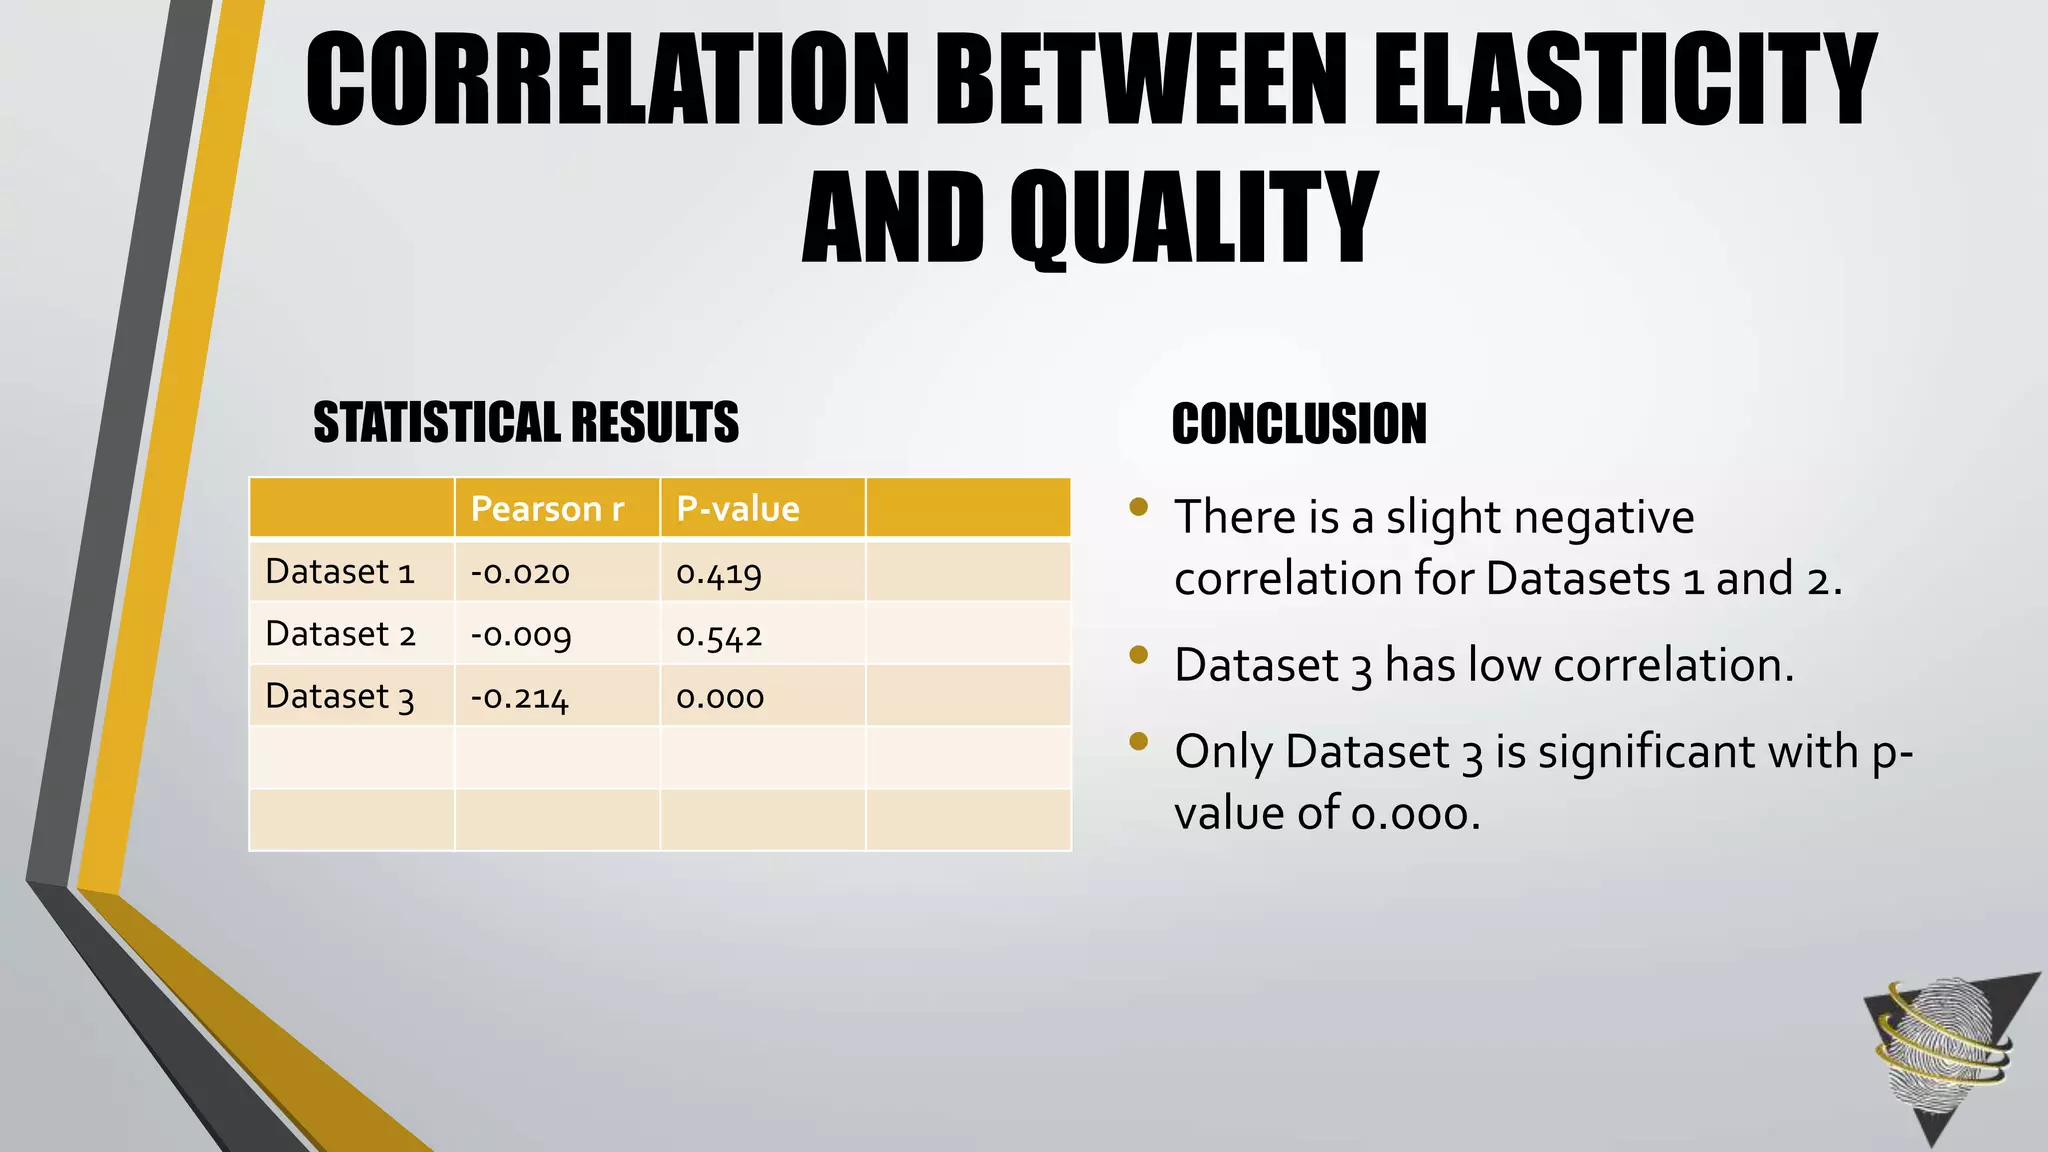
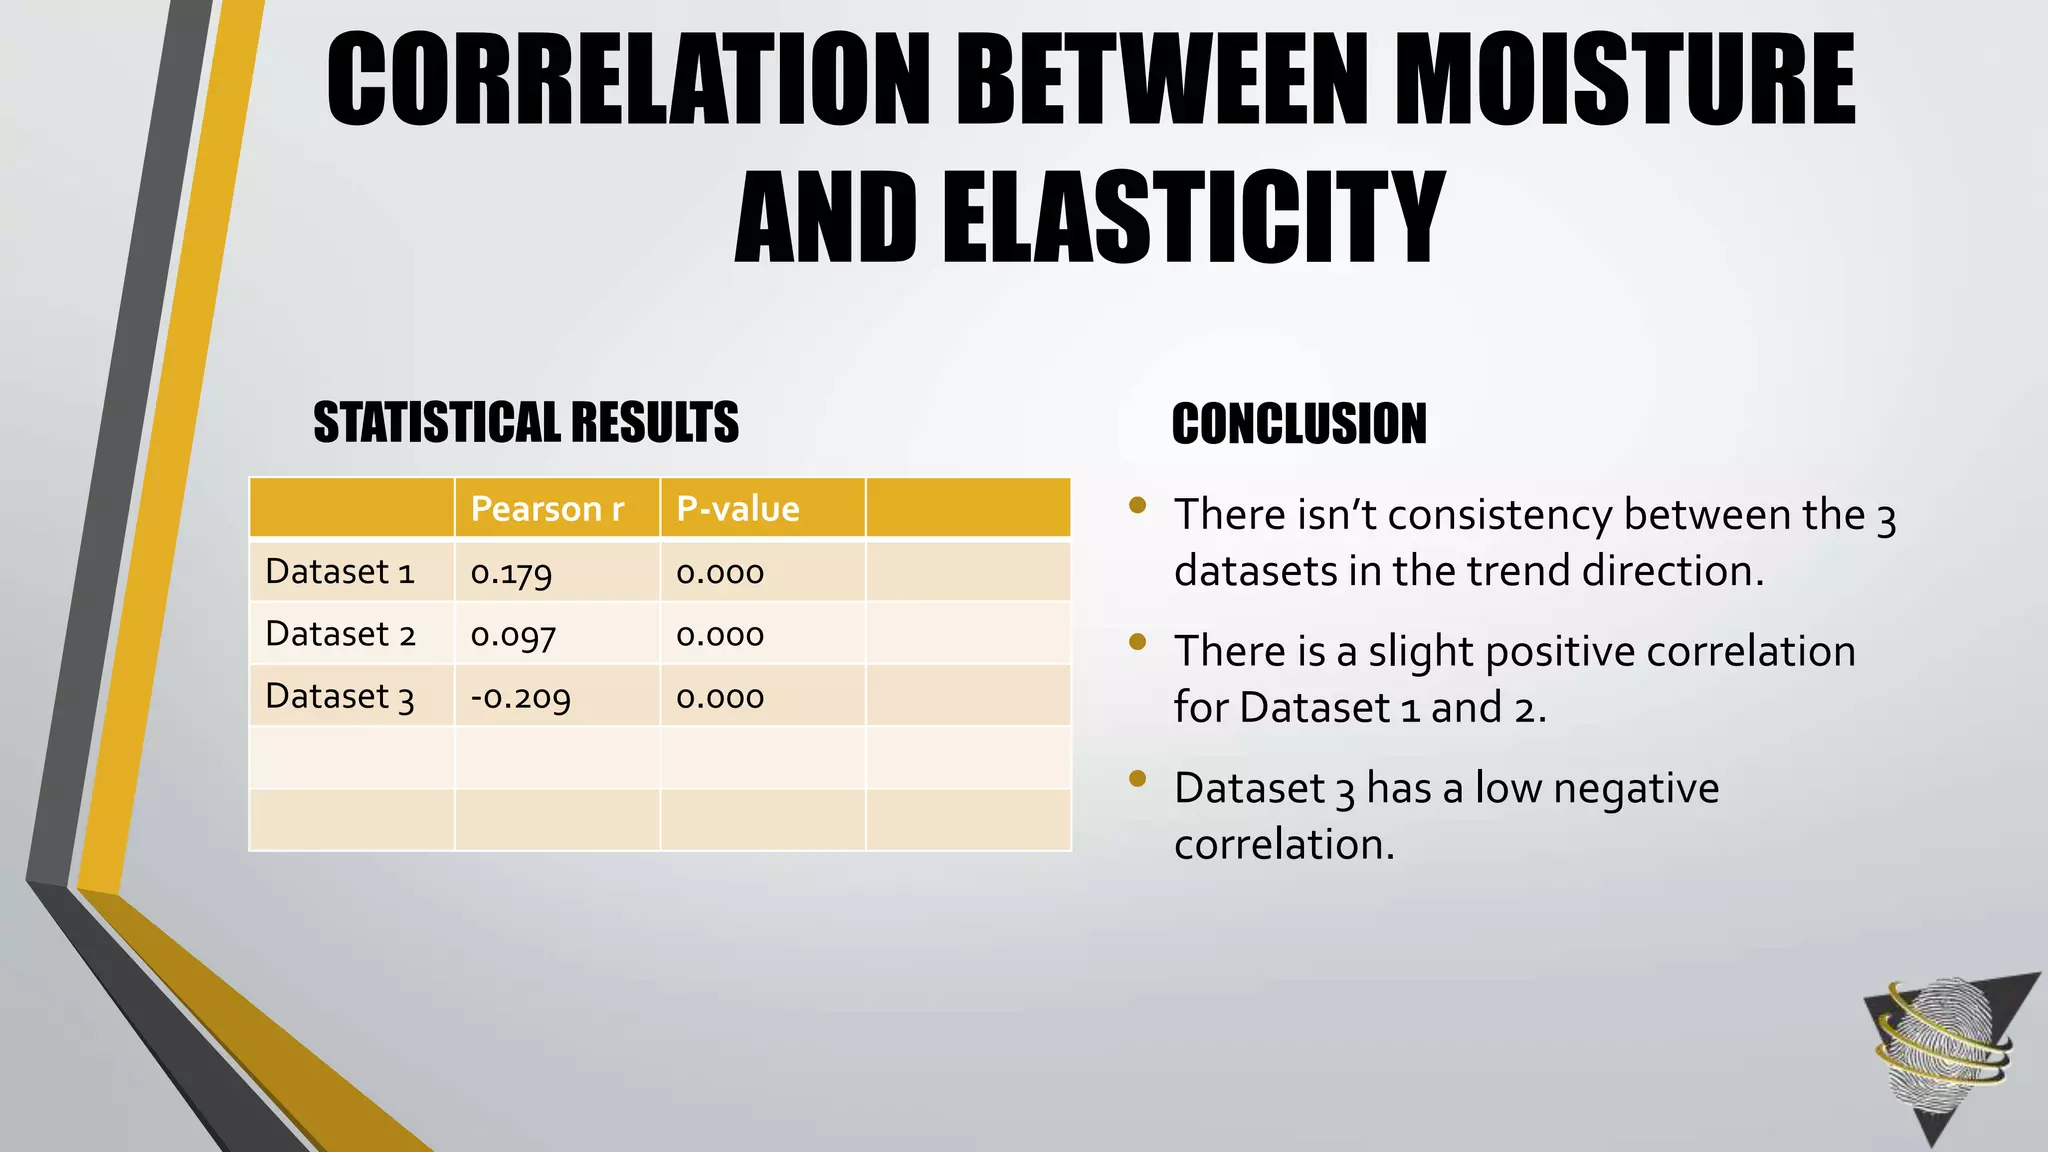
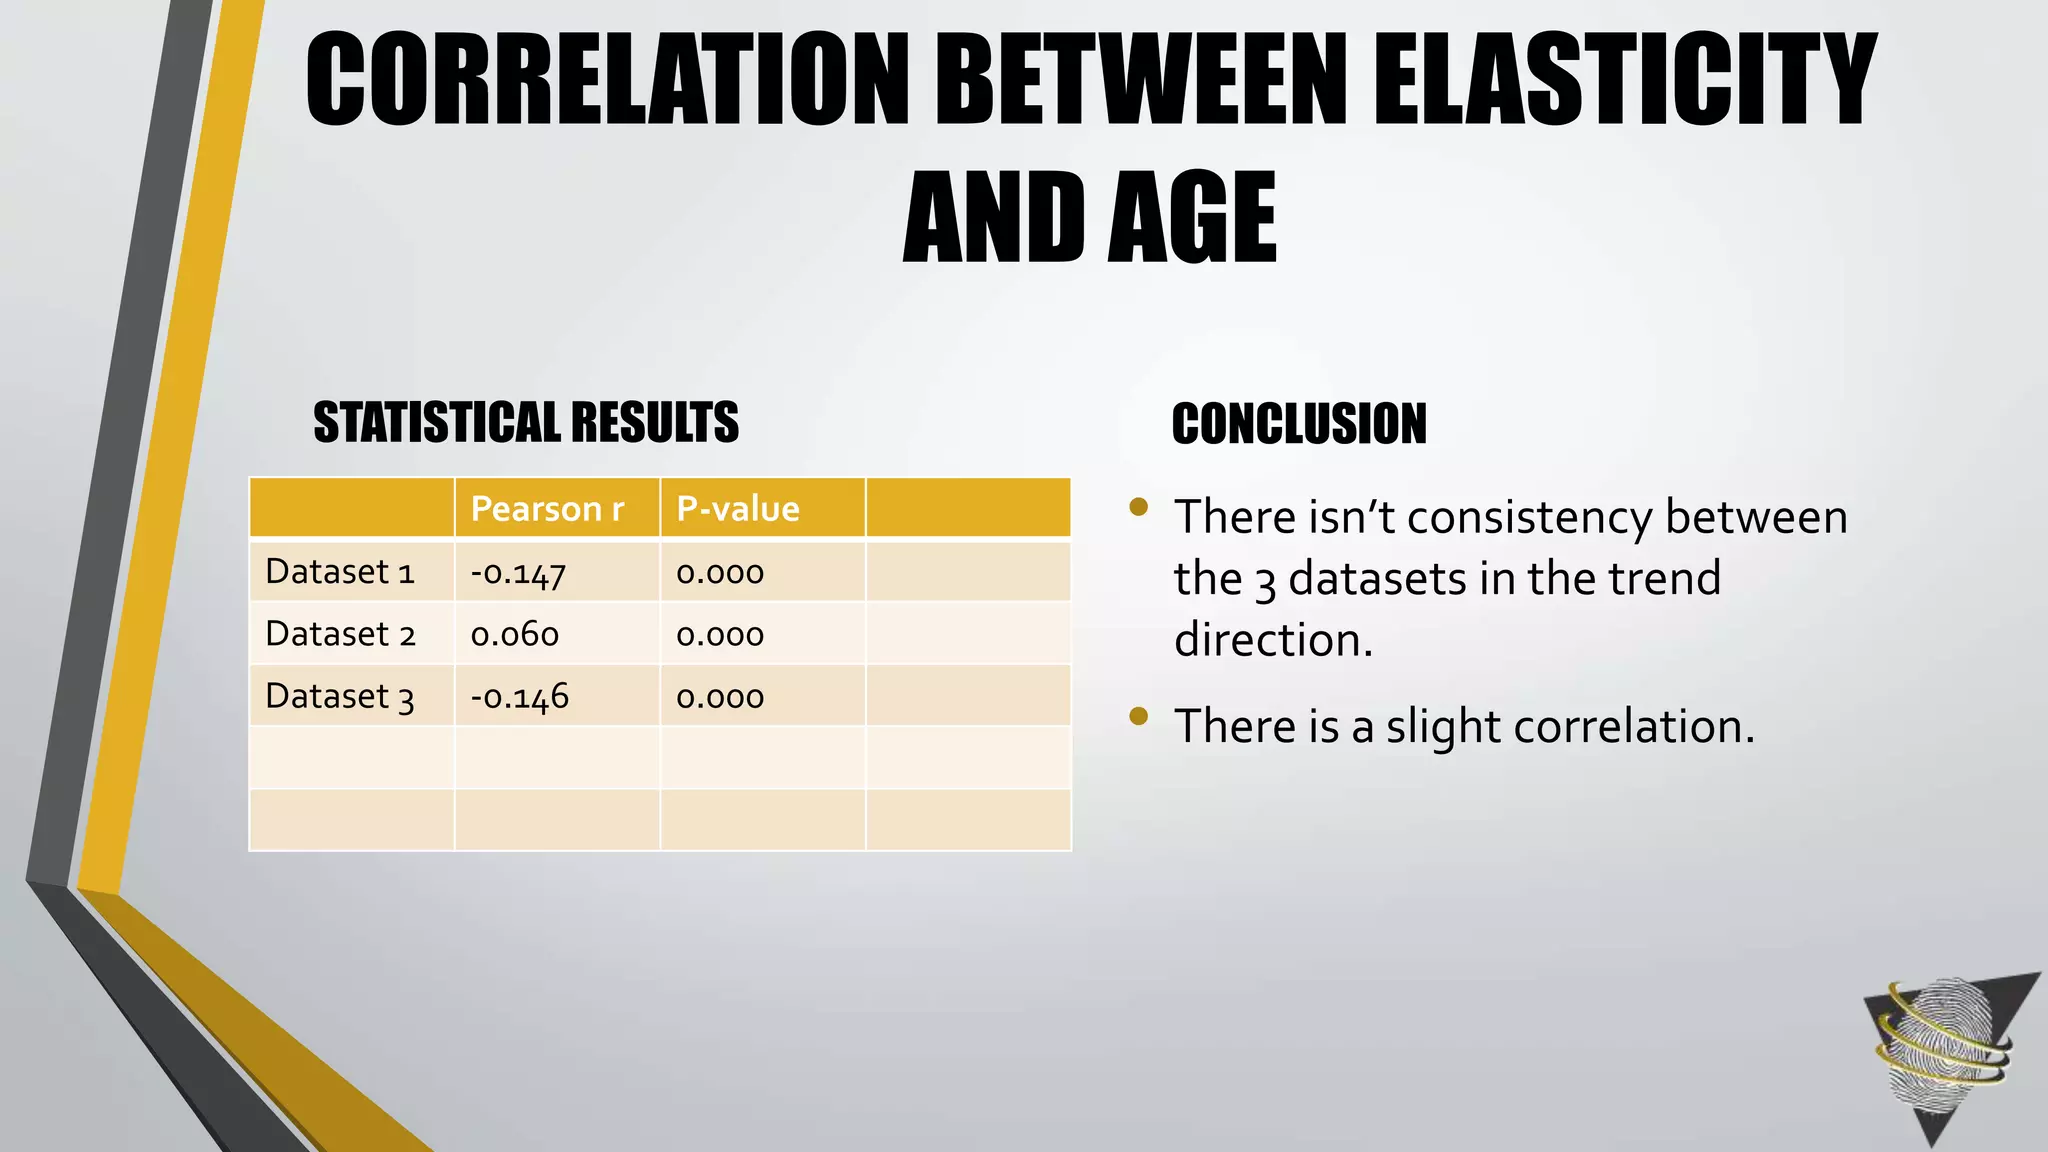
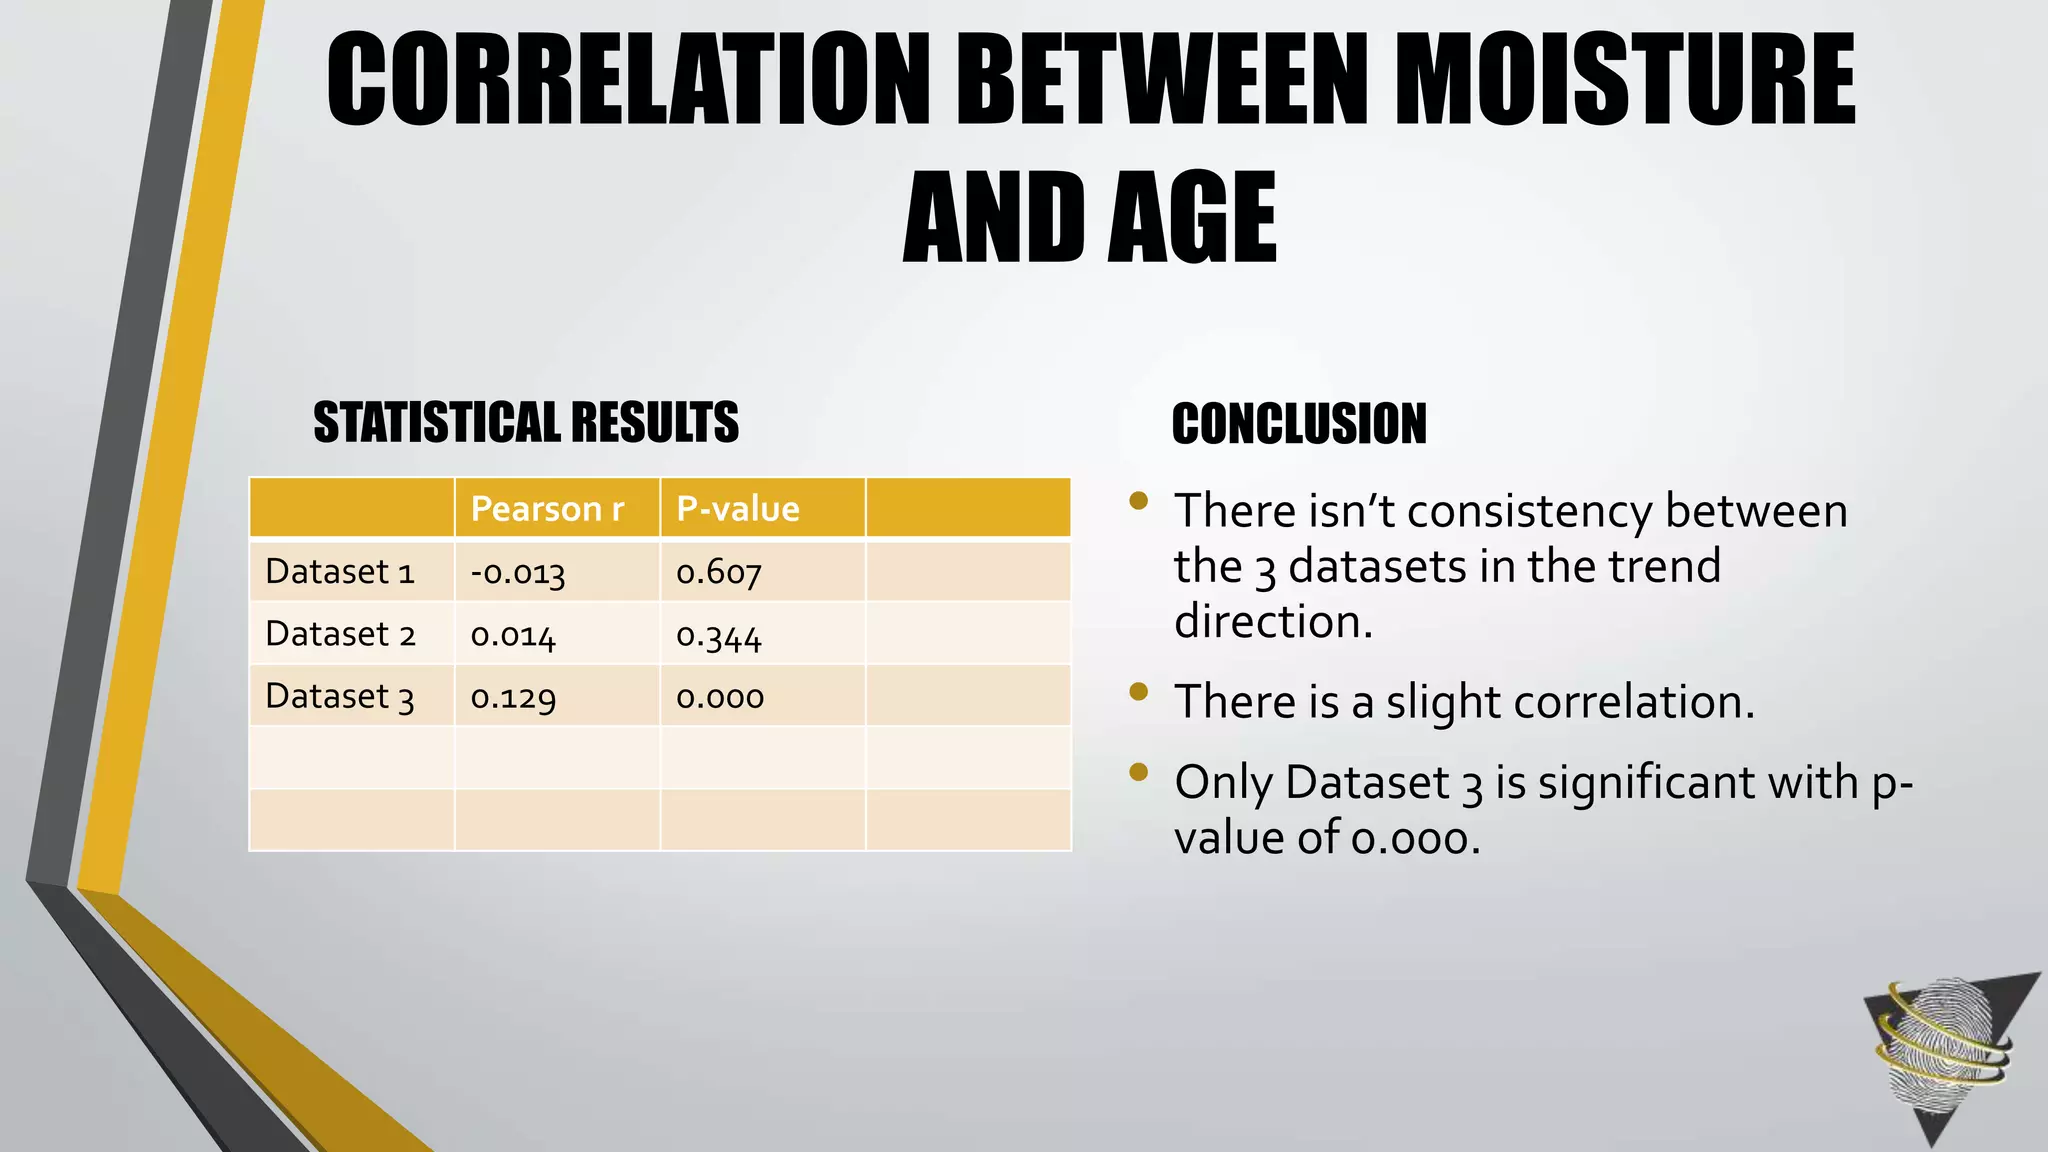
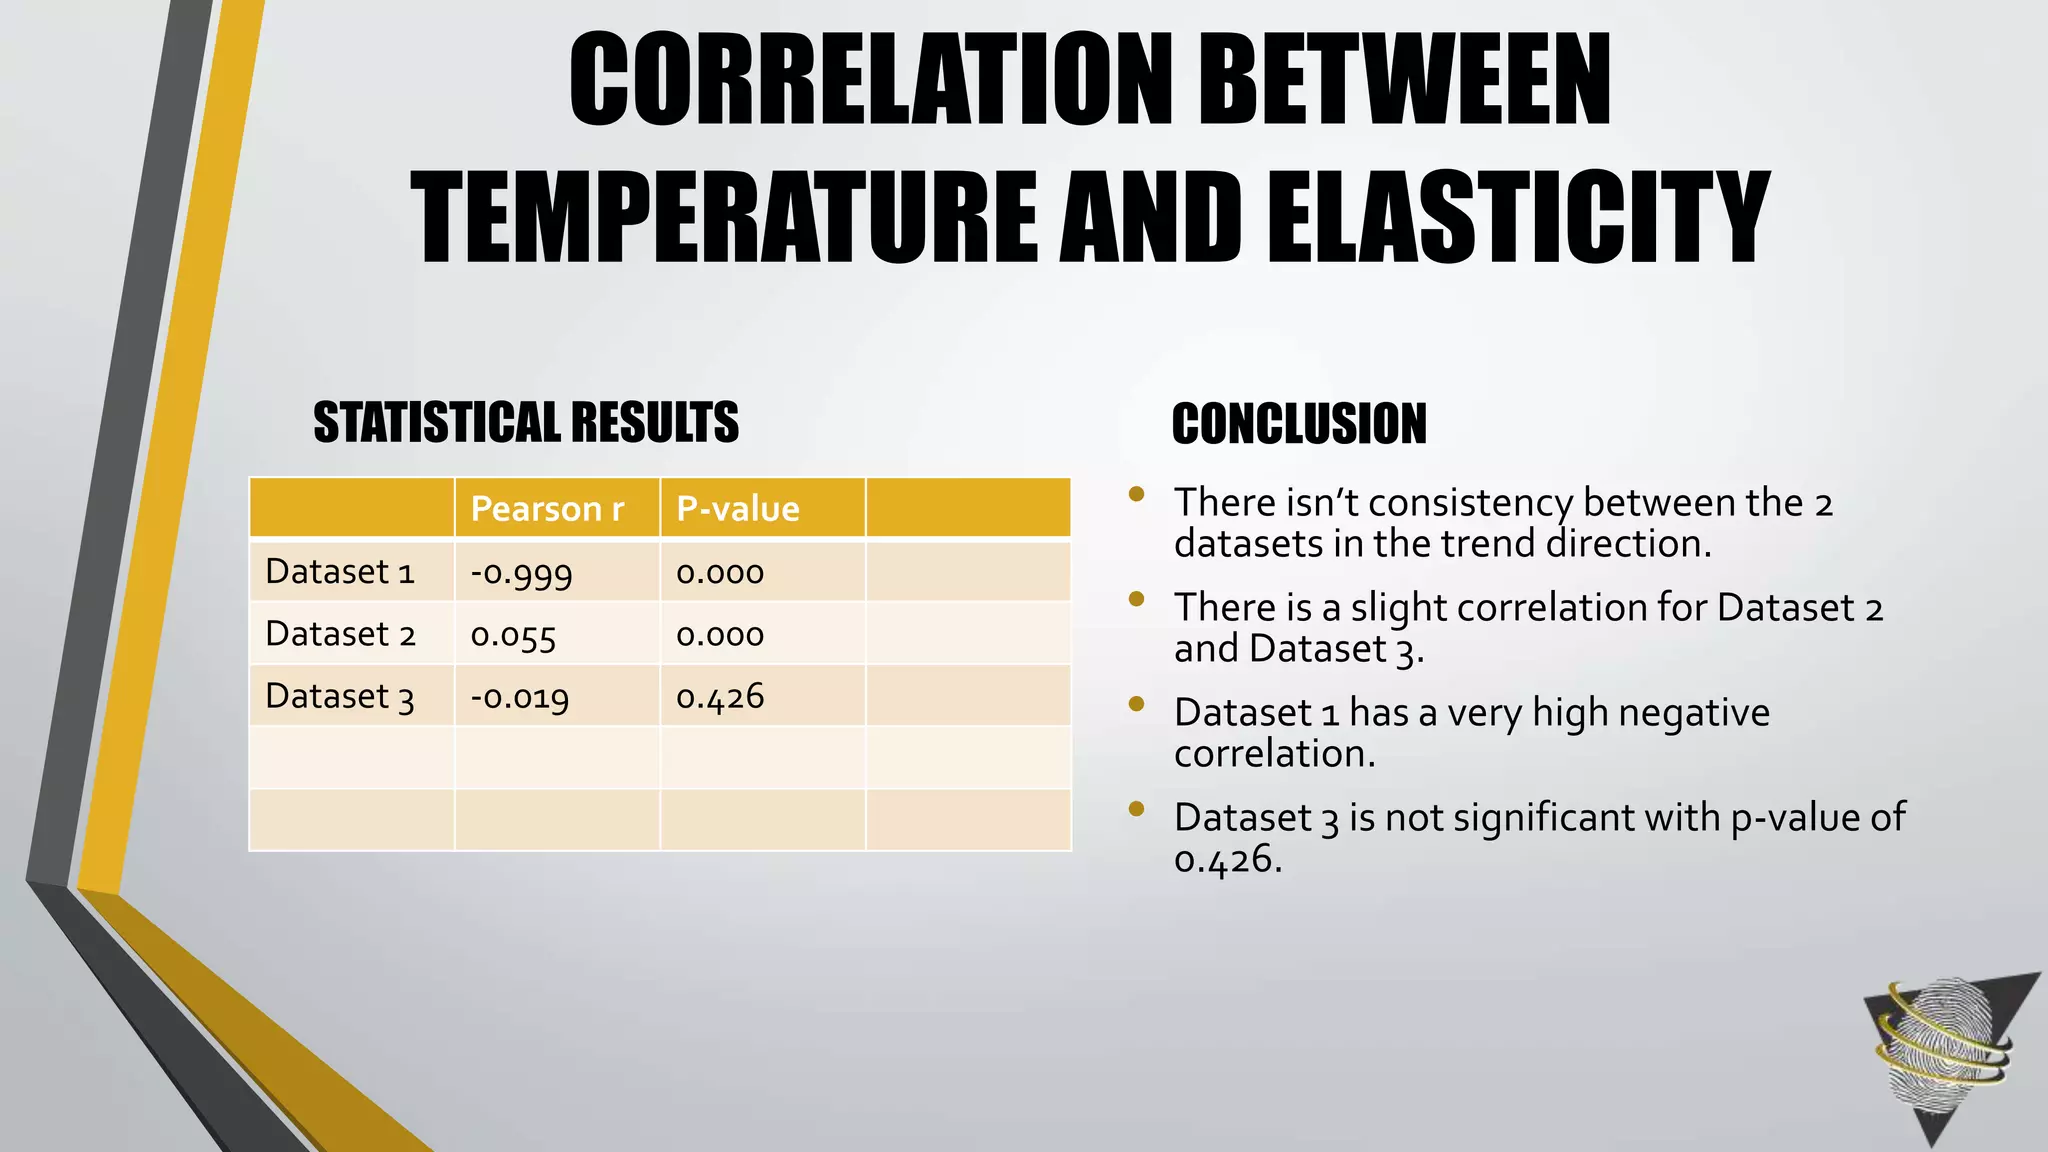
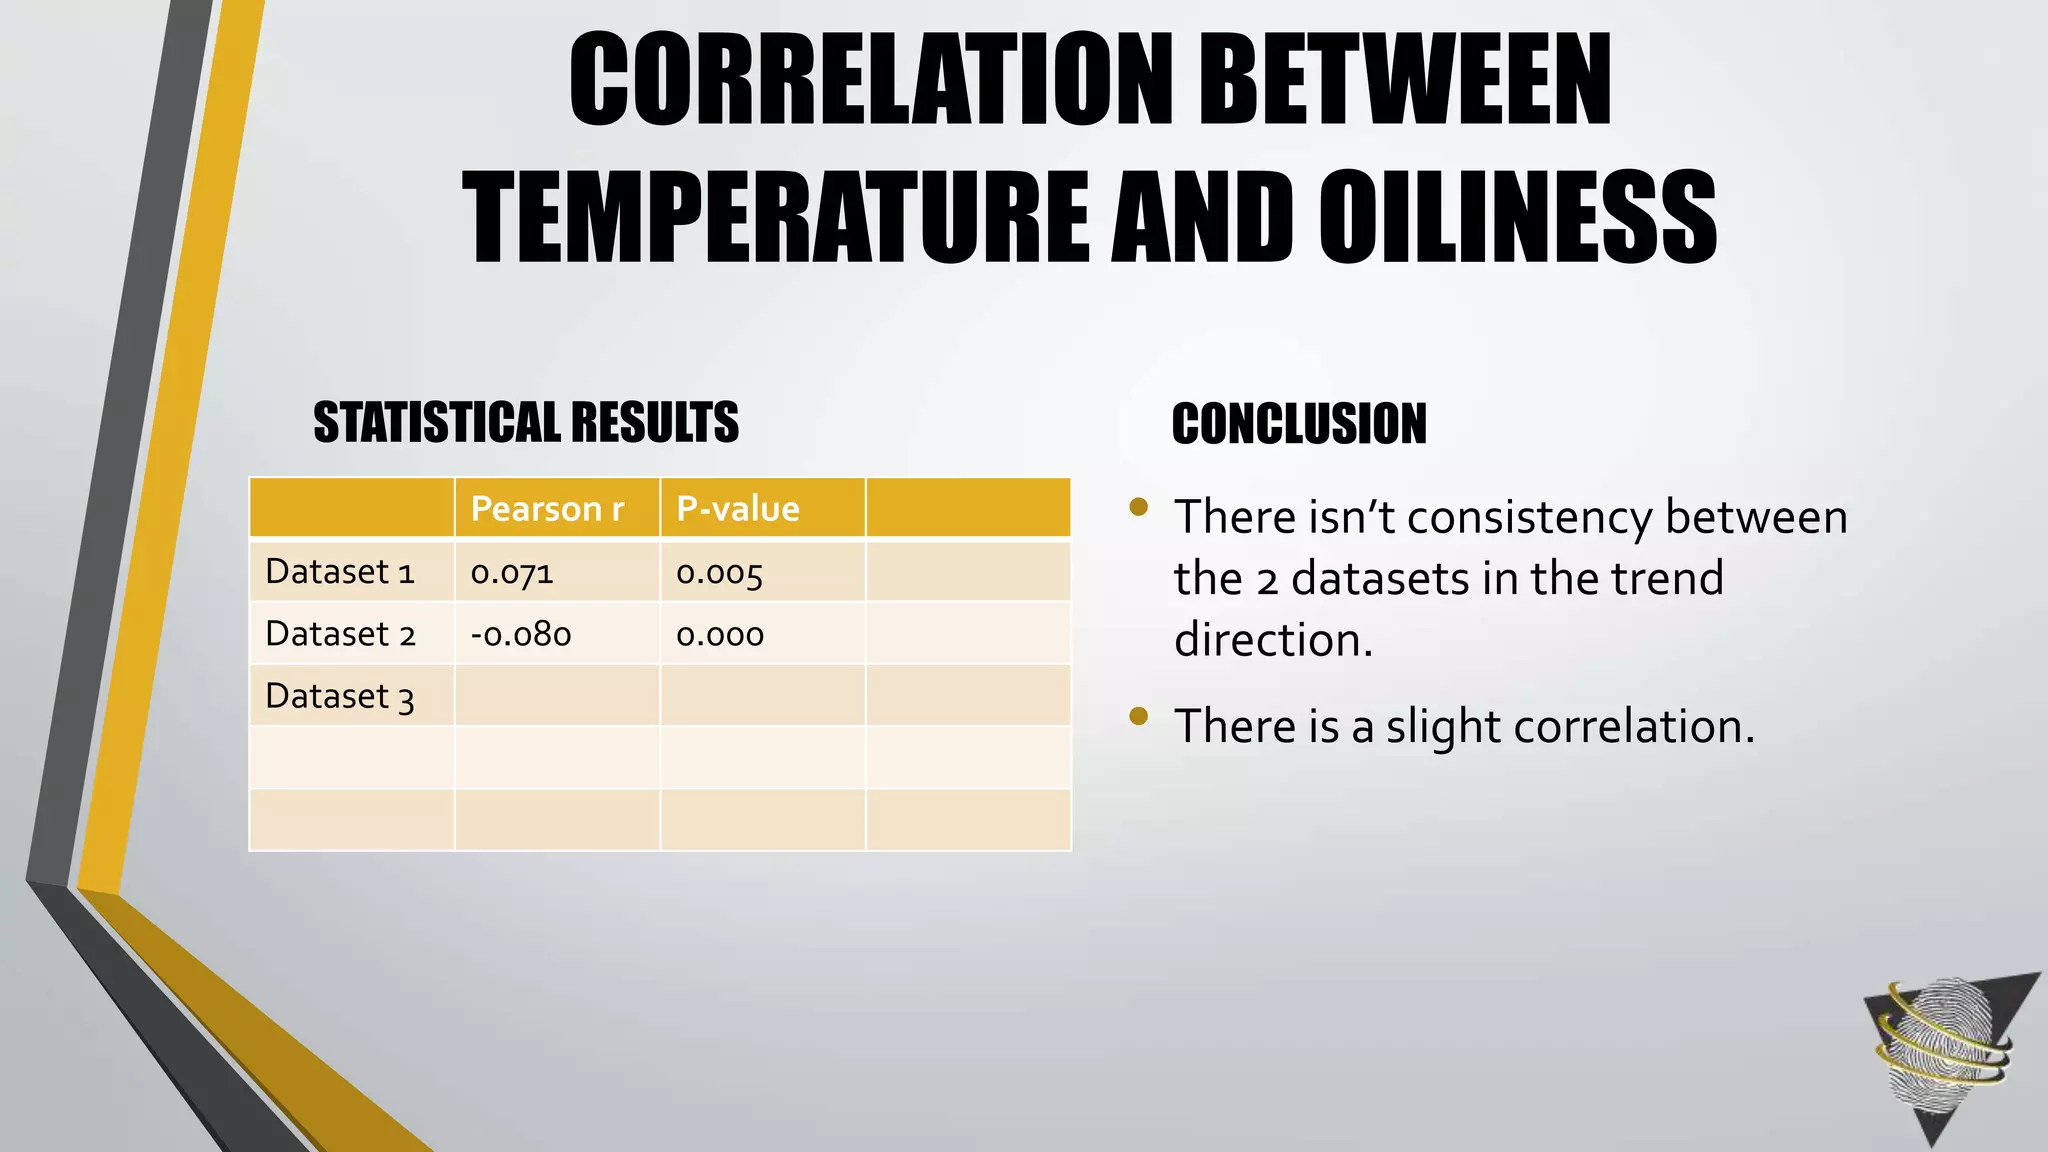
![CORRELATION
• A correlation is described as a measure of strength
of a relationship between two variables by means
of a single number called a correlation
coefficient.[19]](https://image.slidesharecdn.com/moetprojectoutlineforupload-140829151315-phpapp01/75/Understanding-Fingerprint-Skin-Characteristics-and-Image-Quality-50-2048.jpg)
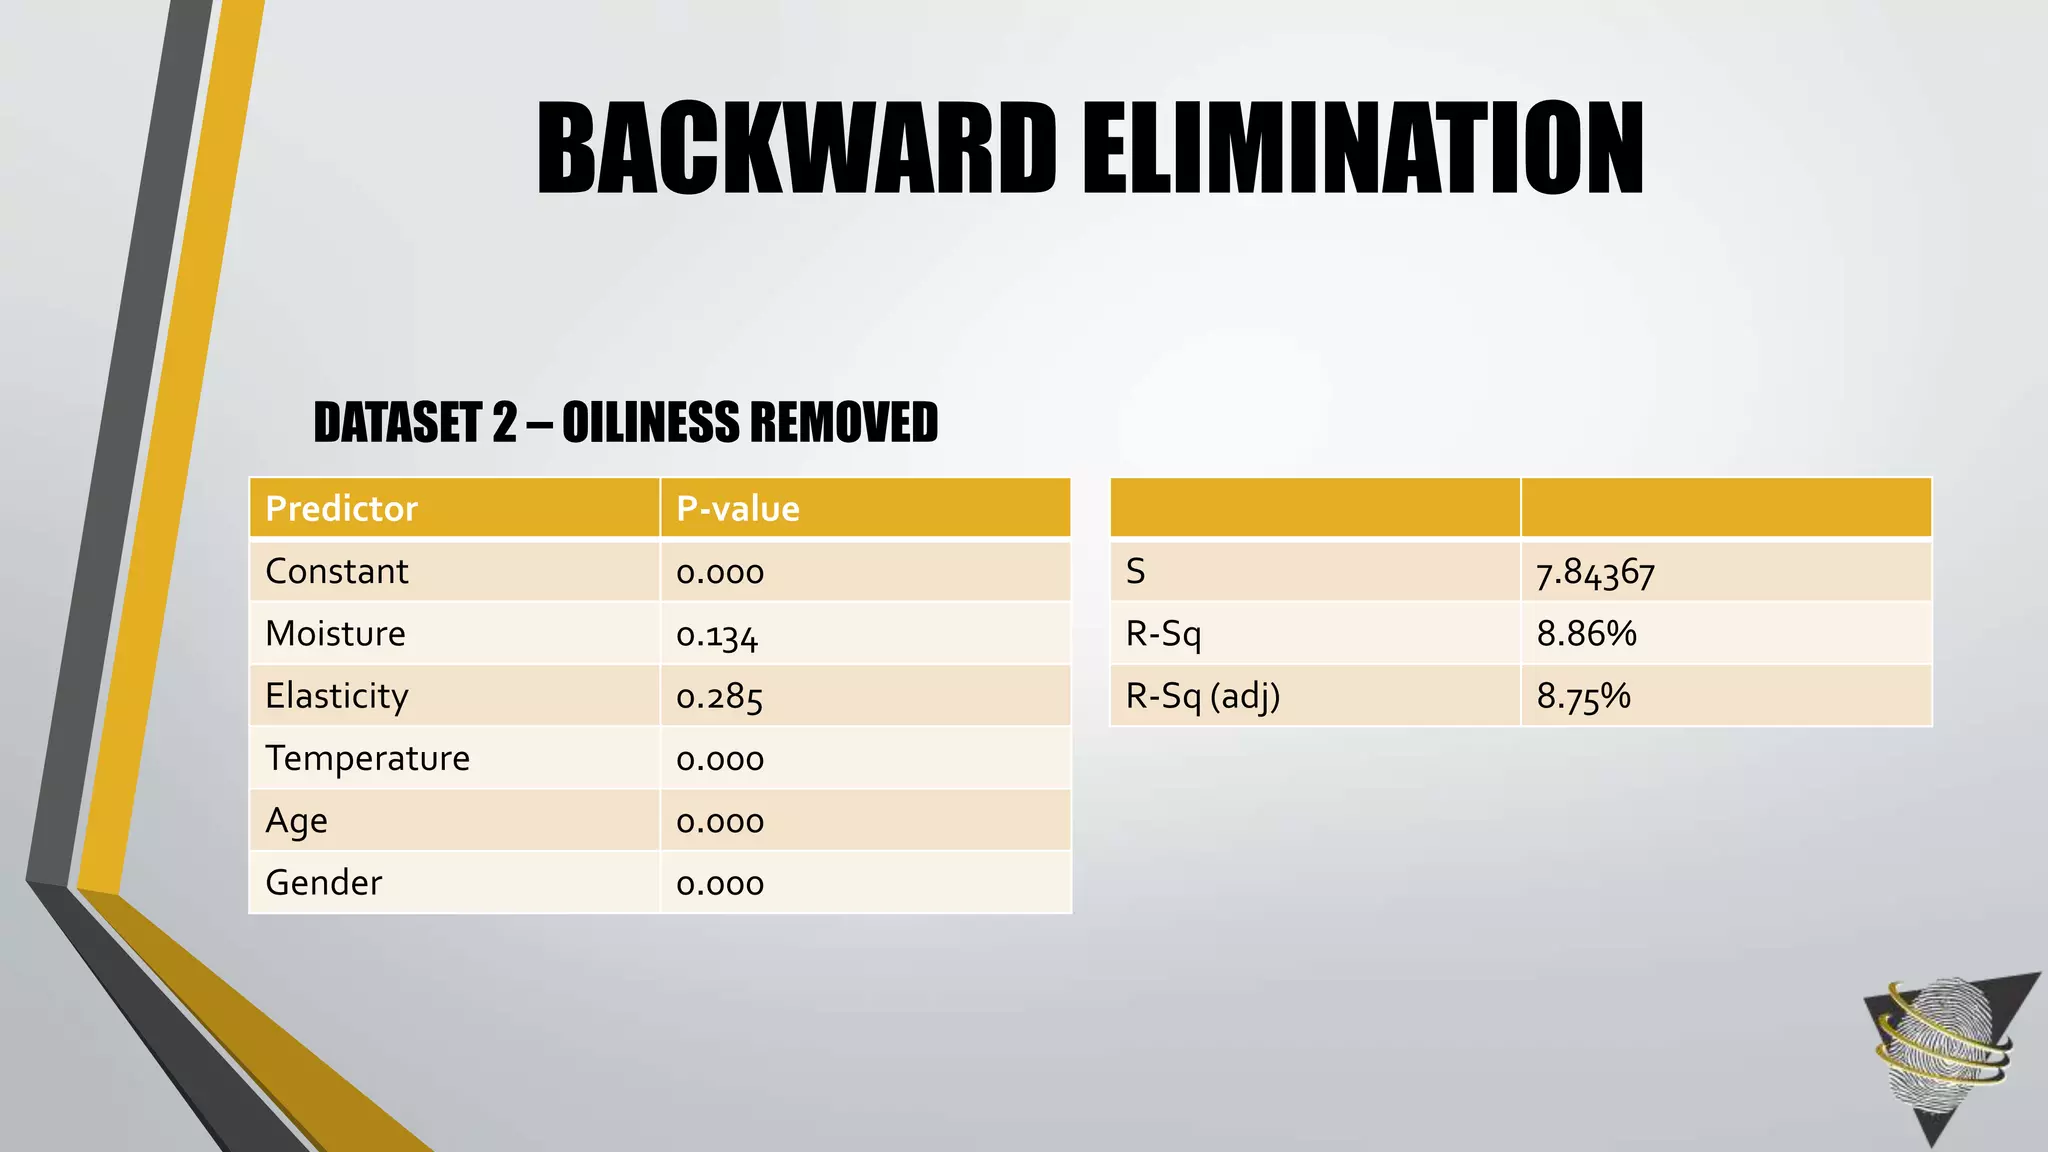
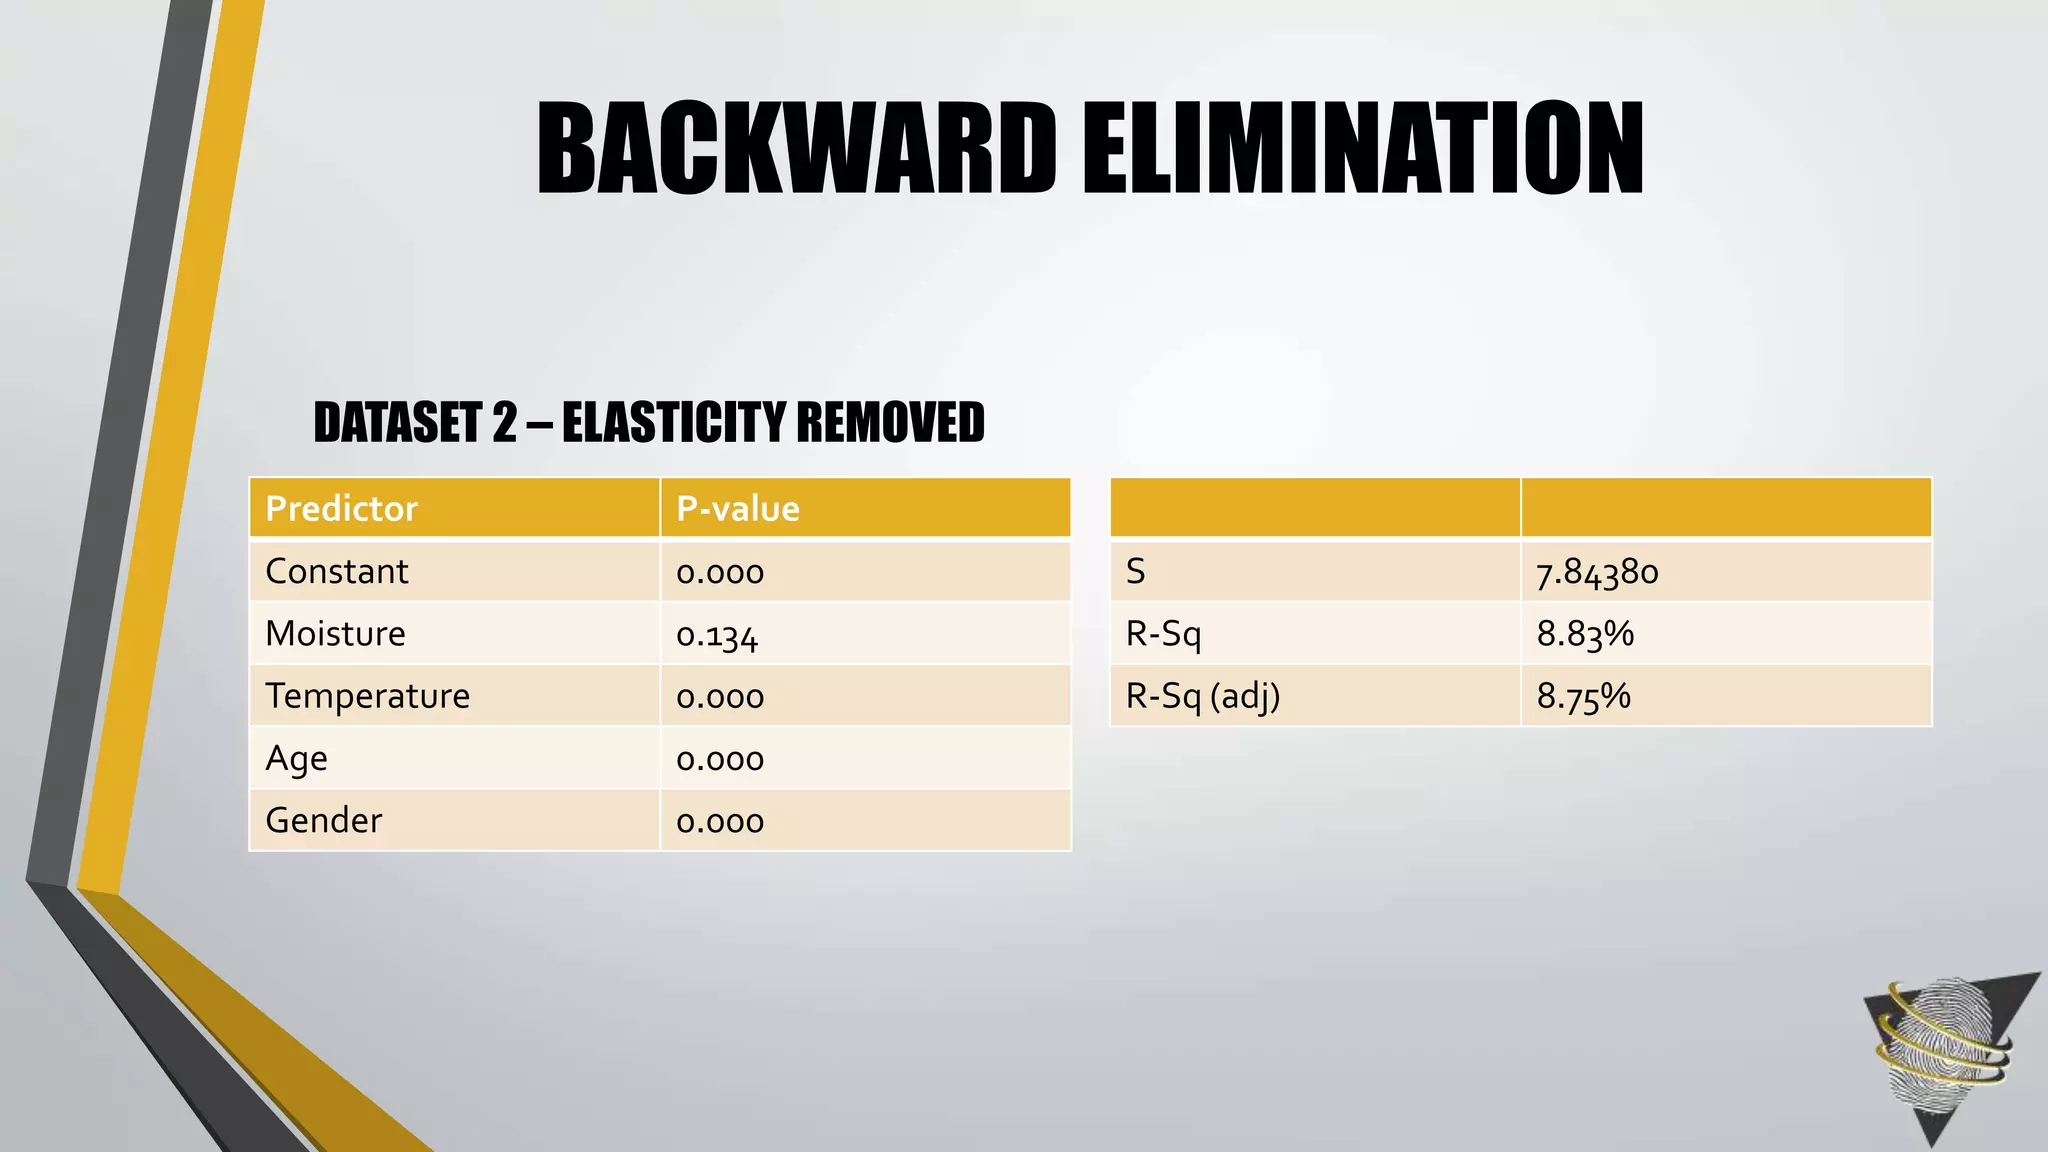
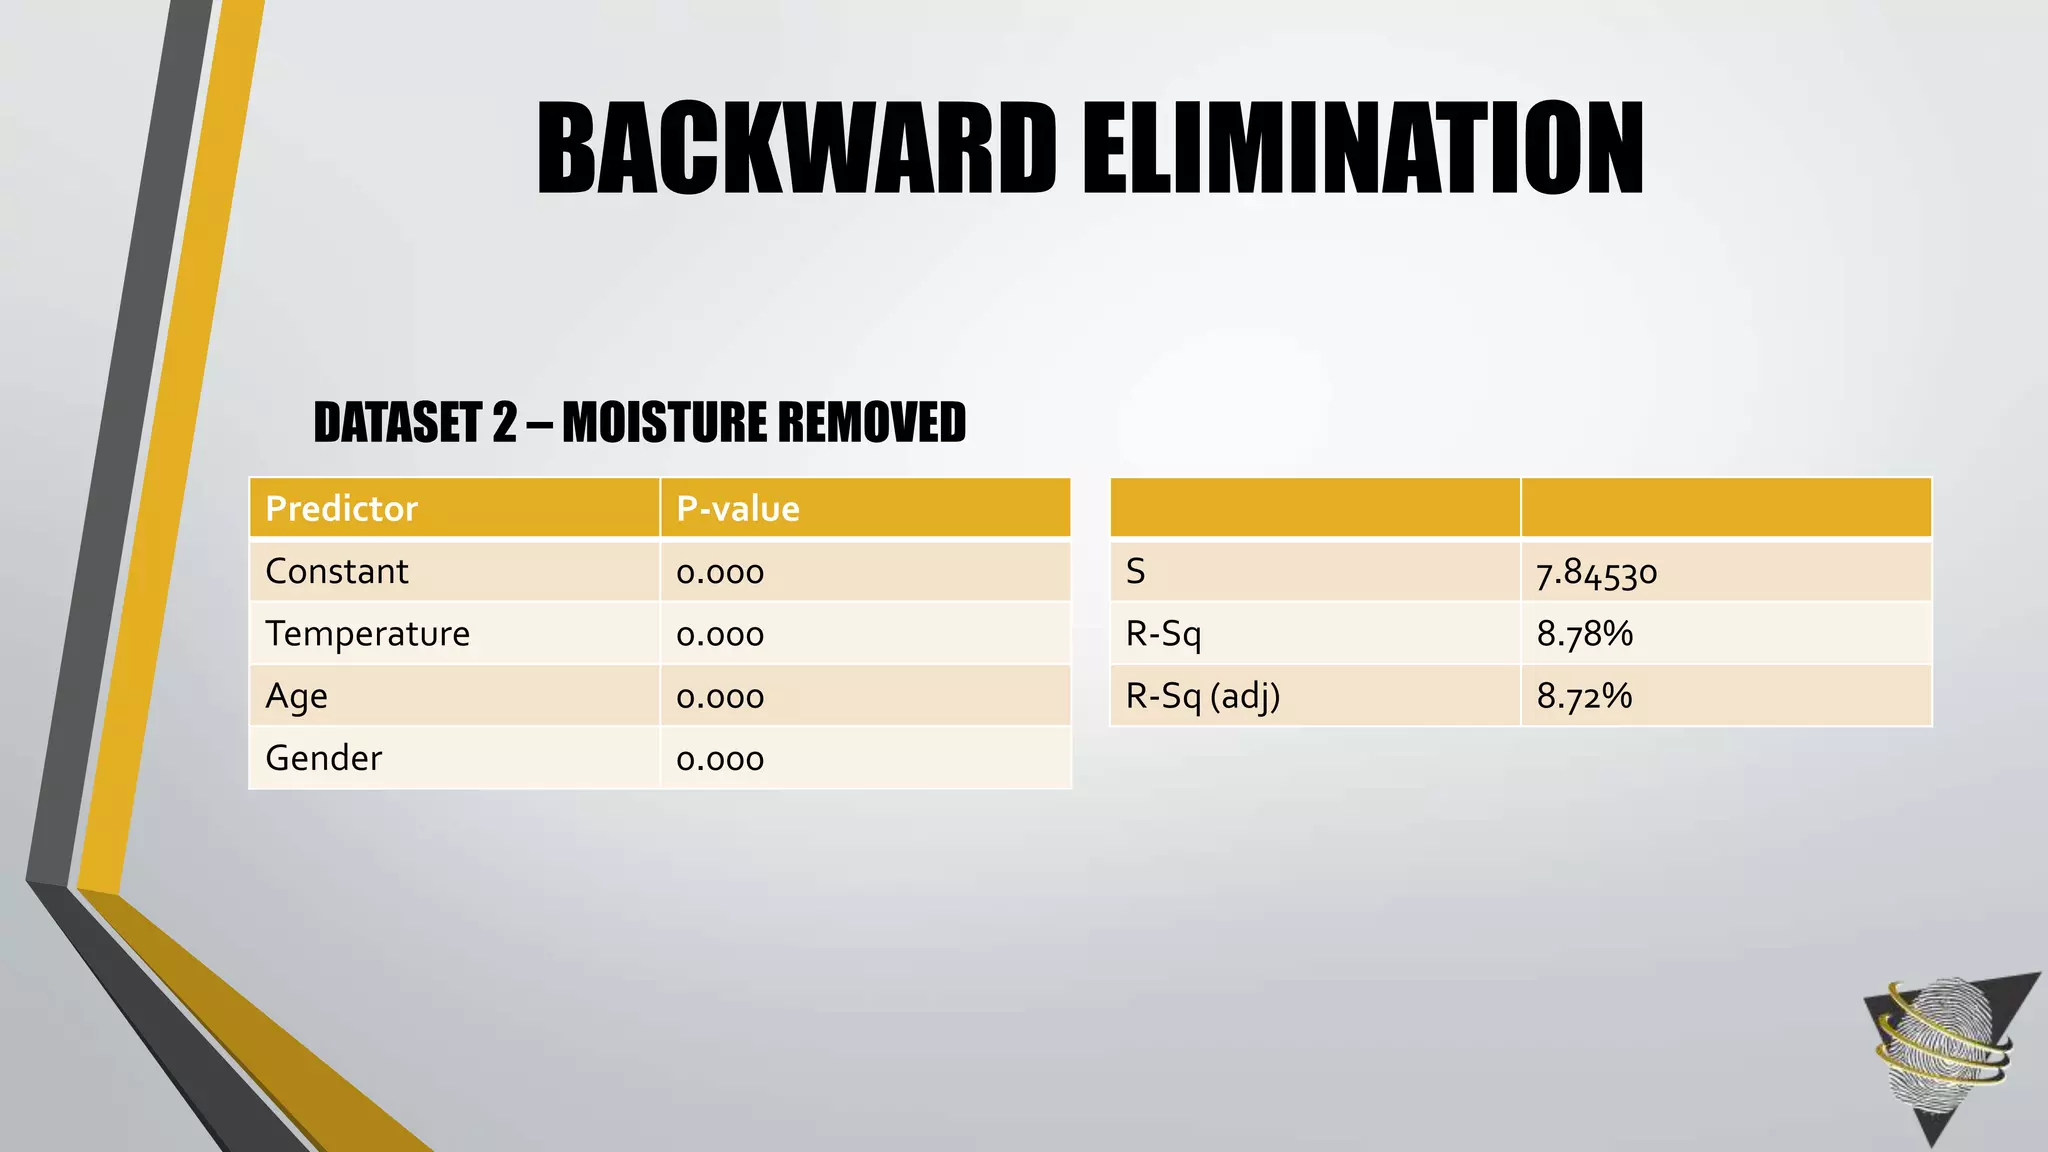
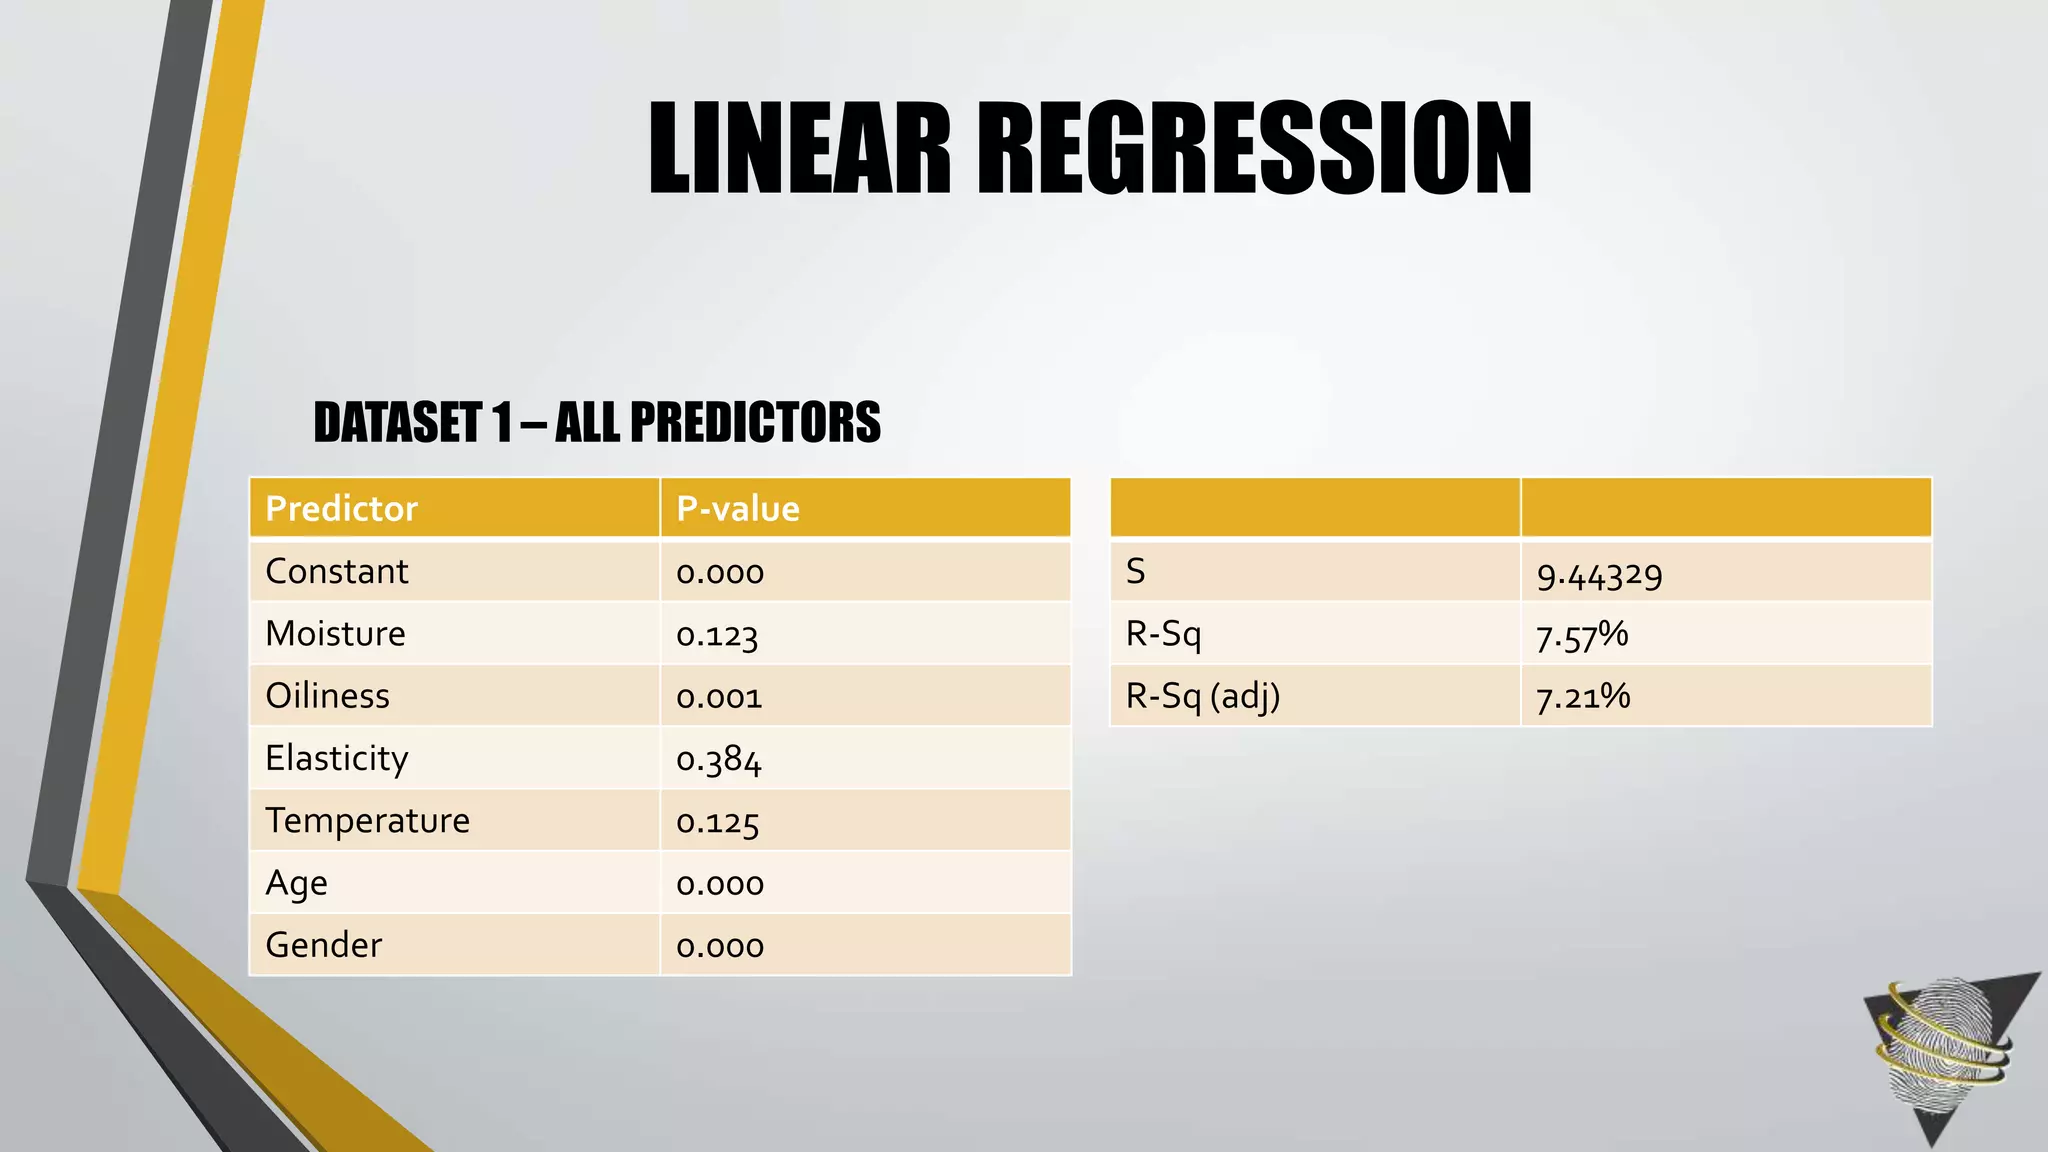
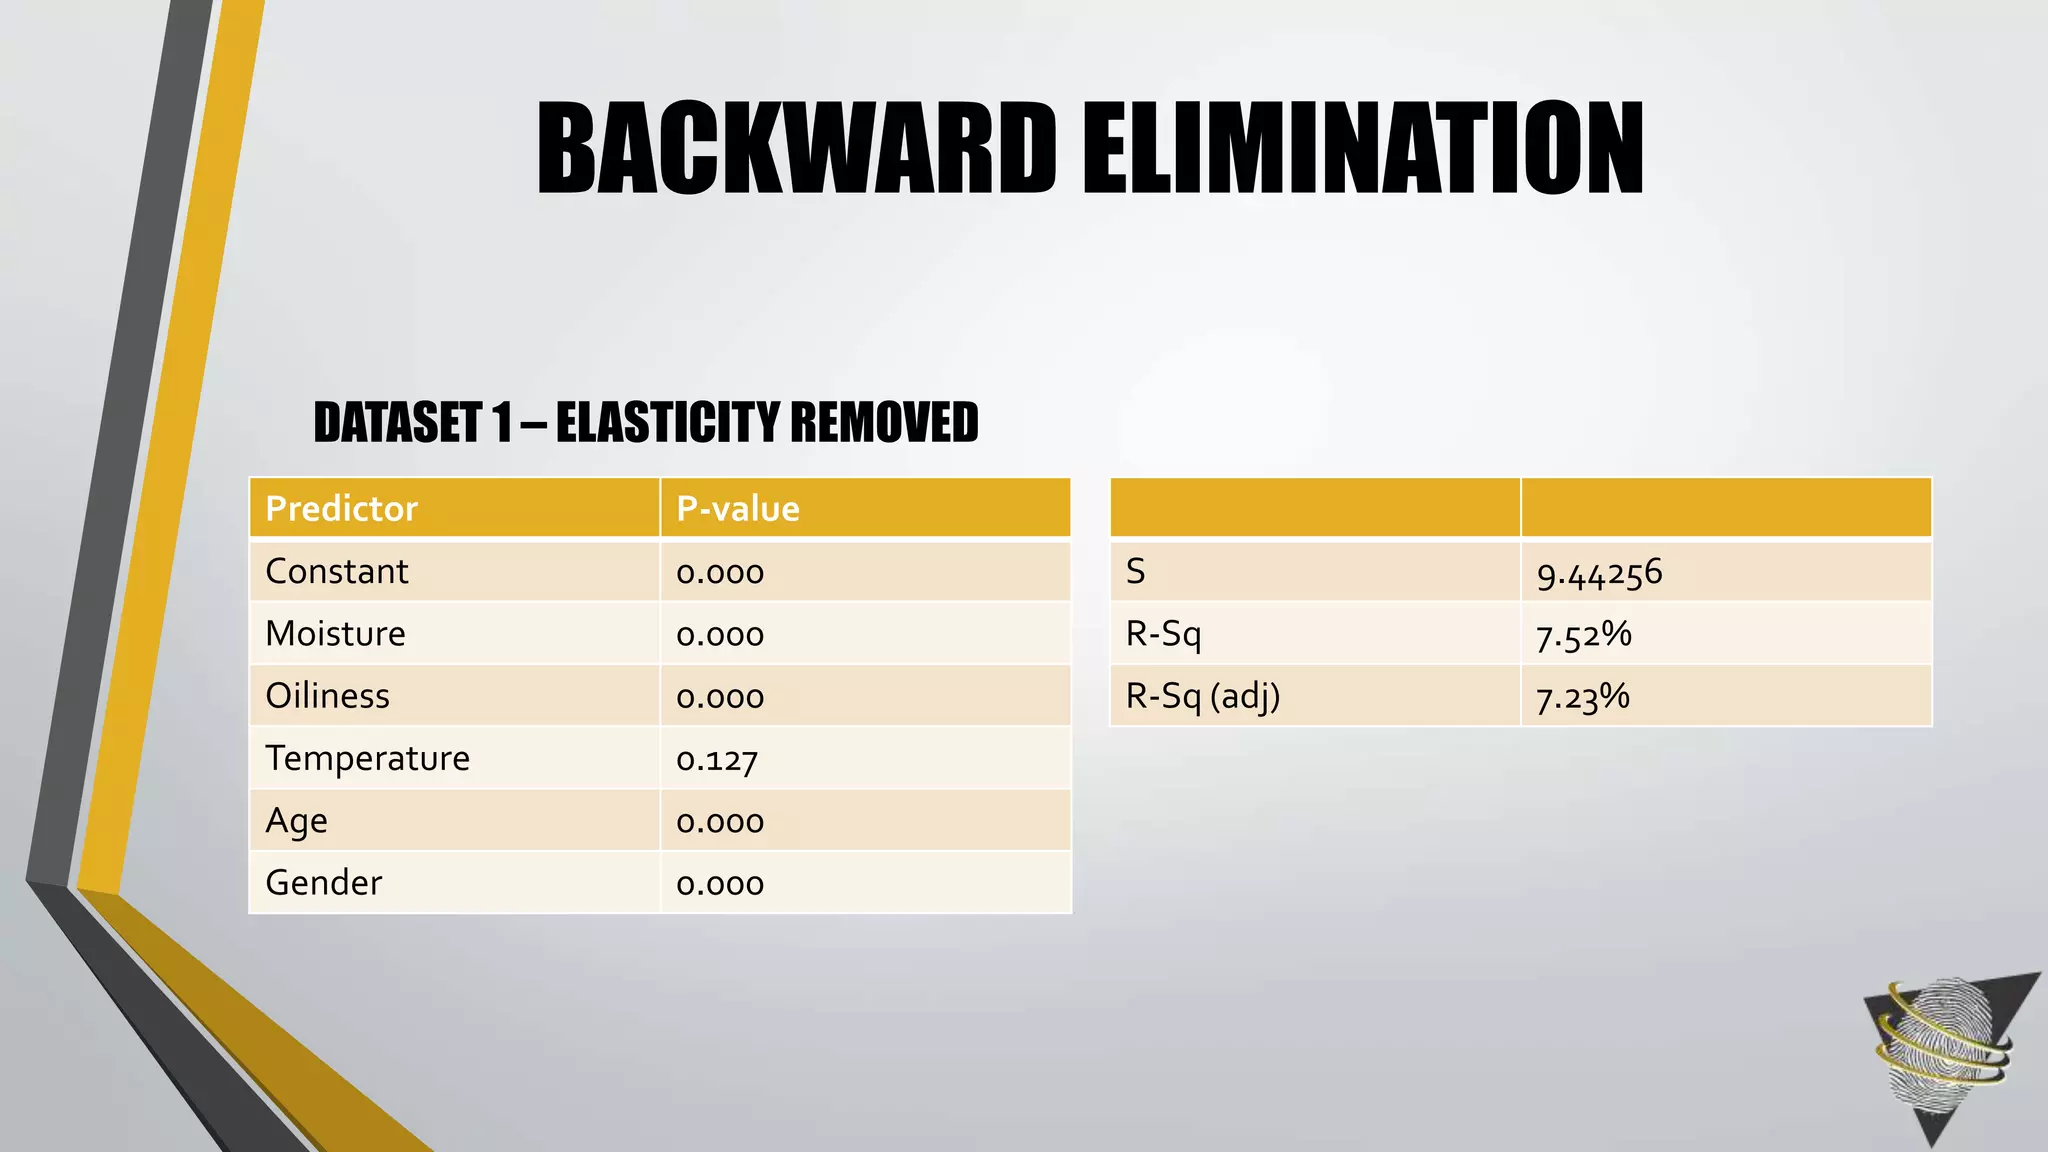
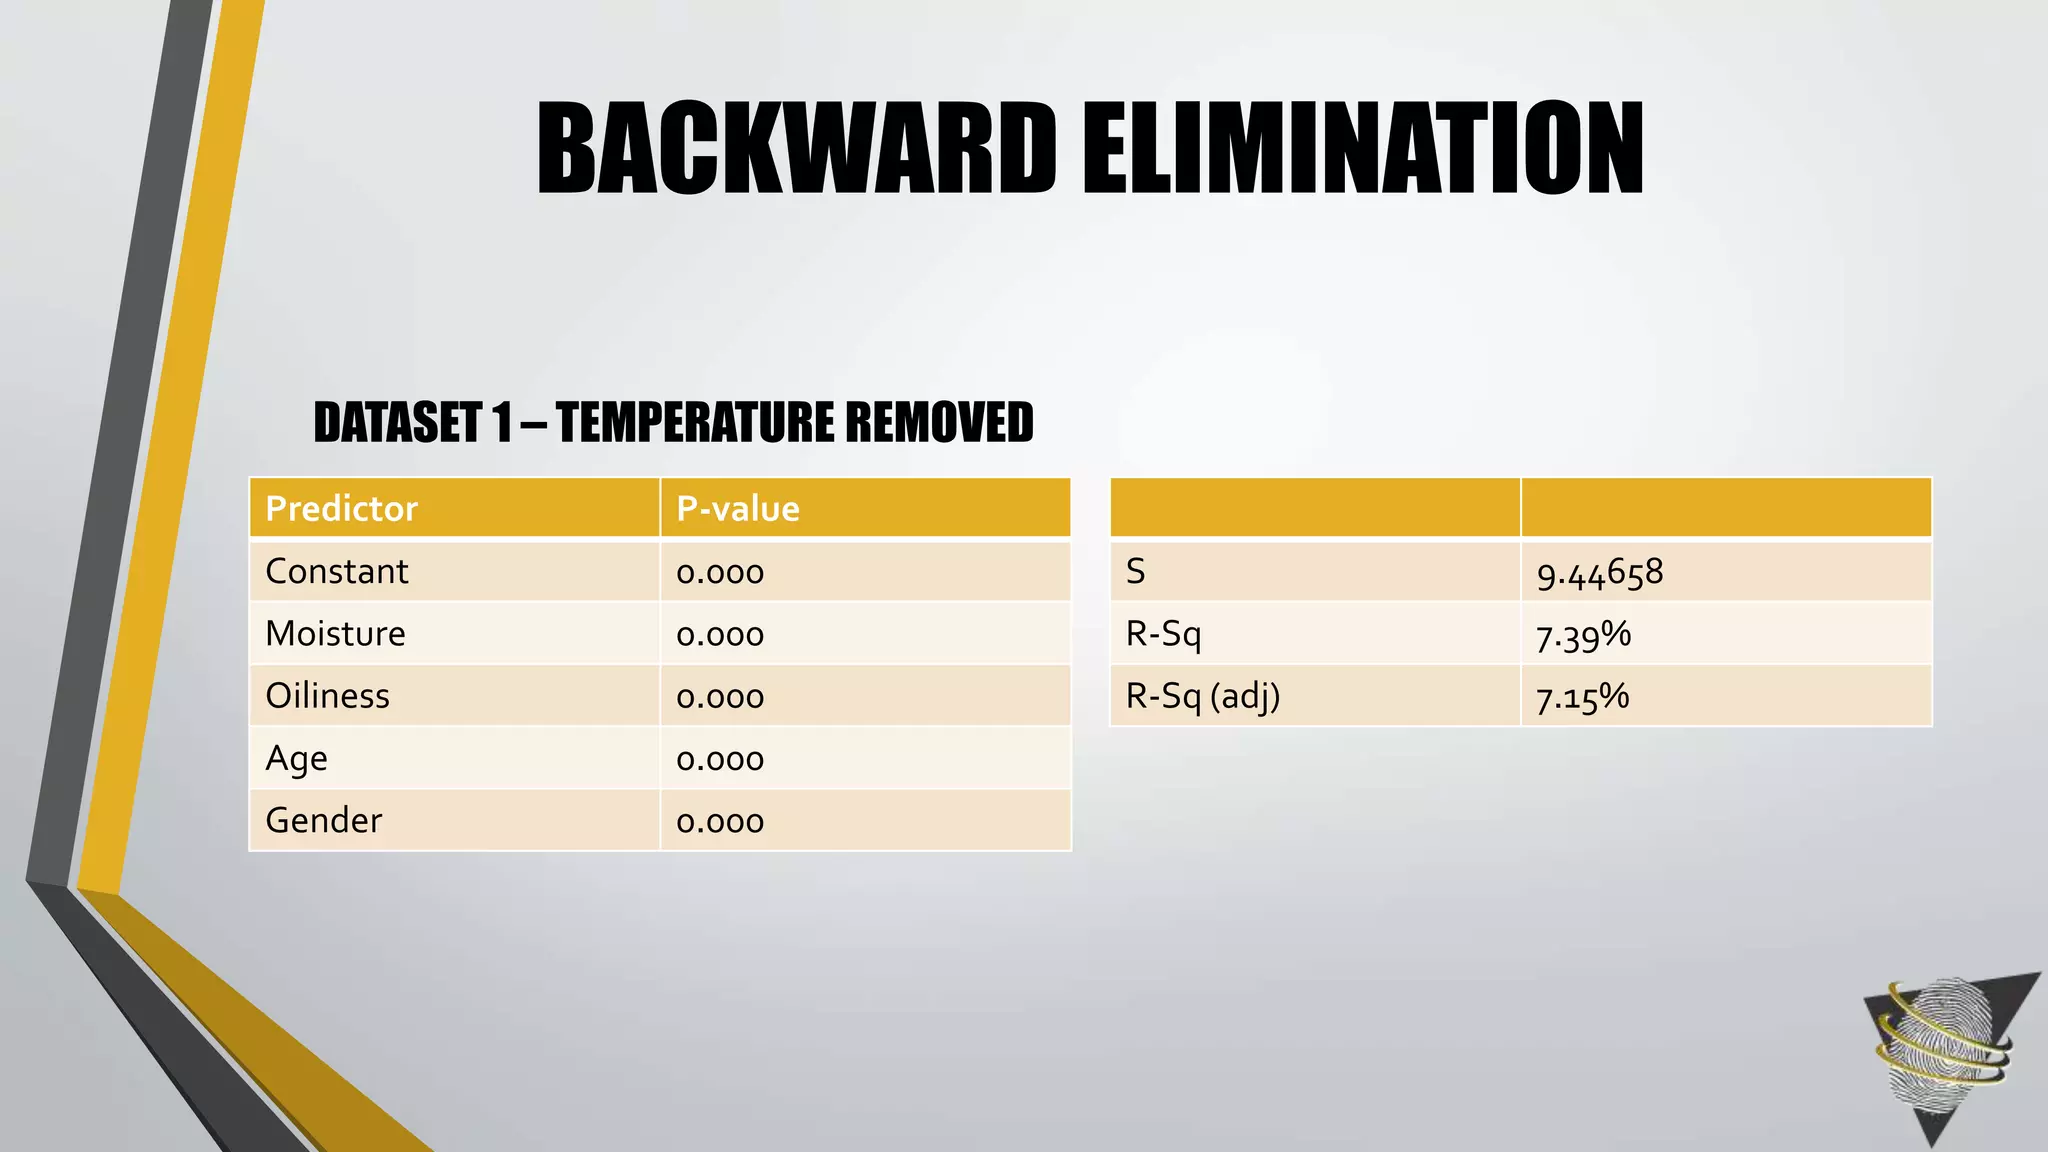
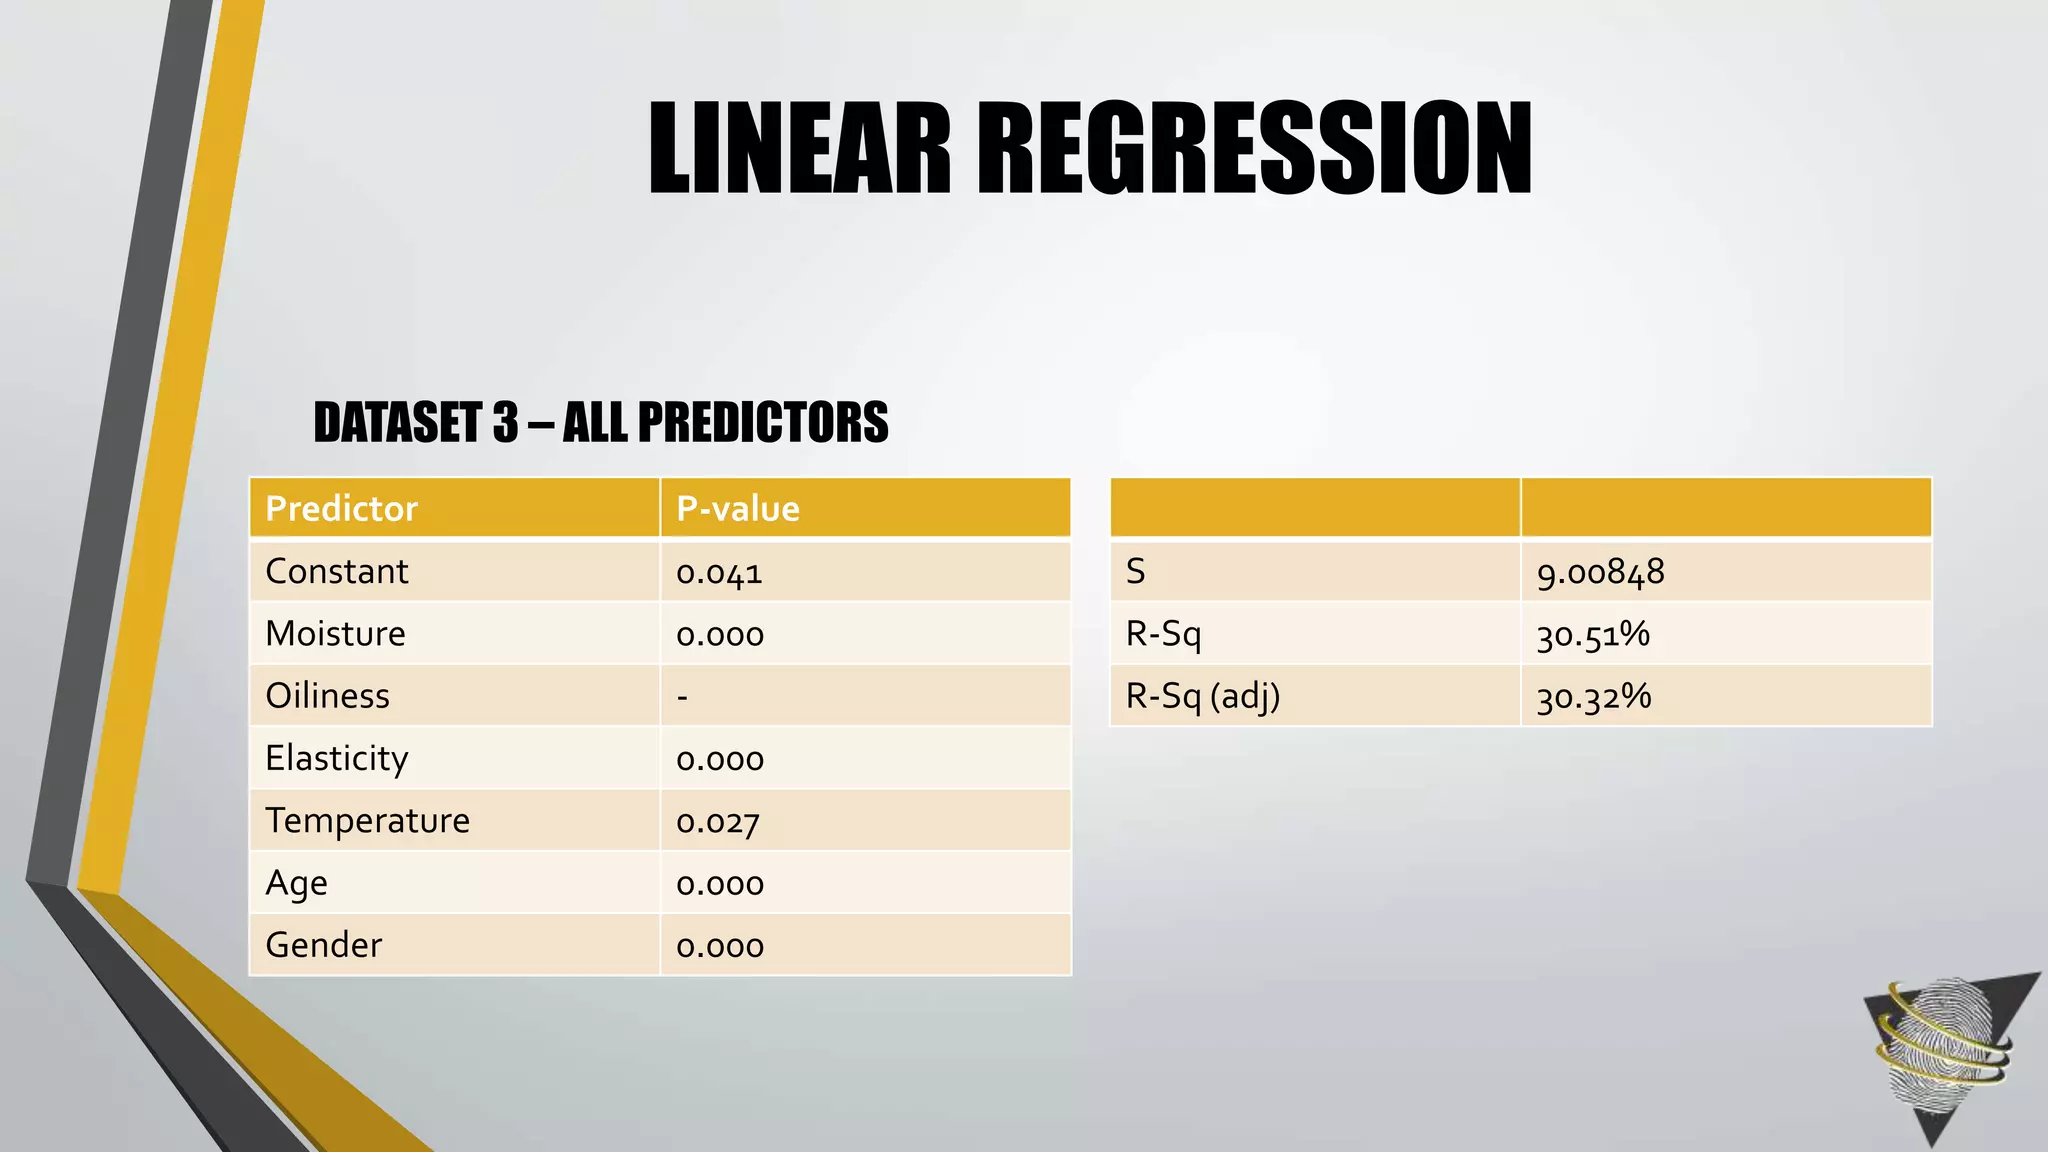
![BACKWARD ELIMINATION
• Upon performing a linear regression, backward
elimination can be completed to remove the variables
deemed to be insignificant based upon the chosen
significance level.
• In backward elimination, one variable is removed and
the linear regression is re-run until all the variables are
significant.[20]](https://image.slidesharecdn.com/moetprojectoutlineforupload-140829151315-phpapp01/75/Understanding-Fingerprint-Skin-Characteristics-and-Image-Quality-67-2048.jpg)

![REFERENCES
• [1] Aware. (2009). Identification Flats: A Revolution in Fingerprint Biometics. Retrieved from
http://www.aware.com/biometrics/pdfs/WP_IDFlats.pdf
• [2] Blomeke, C. R., Modi, S. K., & Elliott, S. J. (2008). Investigating the Relationship Between Fingerprint Image
Quality and Skin Characteristics. In International Carnahan Conference on Security Technology (pp. 158–161).
• [3] Chen, Y., Dass, S., & Jain, A. (2005). Fingerprint Quality Indices for Predicting Authentication Performance. In T.
Kanade, A. Jain, & N. K. Ratha (Eds.), Audio- and Video-Based Biometric Person Authentication (pp. 160–170).
Springer Berlin Heidelberg. doi:10.1007/11527923_17
• [4] Elasticity. (2014). merriam-webster.com. Retrieved from http://www.merriam-webster.com/dictionary/elasticity
• [5] Elliott, S. J., & Kukula, E. P. (2010). A Definitional Framework for the Human-Biometric Sensor Interaction
Model. In B. V. K. Vijaya Kumar, S. Prabhakar, & A. A. Ross (Eds.), Biometric Technology for Human Identification VII
(Vol. 7667, pp. 1–8). doi:10.1117/12.850595](https://image.slidesharecdn.com/moetprojectoutlineforupload-140829151315-phpapp01/75/Understanding-Fingerprint-Skin-Characteristics-and-Image-Quality-79-2048.jpg)
![REFERENCES
• [6] Gilchrest, B. a. (1996). A review of skin ageing and its medical therapy. The British journal of dermatology,
135(6), 867–75. Retrieved from http://www.ncbi.nlm.nih.gov/pubmed/8977705
• [7] Kang, H., Lee, B., Kim, H., Shin, D., & Kim, J. (2003). A Study on Performance Evaluation of Fingerprint Sensors
Performance Evaluation Model for Biometric Products. In Audio- and Video-Based Biometric Person Authentication
(pp. 574–583). Springer-Verlag.
• [8] Modi, S. K., Elliott, S. J., Whetsone, J., & Kim, H. (2007). Impact of Age Groups on Fingerprint Recognition
Performance. In 2007 IEEE Workshop on Automatic Identification Advanced Technologies (pp. 19–23).
doi:10.1109/AUTOID.2007.380586
• [9] Moisture. (2014). merriam-webster.com. Retrieved from http://www.merriam-webster.com/dictionary/moisture
• [10] Oiliness. (2014). merriam-webster.com. Retrieved from http://www.merriam-webster.com/dictionary/oiliness](https://image.slidesharecdn.com/moetprojectoutlineforupload-140829151315-phpapp01/75/Understanding-Fingerprint-Skin-Characteristics-and-Image-Quality-80-2048.jpg)
![REFERENCES
• [11] OpenStax College. (2013). Layers of the Skin. Retrieved from http://cnx.org/content/m46060/latest/
• [12] Pore. (2014). merriam-webster.com. Retrieved from http://www.merriam-webster.com/dictionary/pore
• [13] Resilience. (2014). merriam-webster.com. Retrieved from http://www.merriam-webster.
com/dictionary/resilience
• [14] Ryu, H. S., Joo, Y. H., Kim, S. O., Park, K. C., & Youn, S. W. (2008). Influence of age and regional differences on
skin elasticity as measured by the Cutometer. Skin Research and Technology, 14(3), 354–358. doi:10.1111/j.1600-
0846.2008.00302.x
• [15] Scheidat, T., Heinze, J., Vielhauer, C., Dittmann, J., & Kraetzer, C. (2011). Comparative Review of Studies on
Aging Effects in Context of Biometric Authentication. In D. Akopian, R. Creutzburg, C. G. M. Snoek, N. Sebe, & L.
Kennedy (Eds.), (Vol. 7881, pp. 788110–1 – 788110–9). doi:10.1117/12.872417
• [16] Senior, A., & Bolle, R. (2001). Improved Fingerprint Matching by Distortion Removal. IEICE Transactions on
Information and Systems, E84(7), 825–831.](https://image.slidesharecdn.com/moetprojectoutlineforupload-140829151315-phpapp01/75/Understanding-Fingerprint-Skin-Characteristics-and-Image-Quality-81-2048.jpg)
![REFERENCES
• [17] Tabassi, E., & Grother, P. (2009). Fingerprint Image Quality. In Encyclopedia of Biometrics. doi:10.1007/978-0-
387-73003-5_257
• [18] Thody, A. J., & Shuster, S. (1989). Control and function of sebaceous glands. Physiological Reviews, 69, 383–
416.
• [19] Walpole, R., Myers, R., Myers, S., & Ye, K. (2007). Correlation. In Probability and Statistics for Engineers and
Scientists 8th Ed. (8th ed., pp. 432–436). Pearson Prentice Hall.
• [20] Walpole, R., Myers, R., Myers, S., & Ye, K. (2007). Sequential Methods for Model Selection. In Probability and
Statistics for Engineers and Scientists (8th ed., pp. 479–485). Pearson Prentice Hall.
• [21] Wang, L. (2013). The Effect of Force on Fingerprint Image Quality and Fingerprint Distortion. International
Journal of Electrical and Computer Engineering (IJECE), 3(3), 294–300. Retrieved from
http://iaesjournal.com/online/index.php/IJECE/article/view/2489/pdf
• [22] Yun, E.-K., & Cho, S.-B. (2006). Adaptive Fingerprint Image Enhancement with Fingerprint Image Quality
Analysis. Image and Vision Computing, 24(1), 101–110. doi:10.1016/j.imavis.2005.09.017](https://image.slidesharecdn.com/moetprojectoutlineforupload-140829151315-phpapp01/75/Understanding-Fingerprint-Skin-Characteristics-and-Image-Quality-82-2048.jpg)

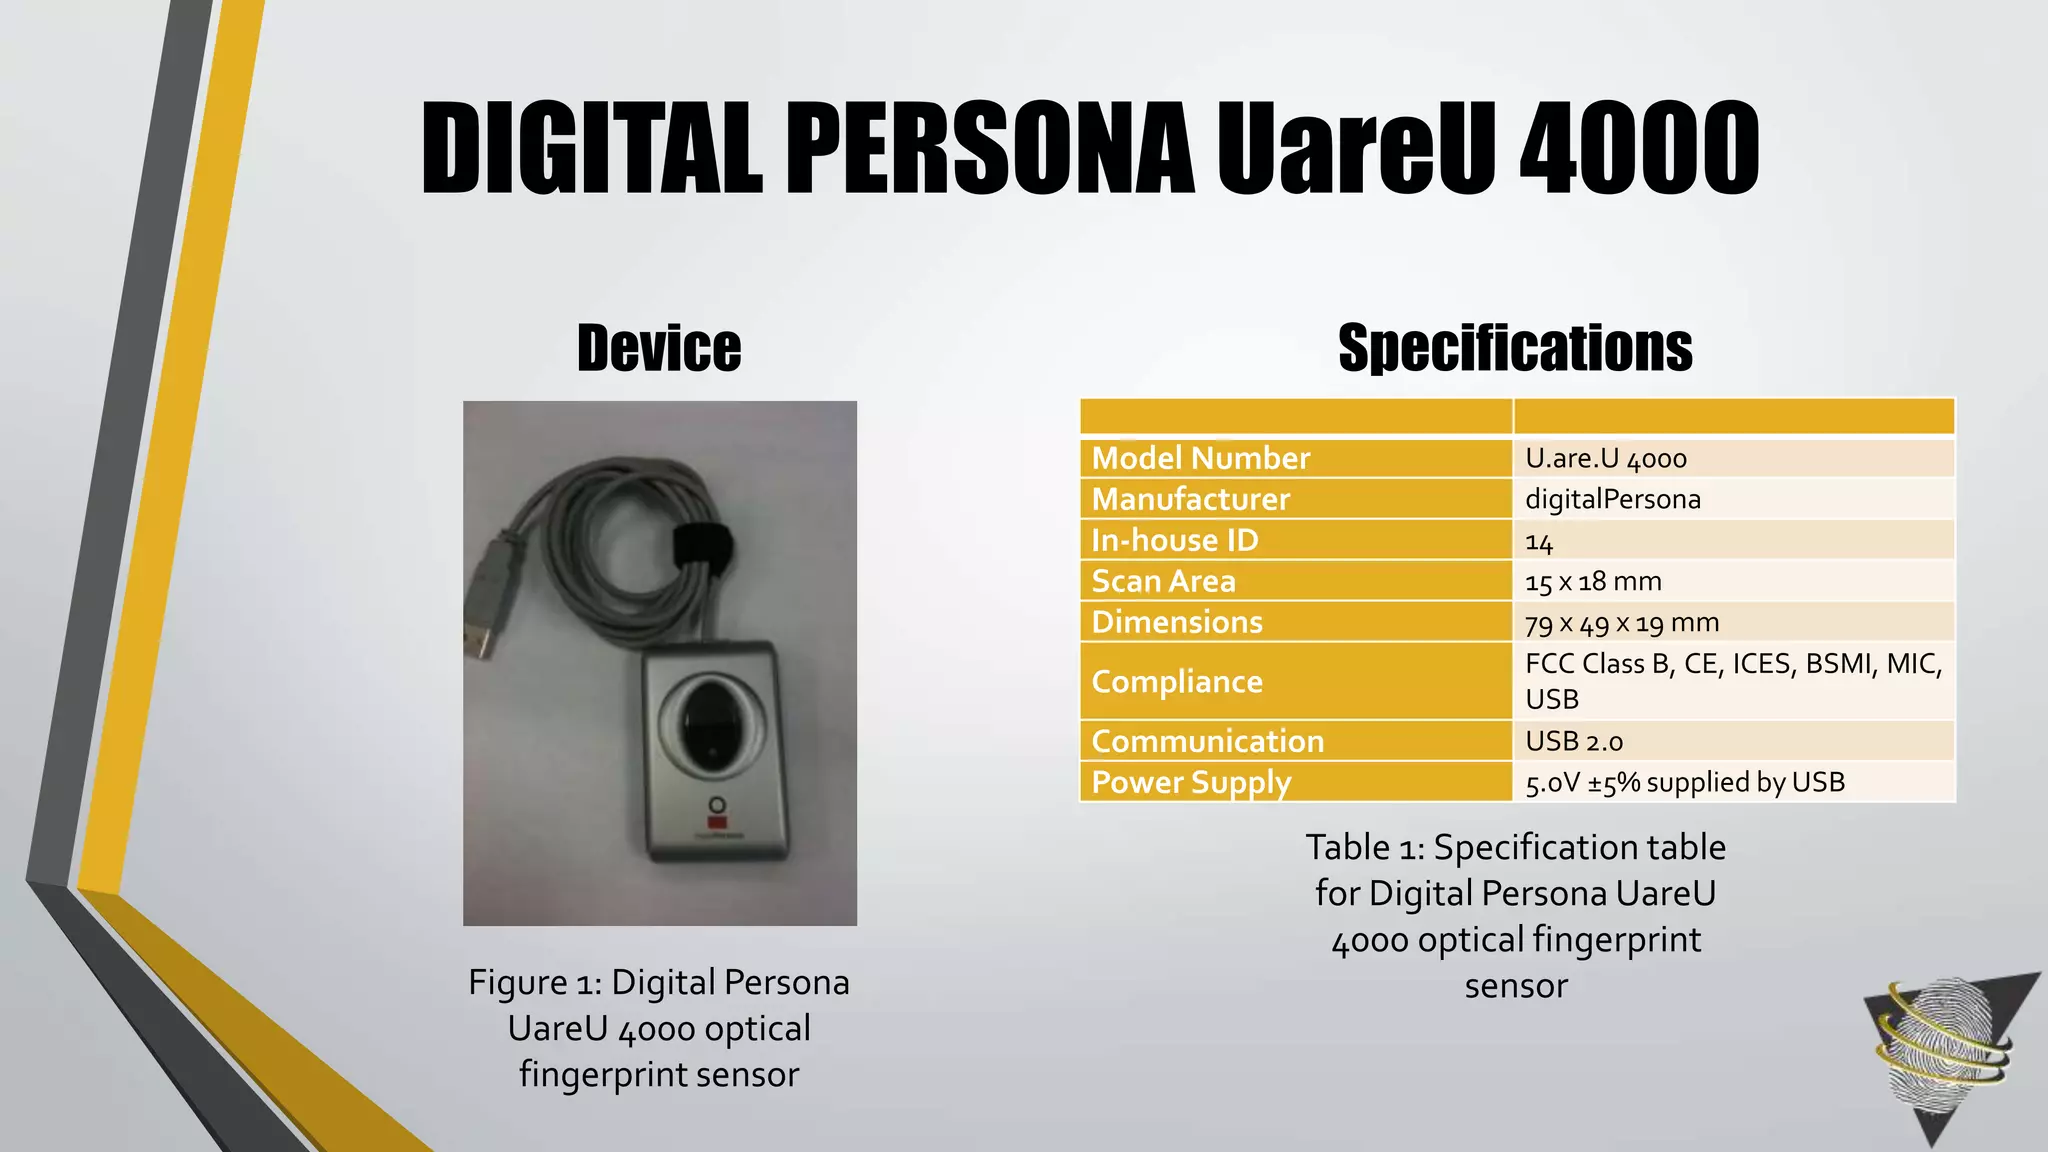
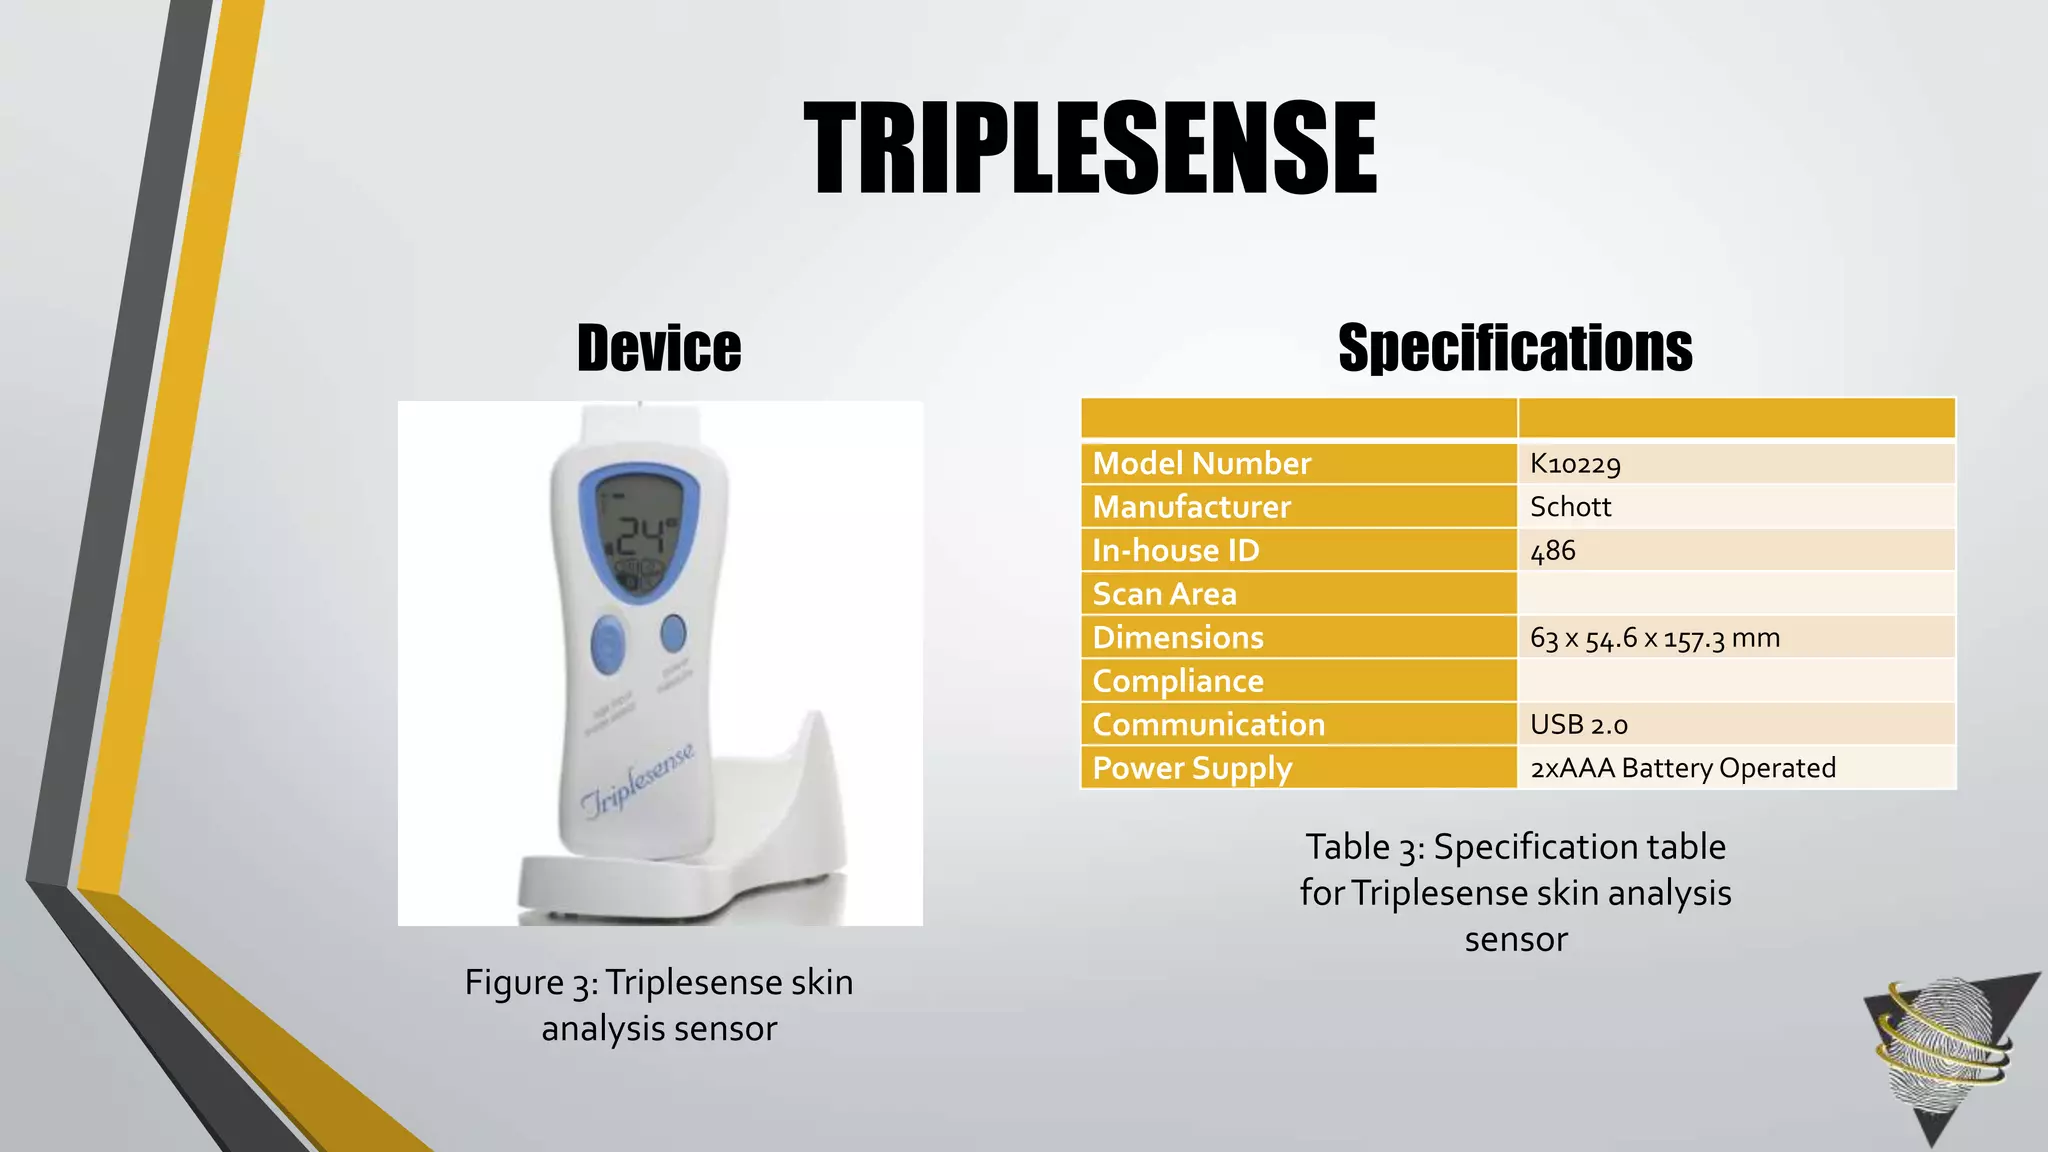
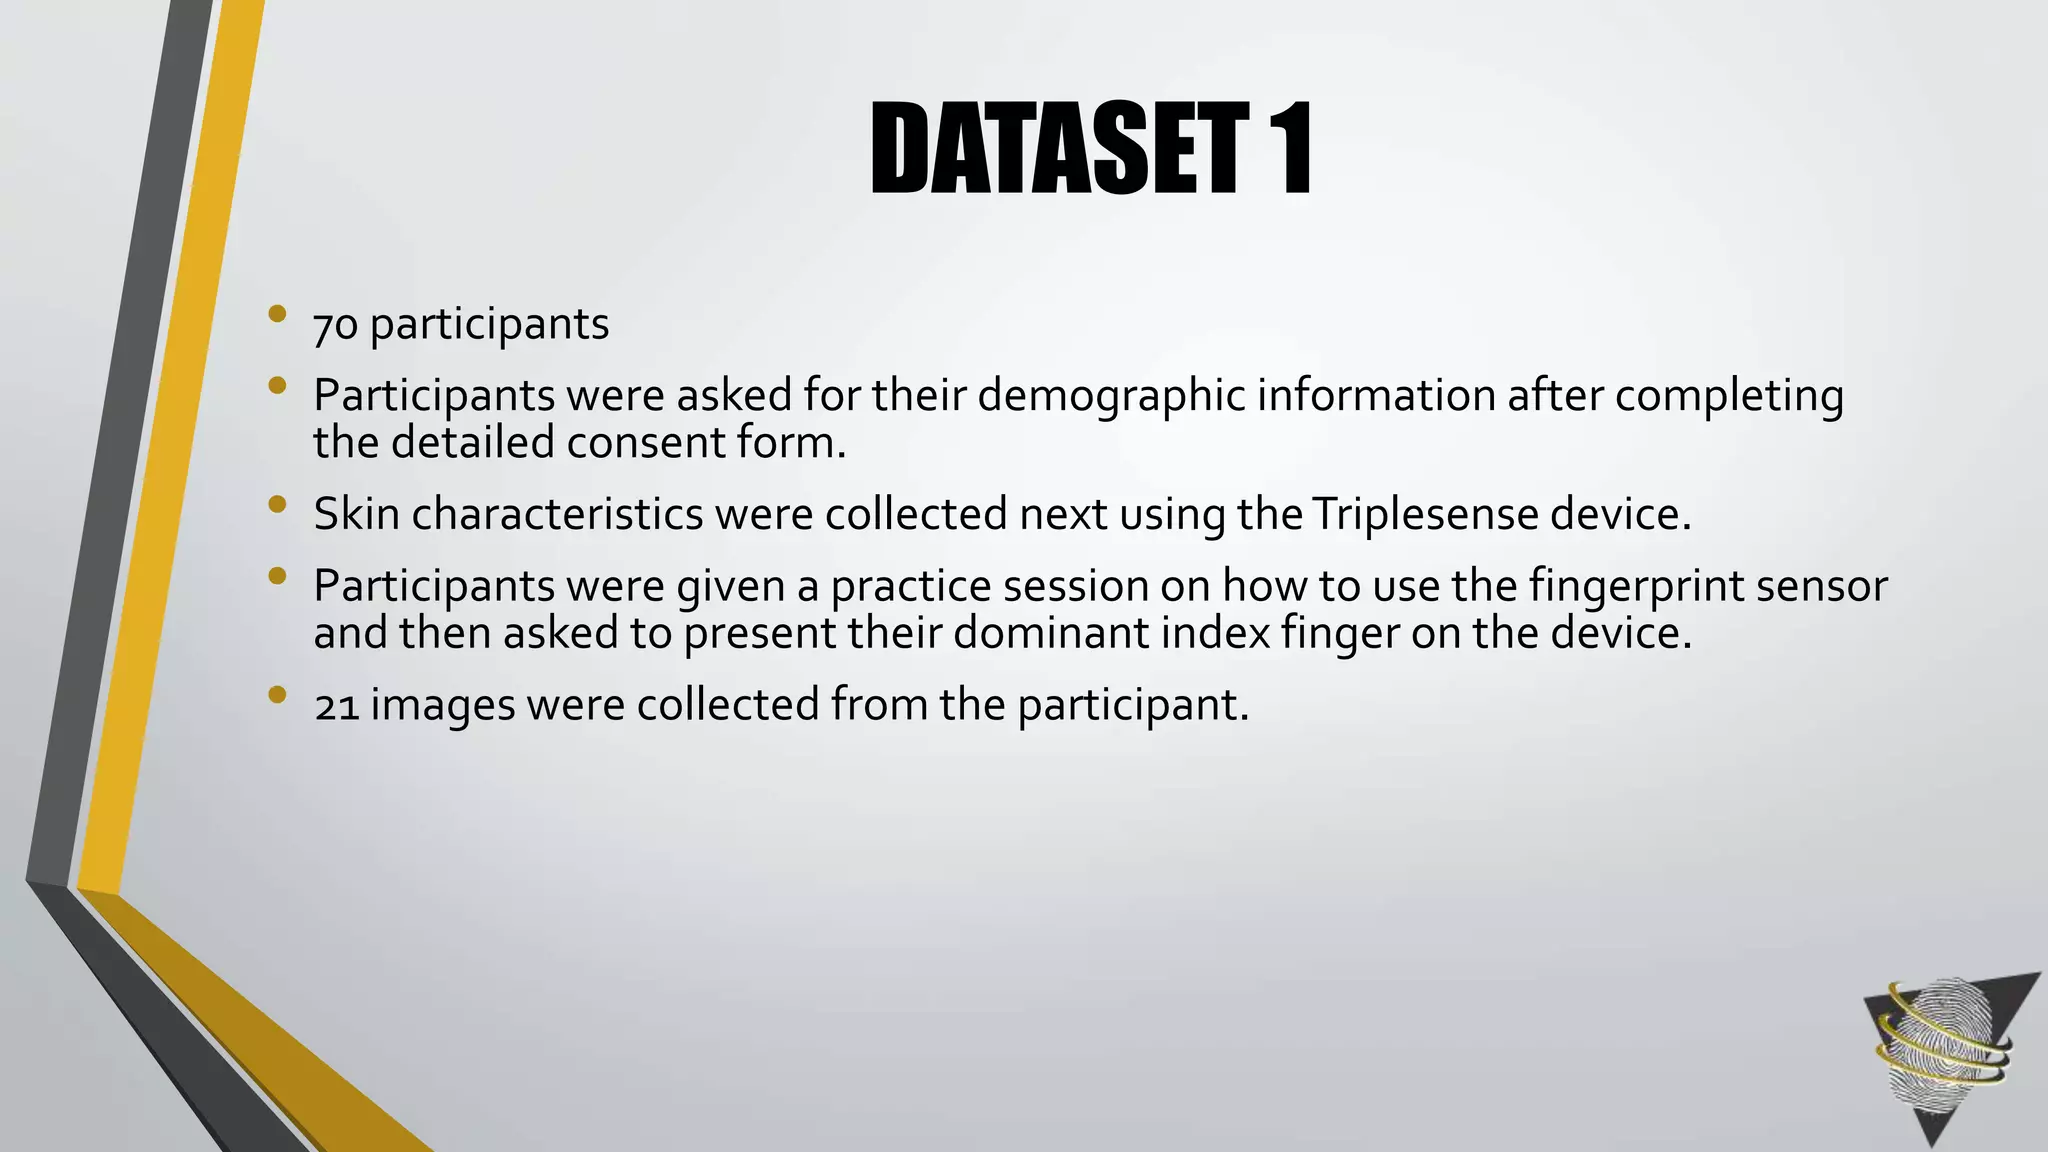
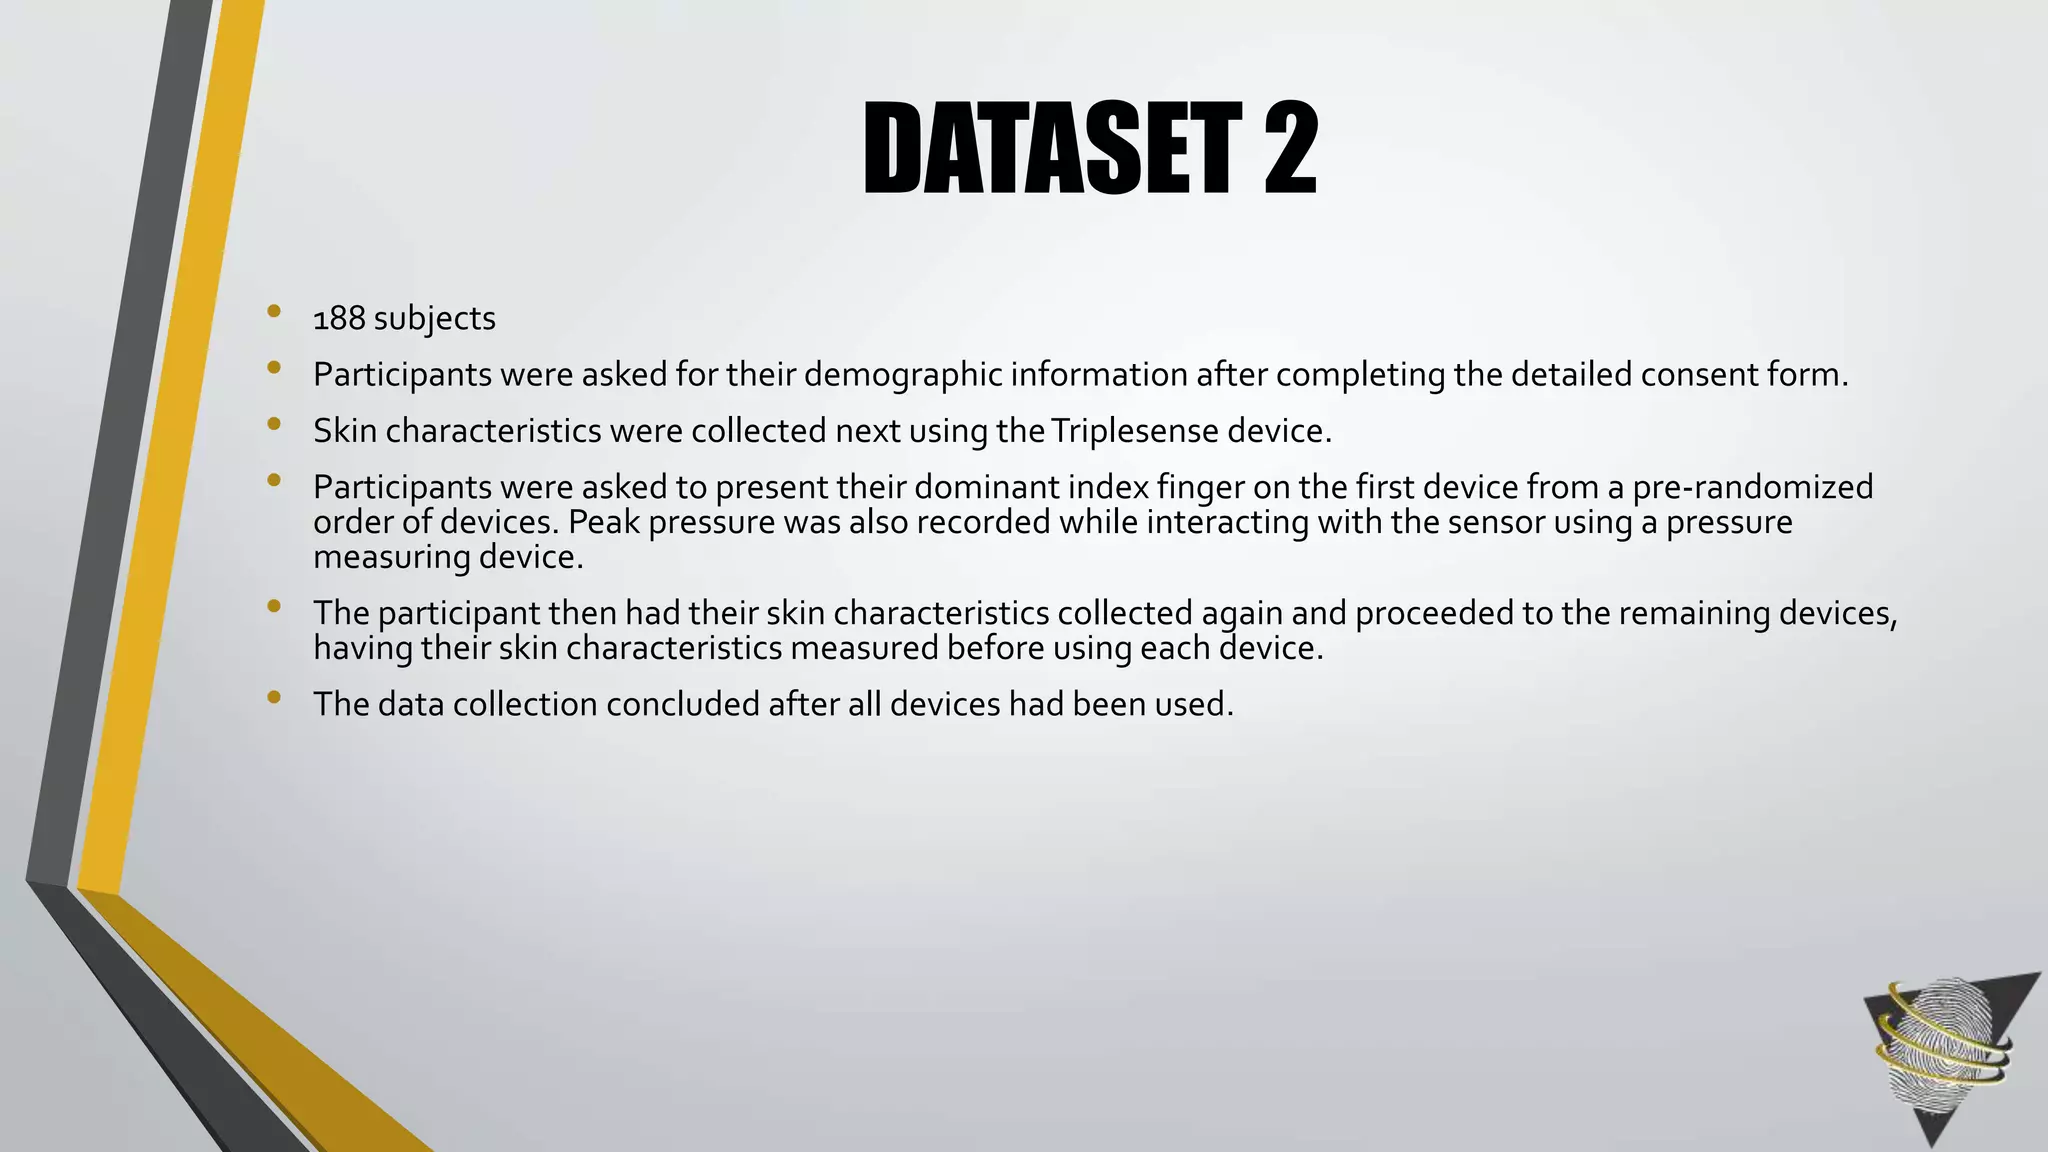
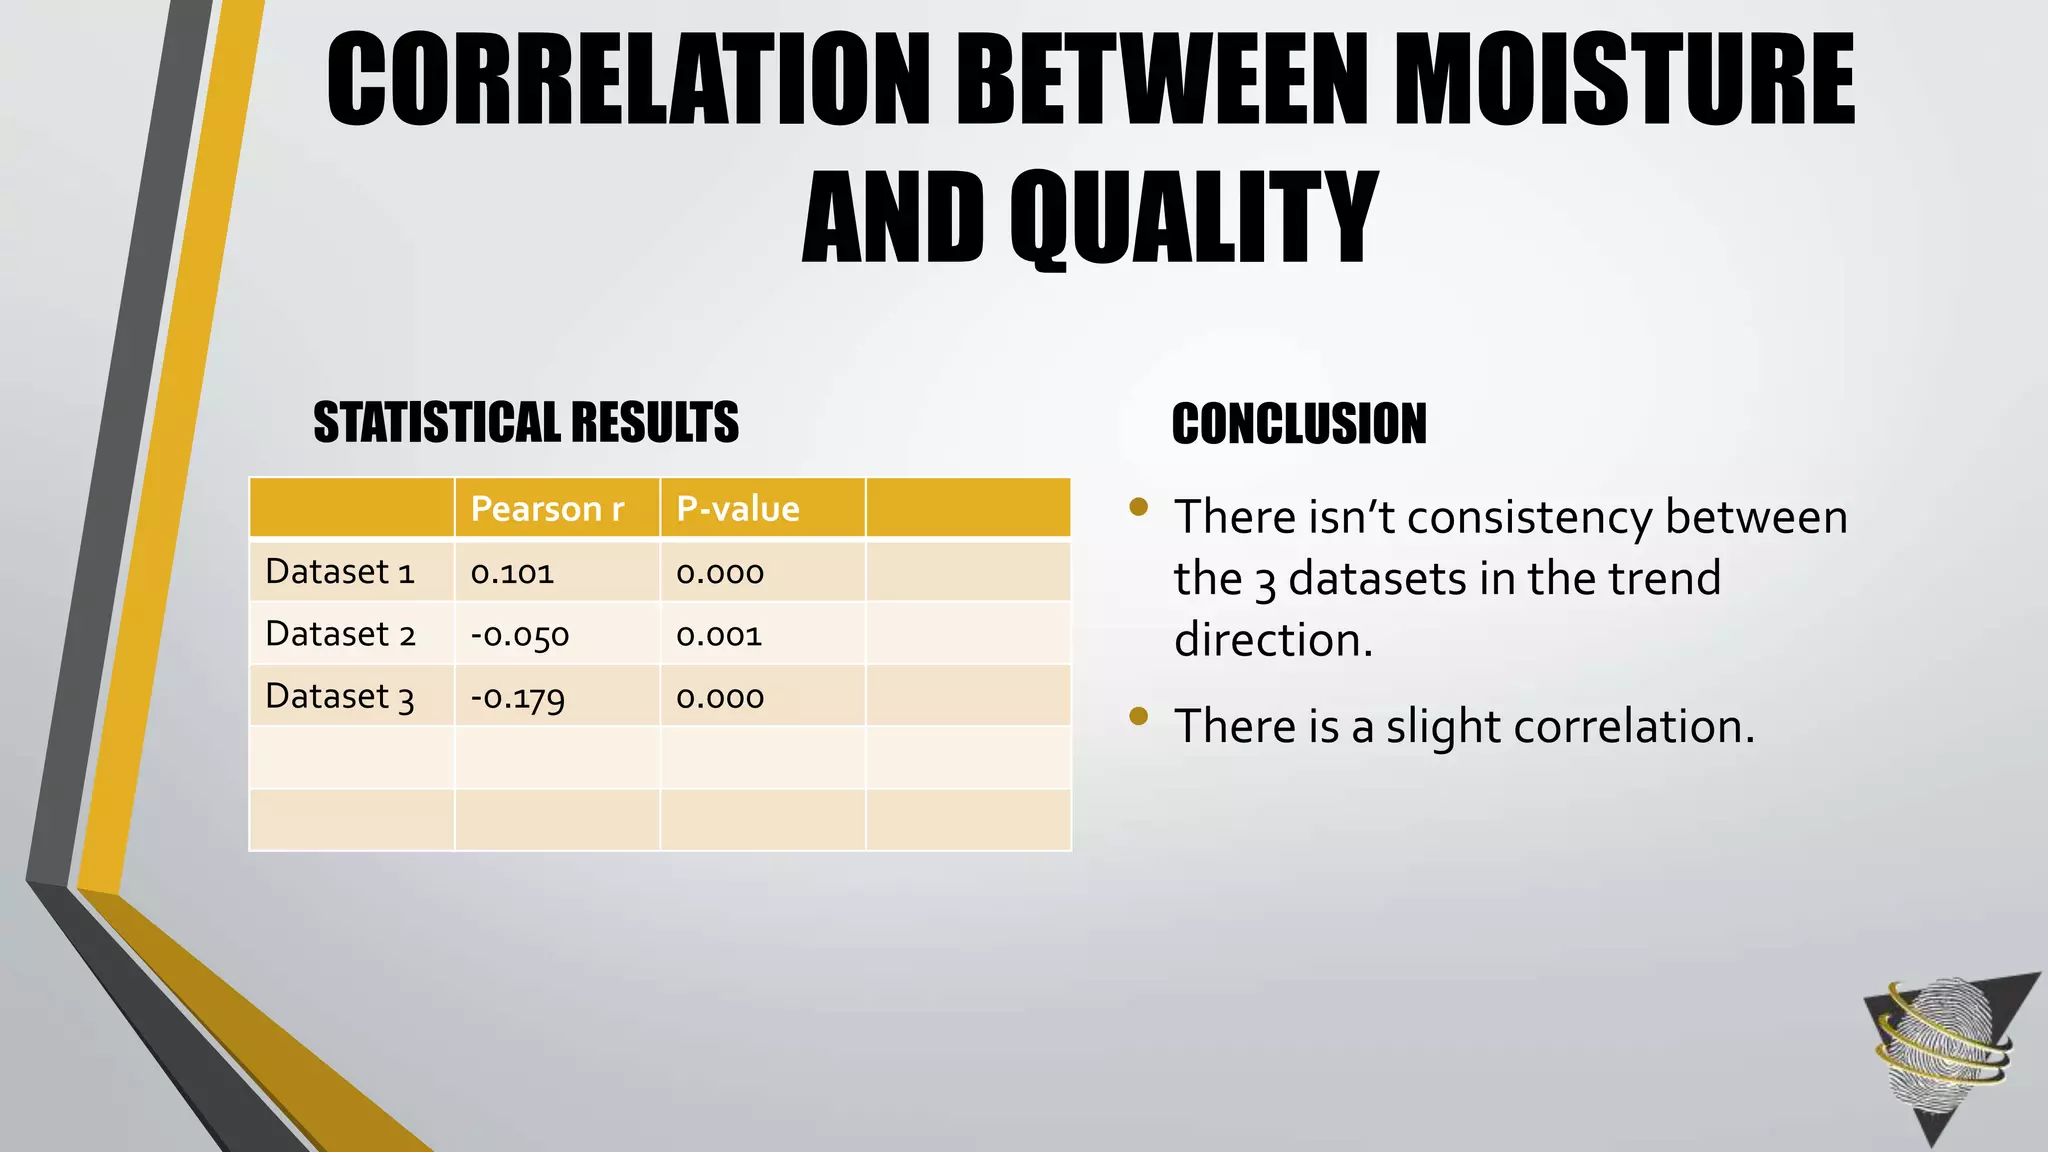
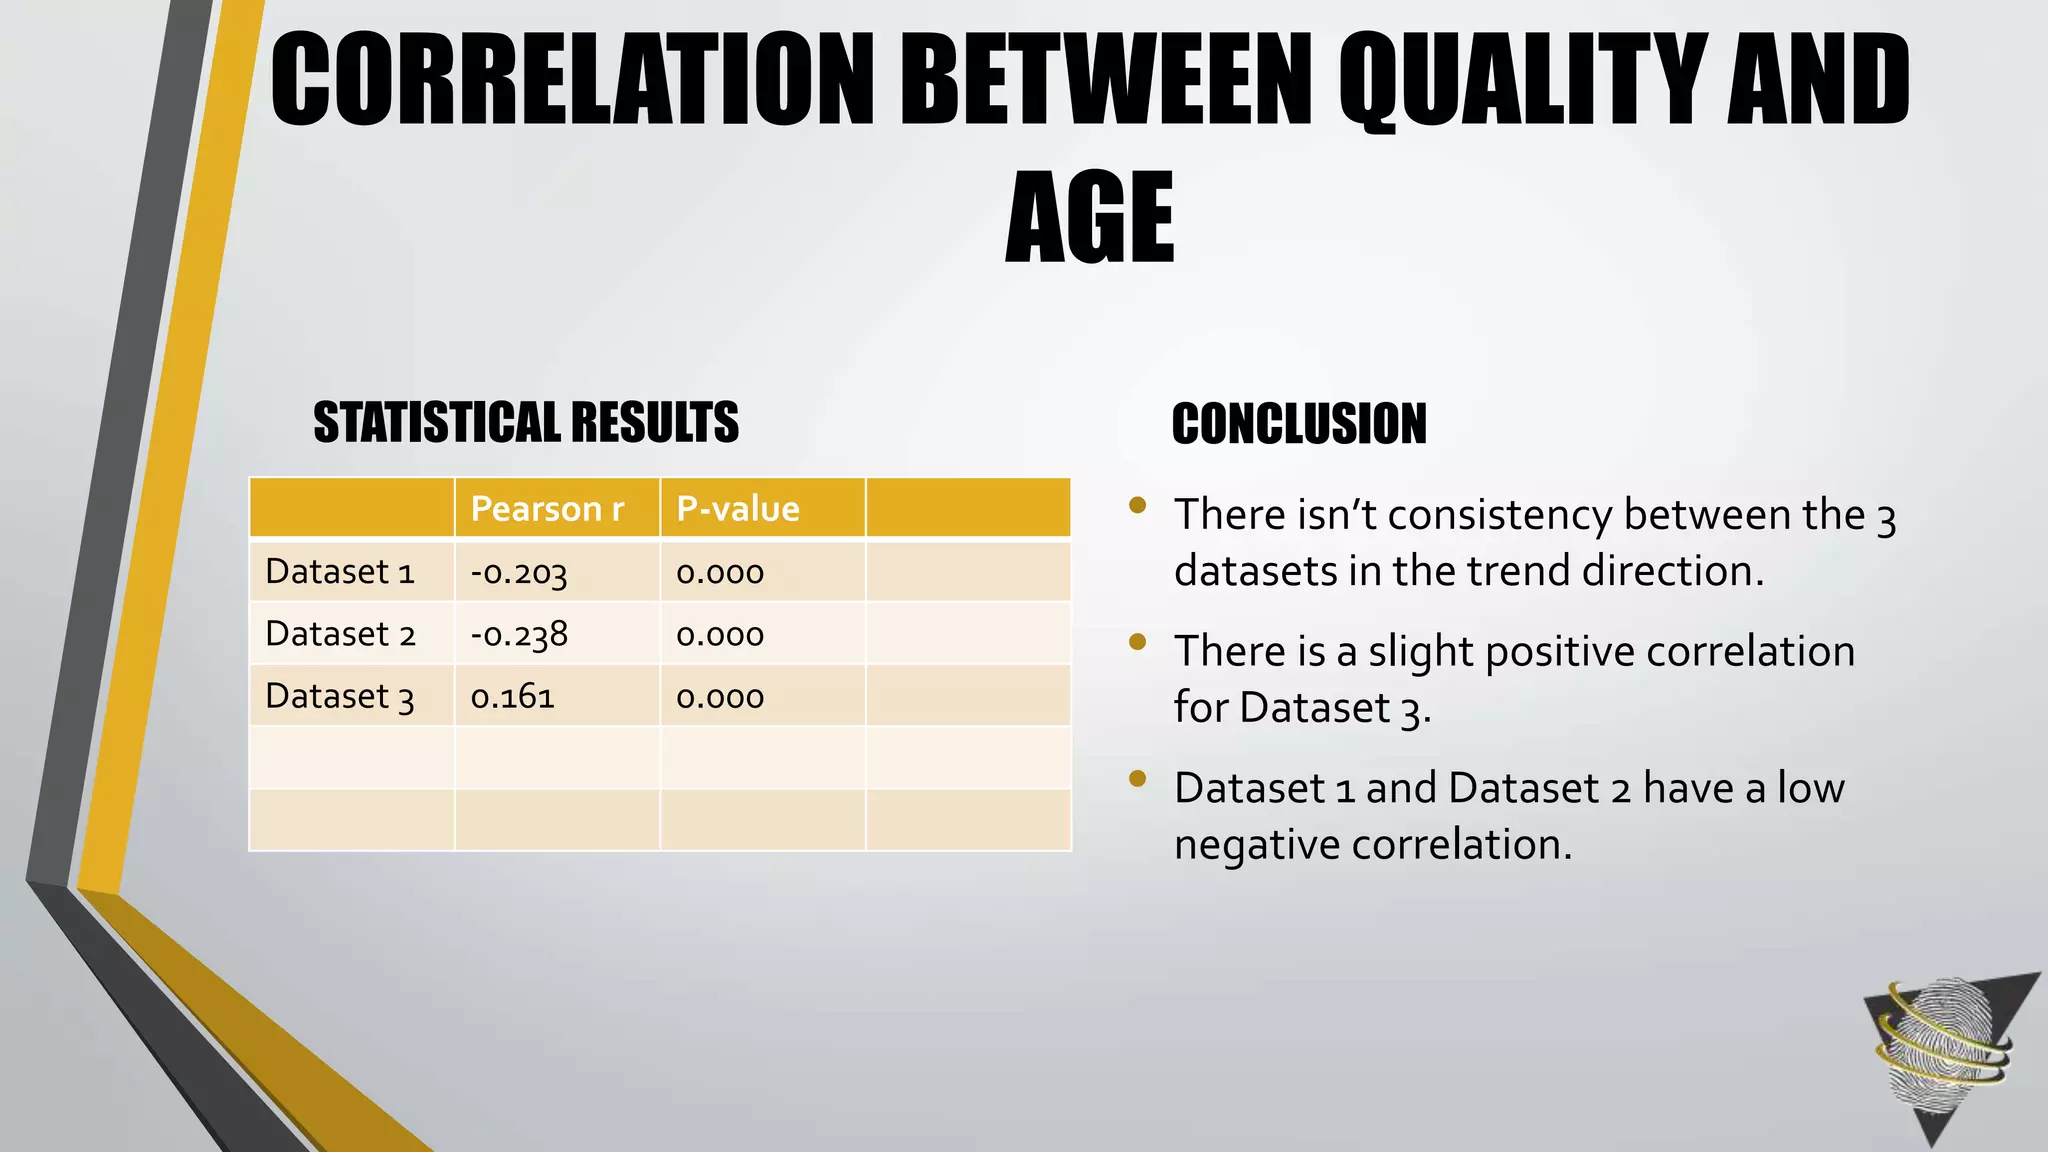
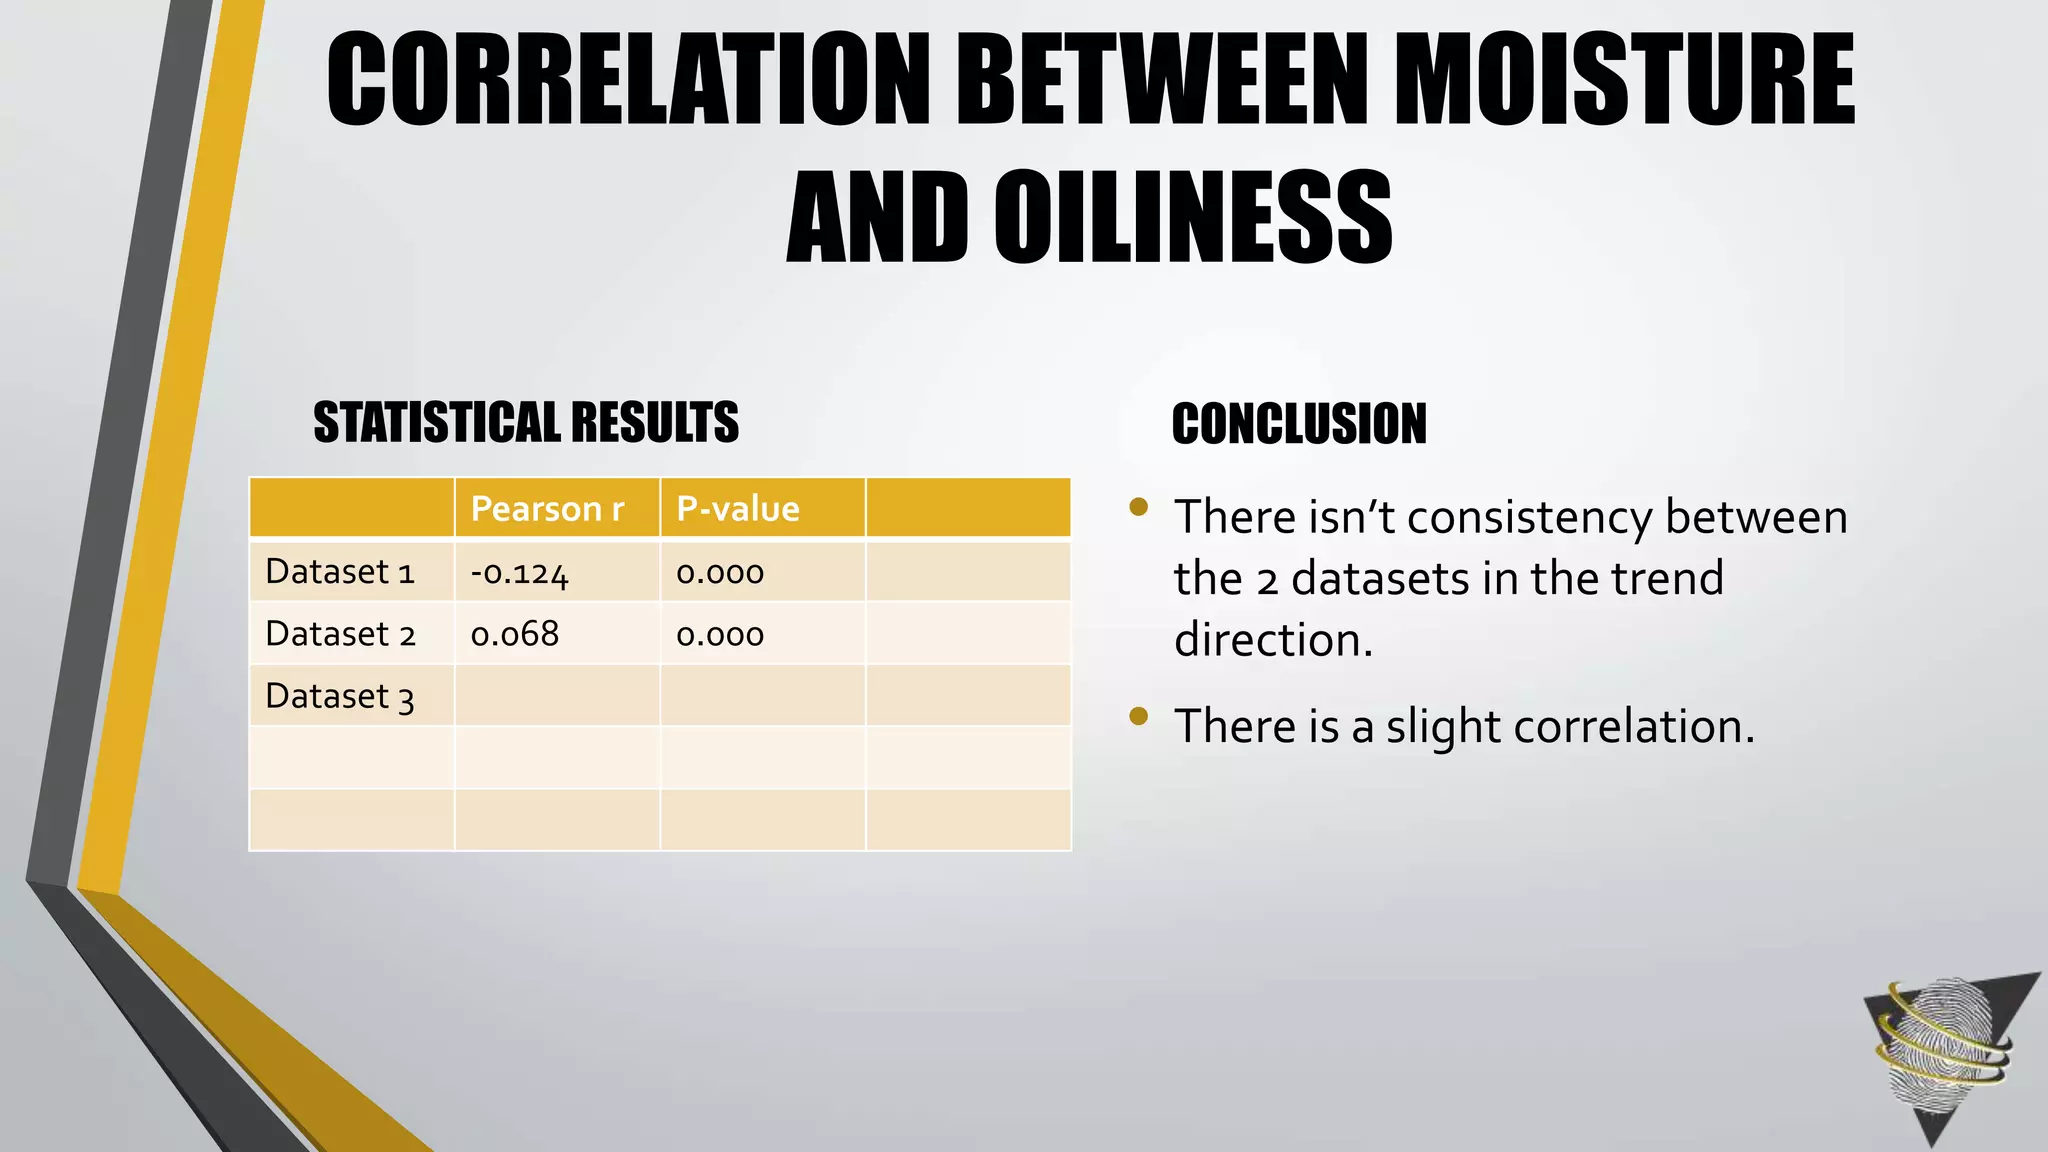
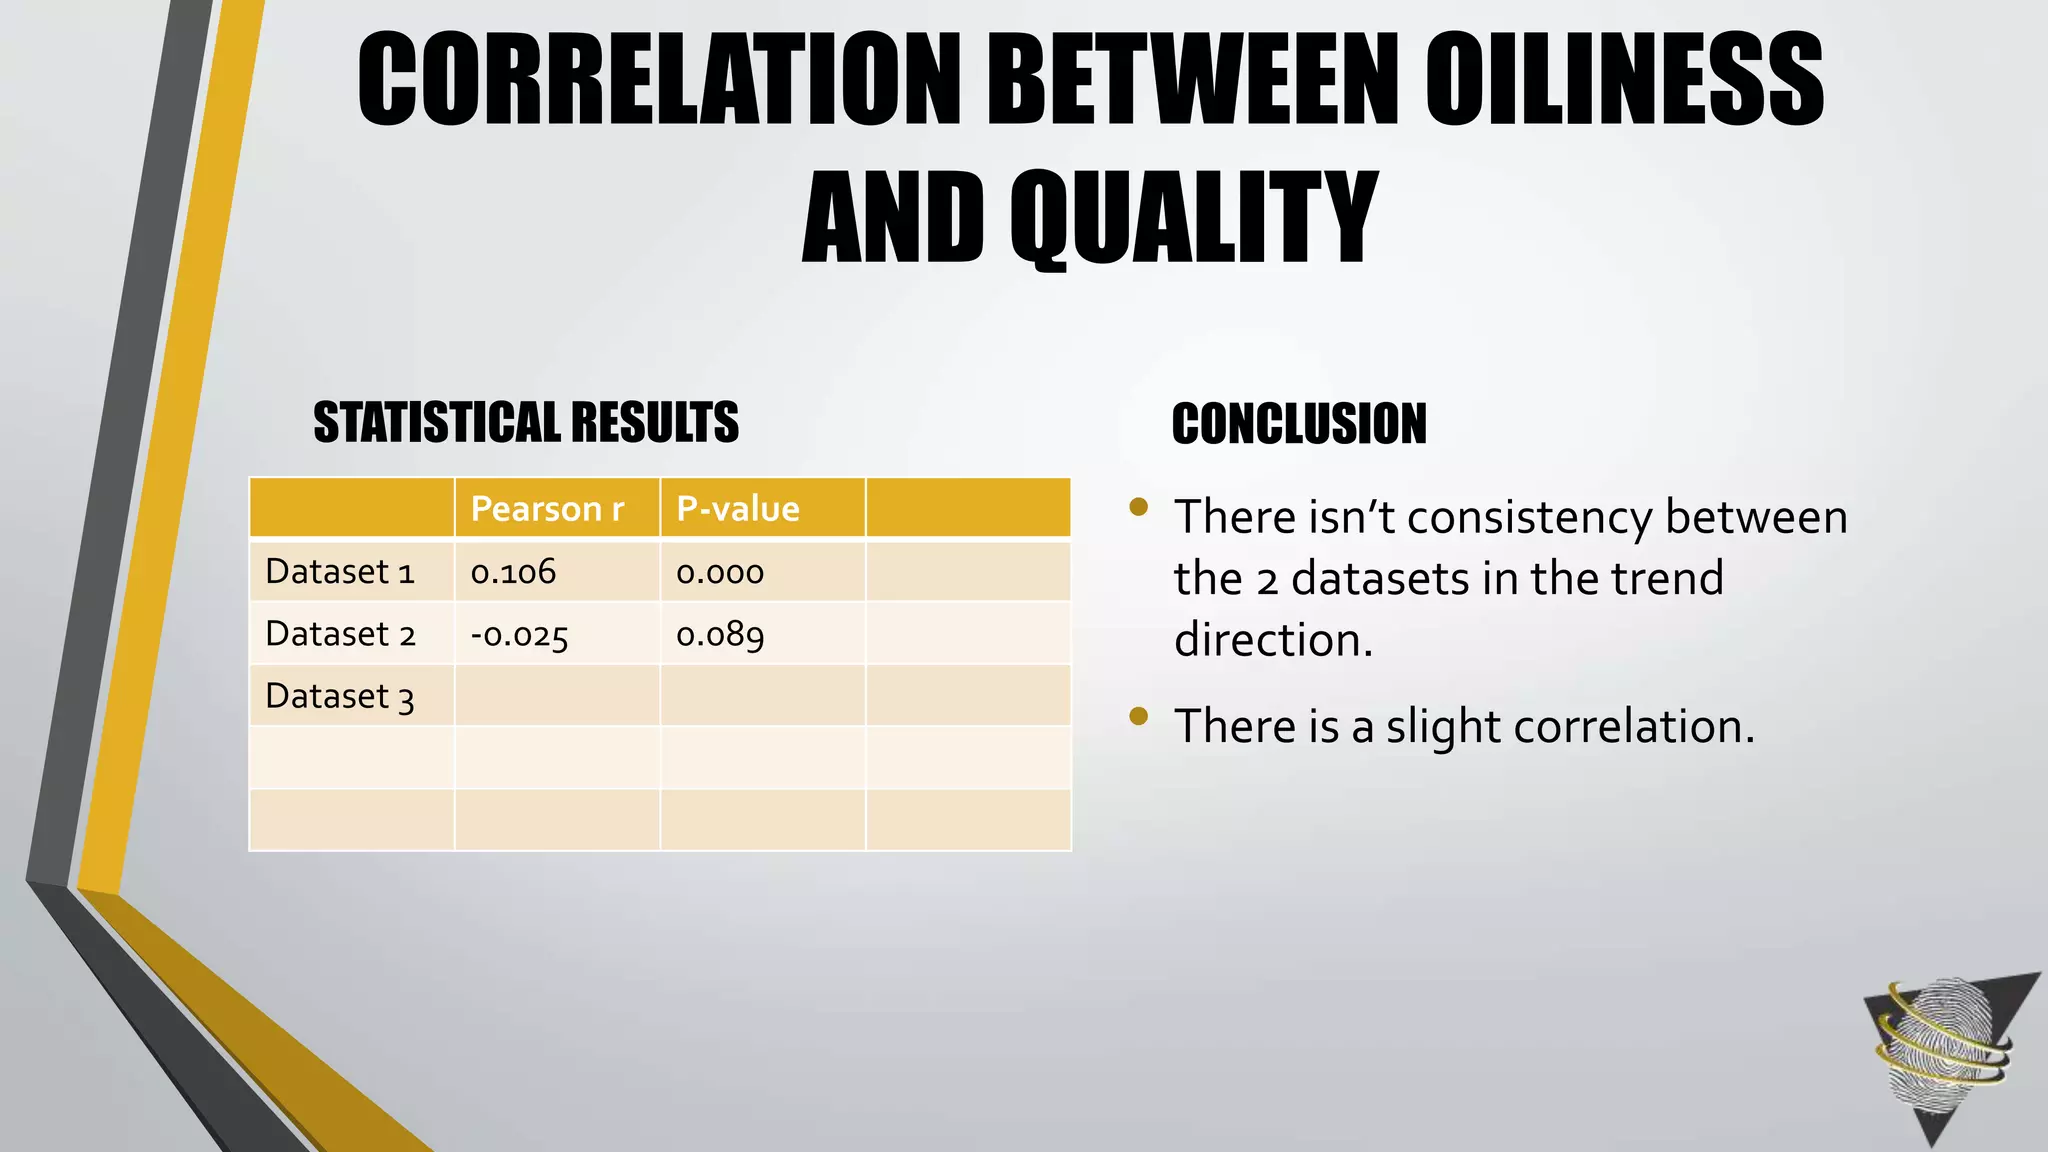
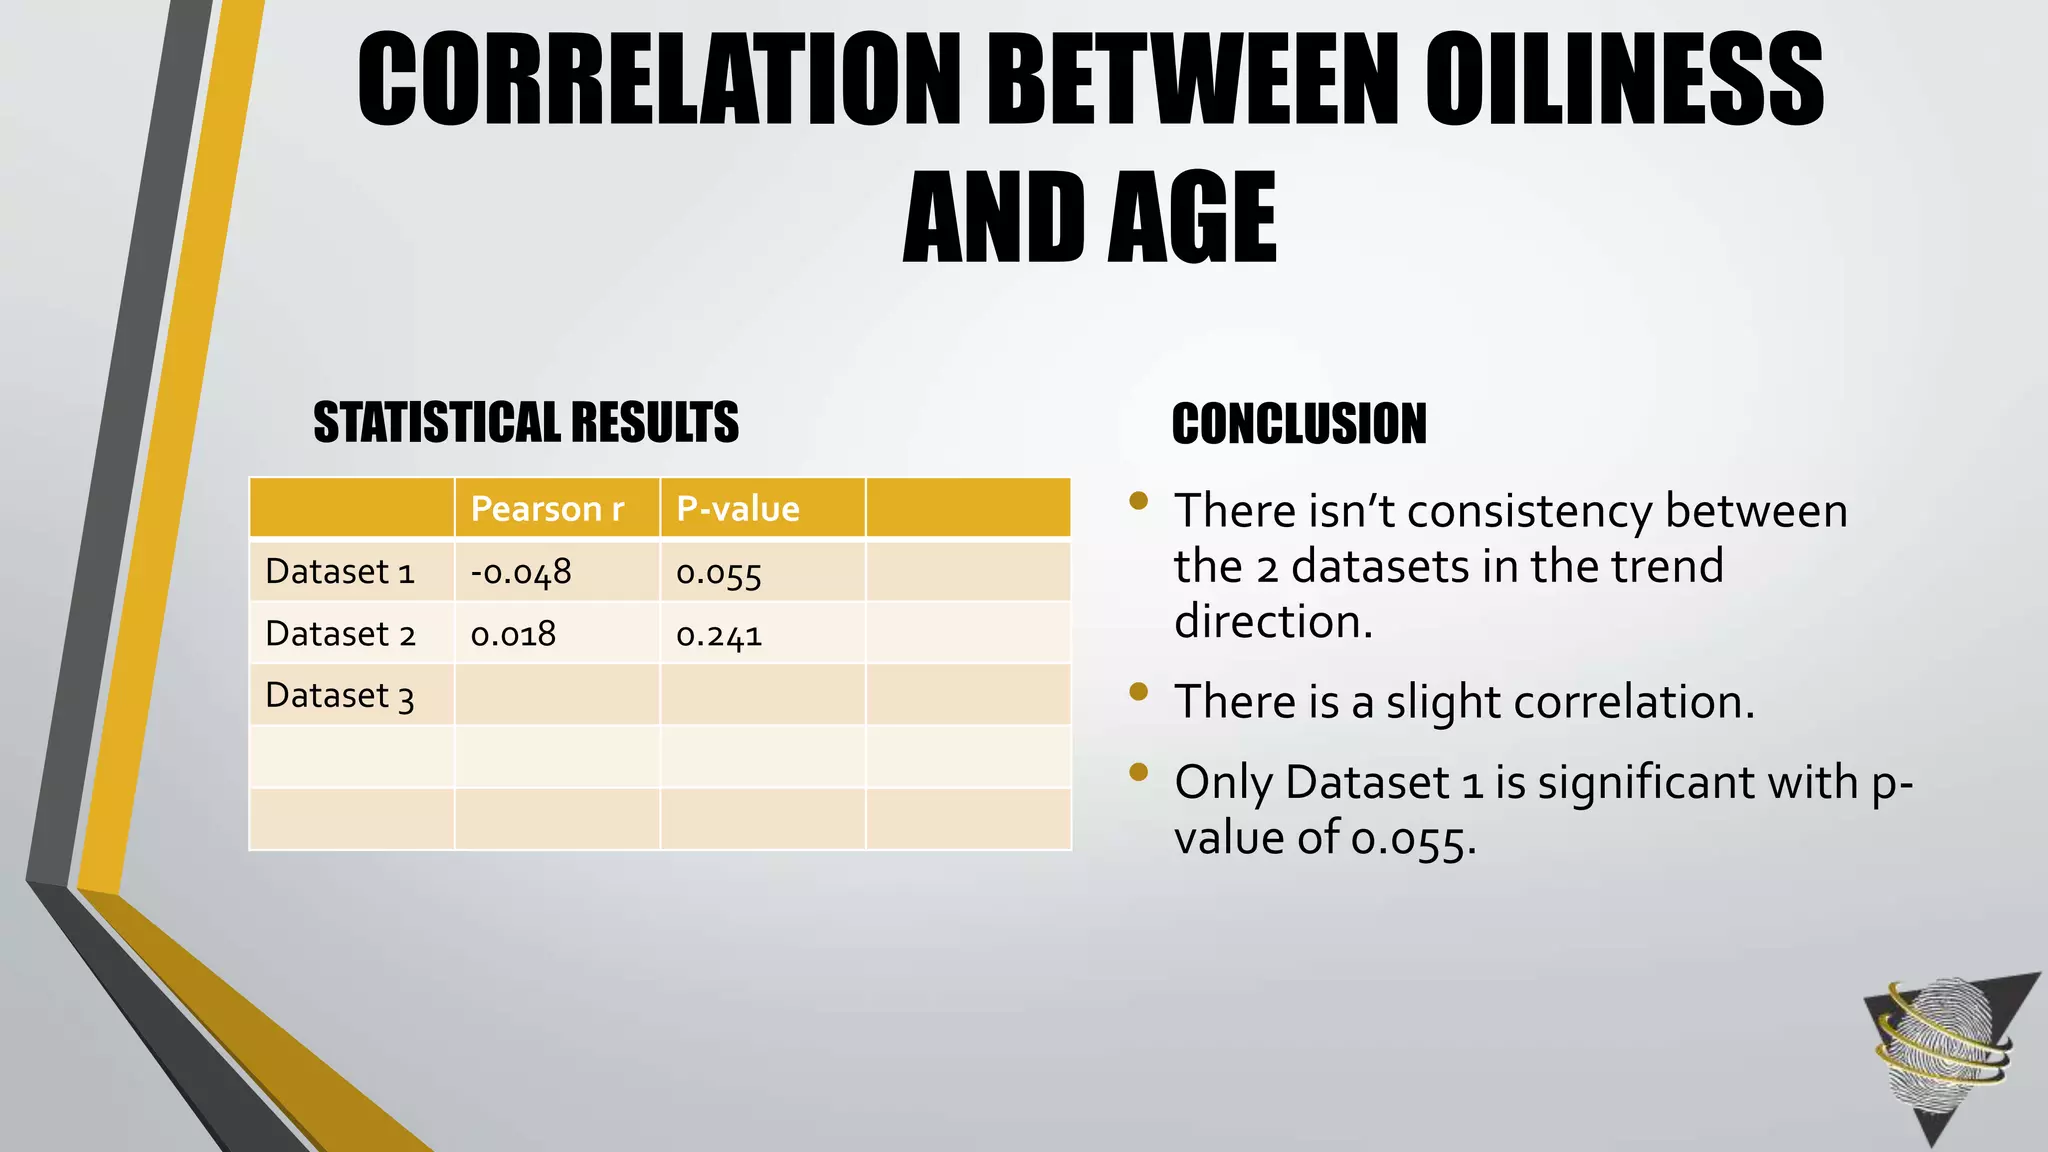
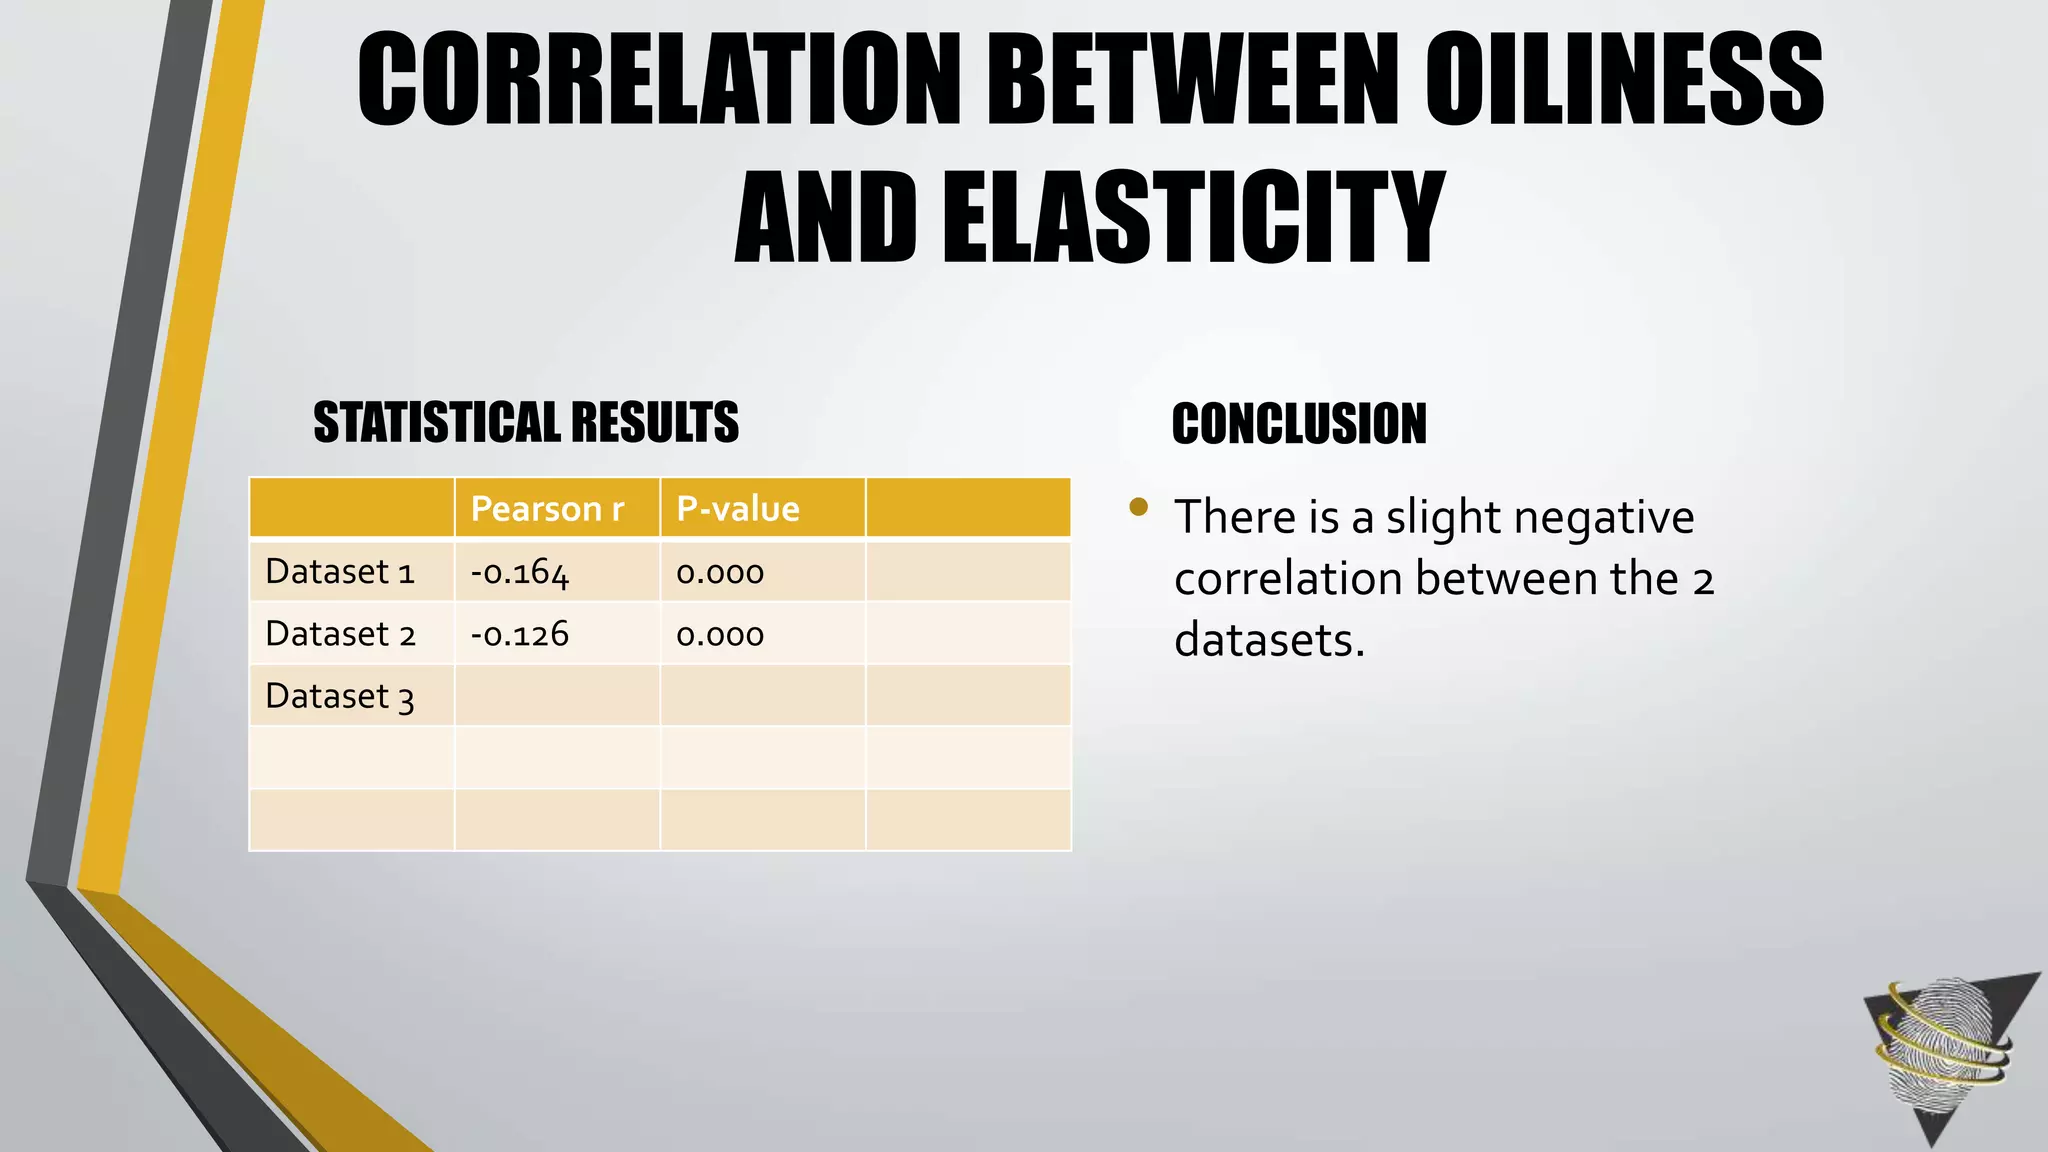
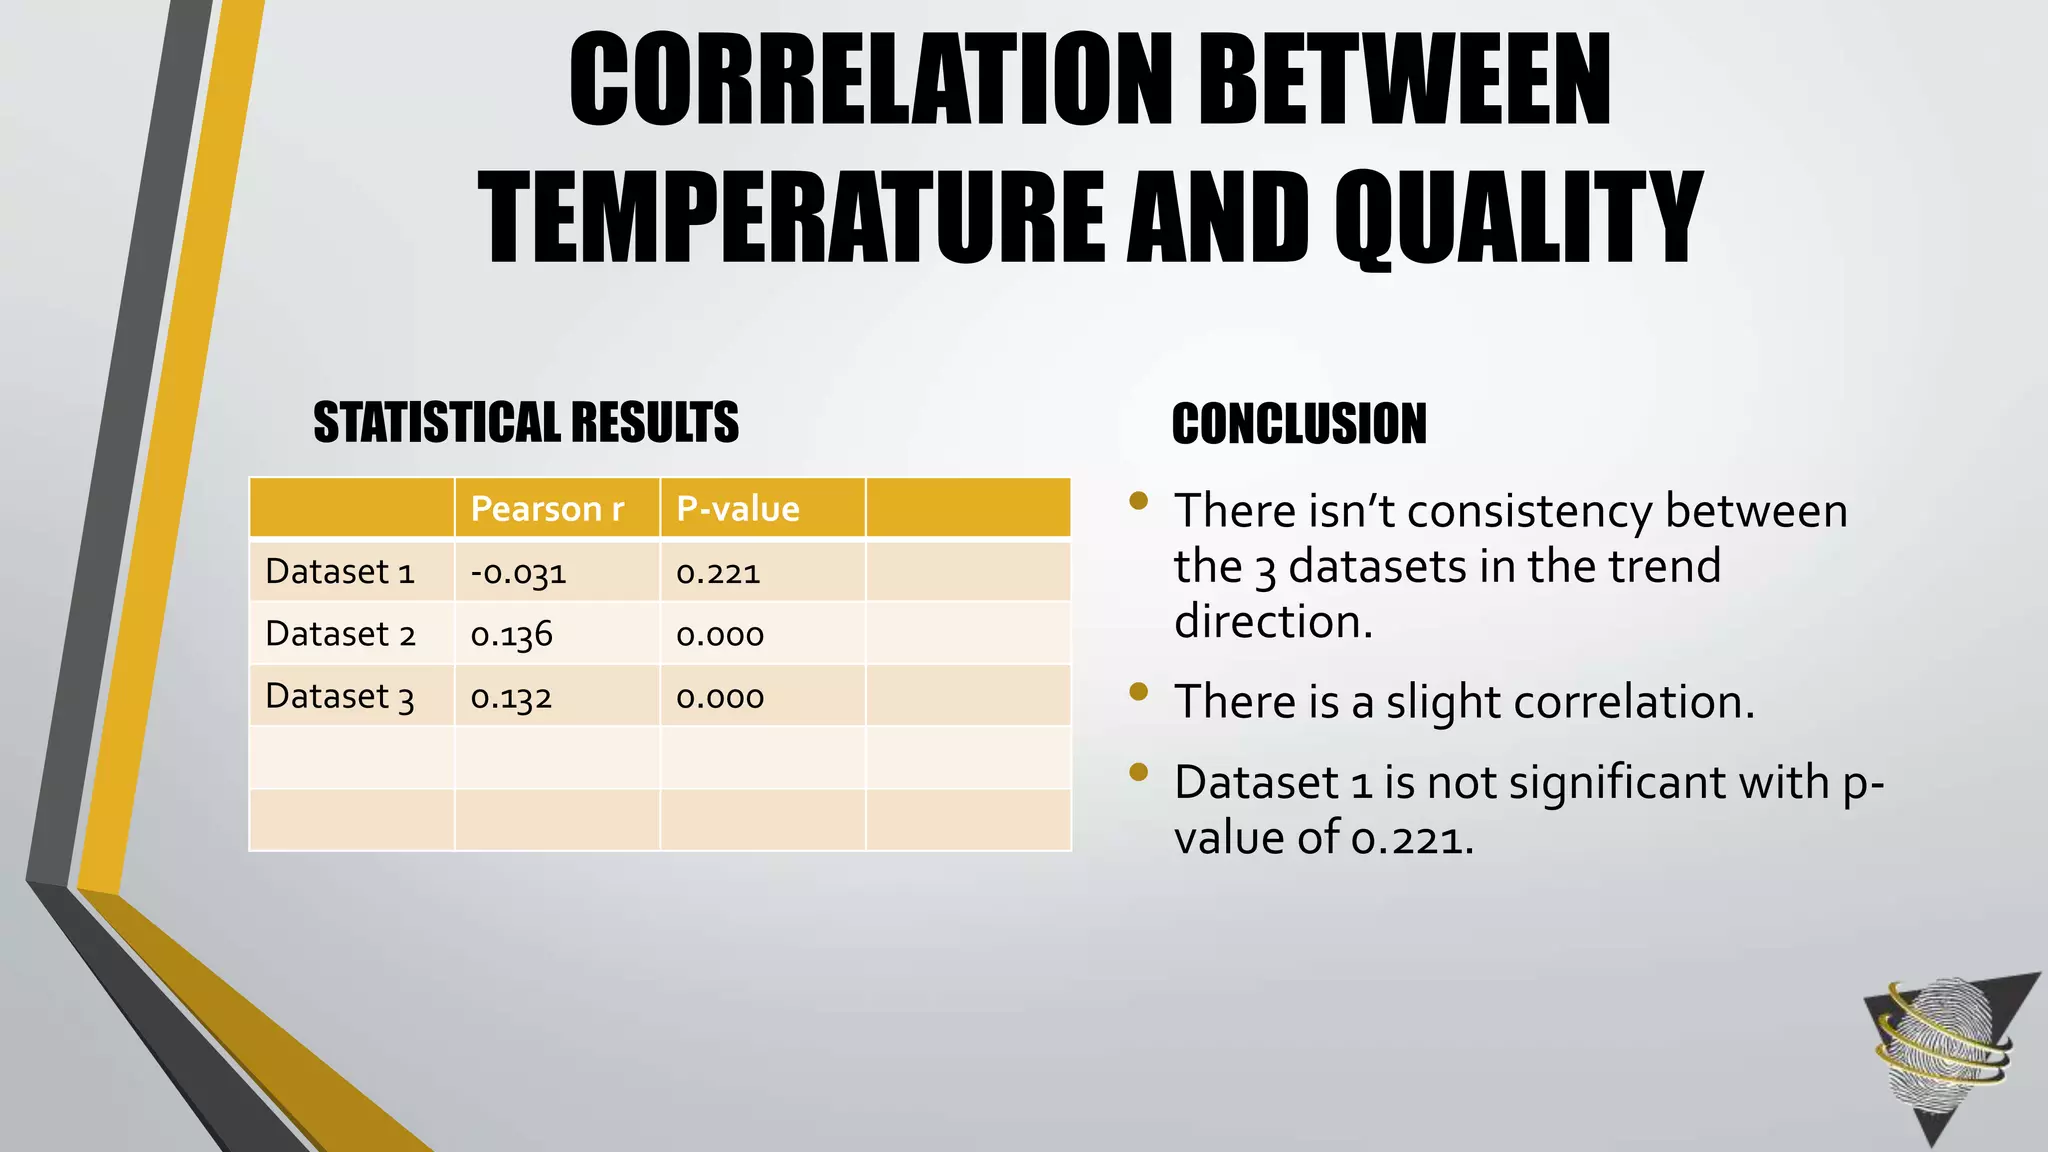
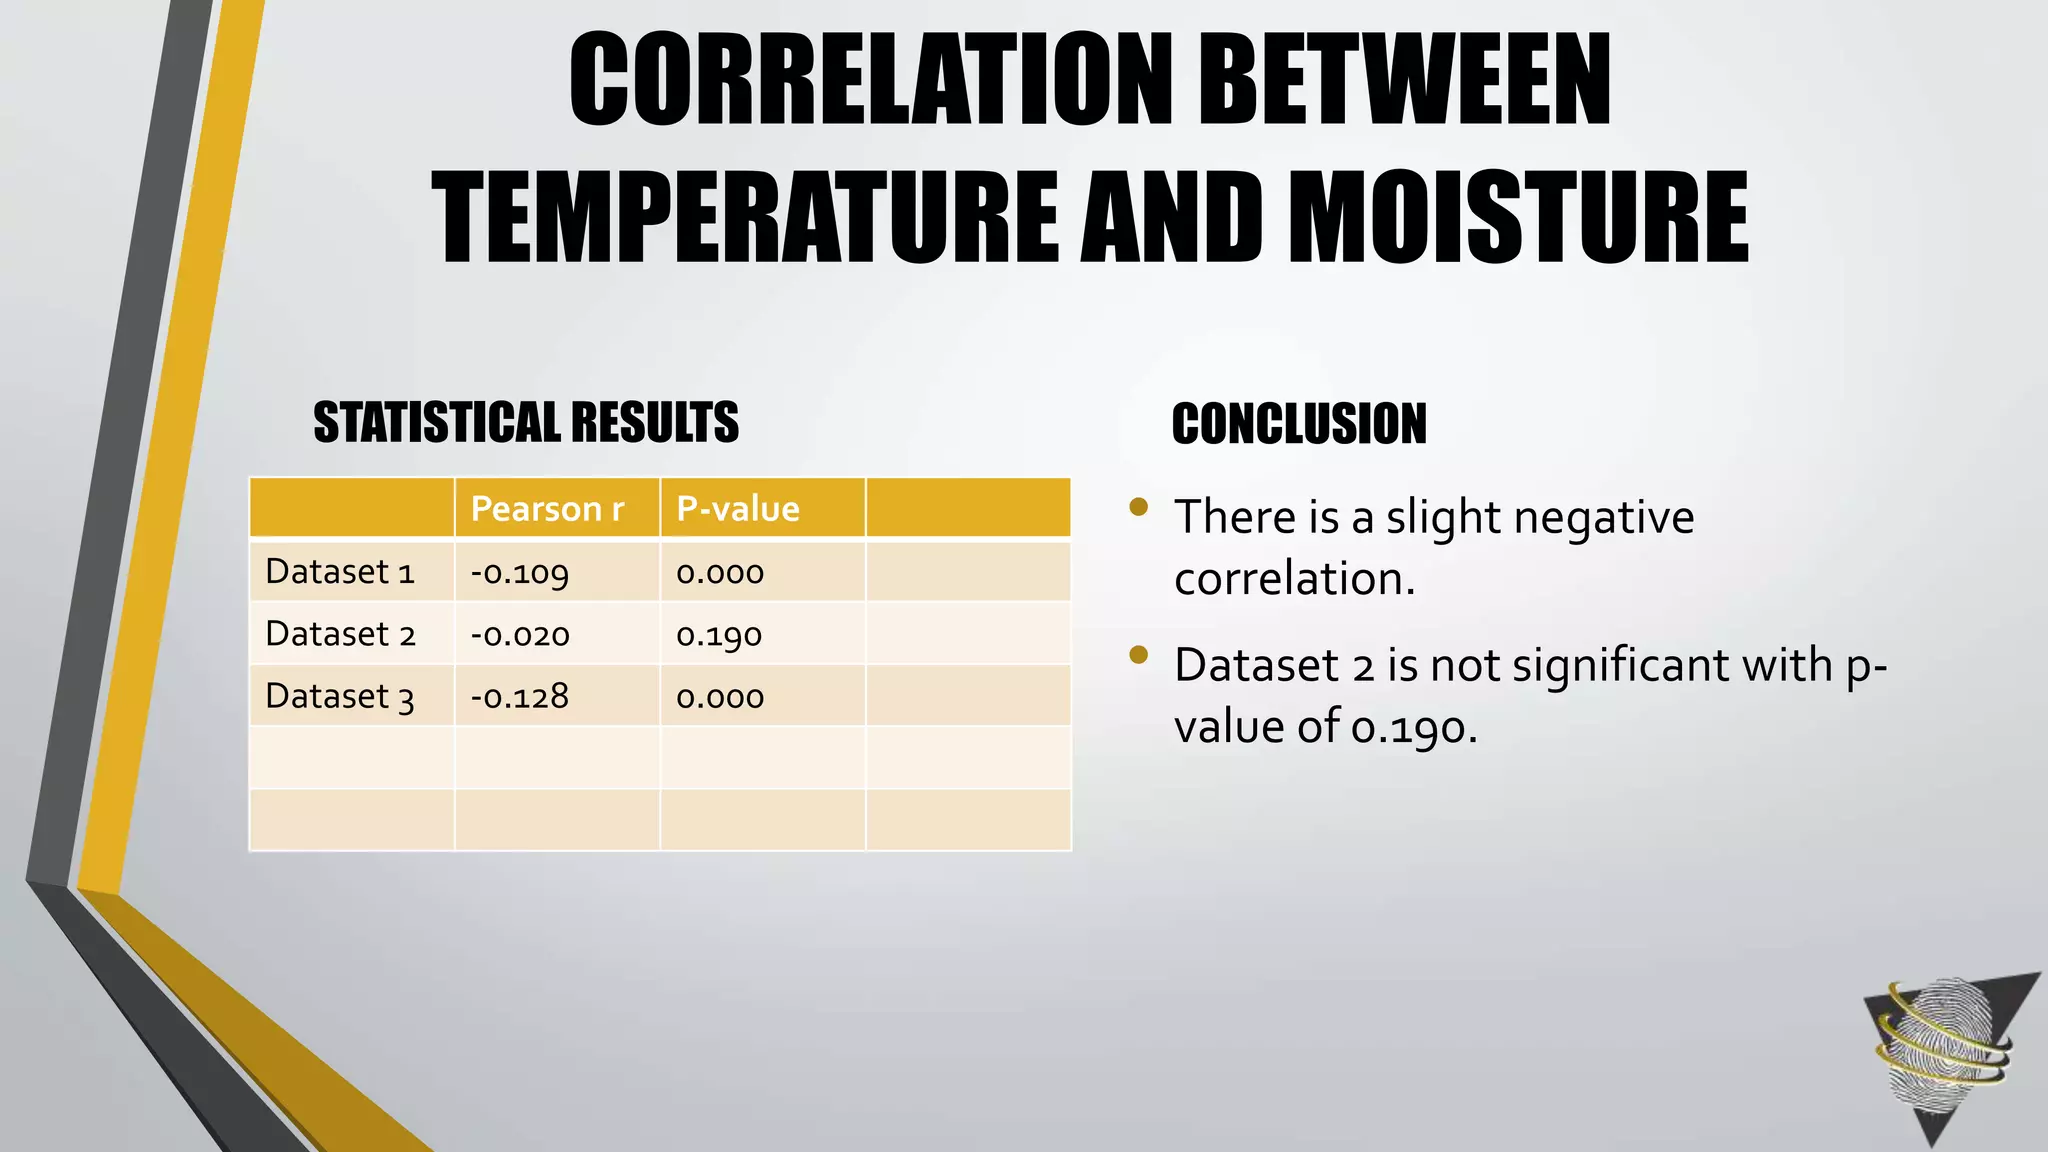
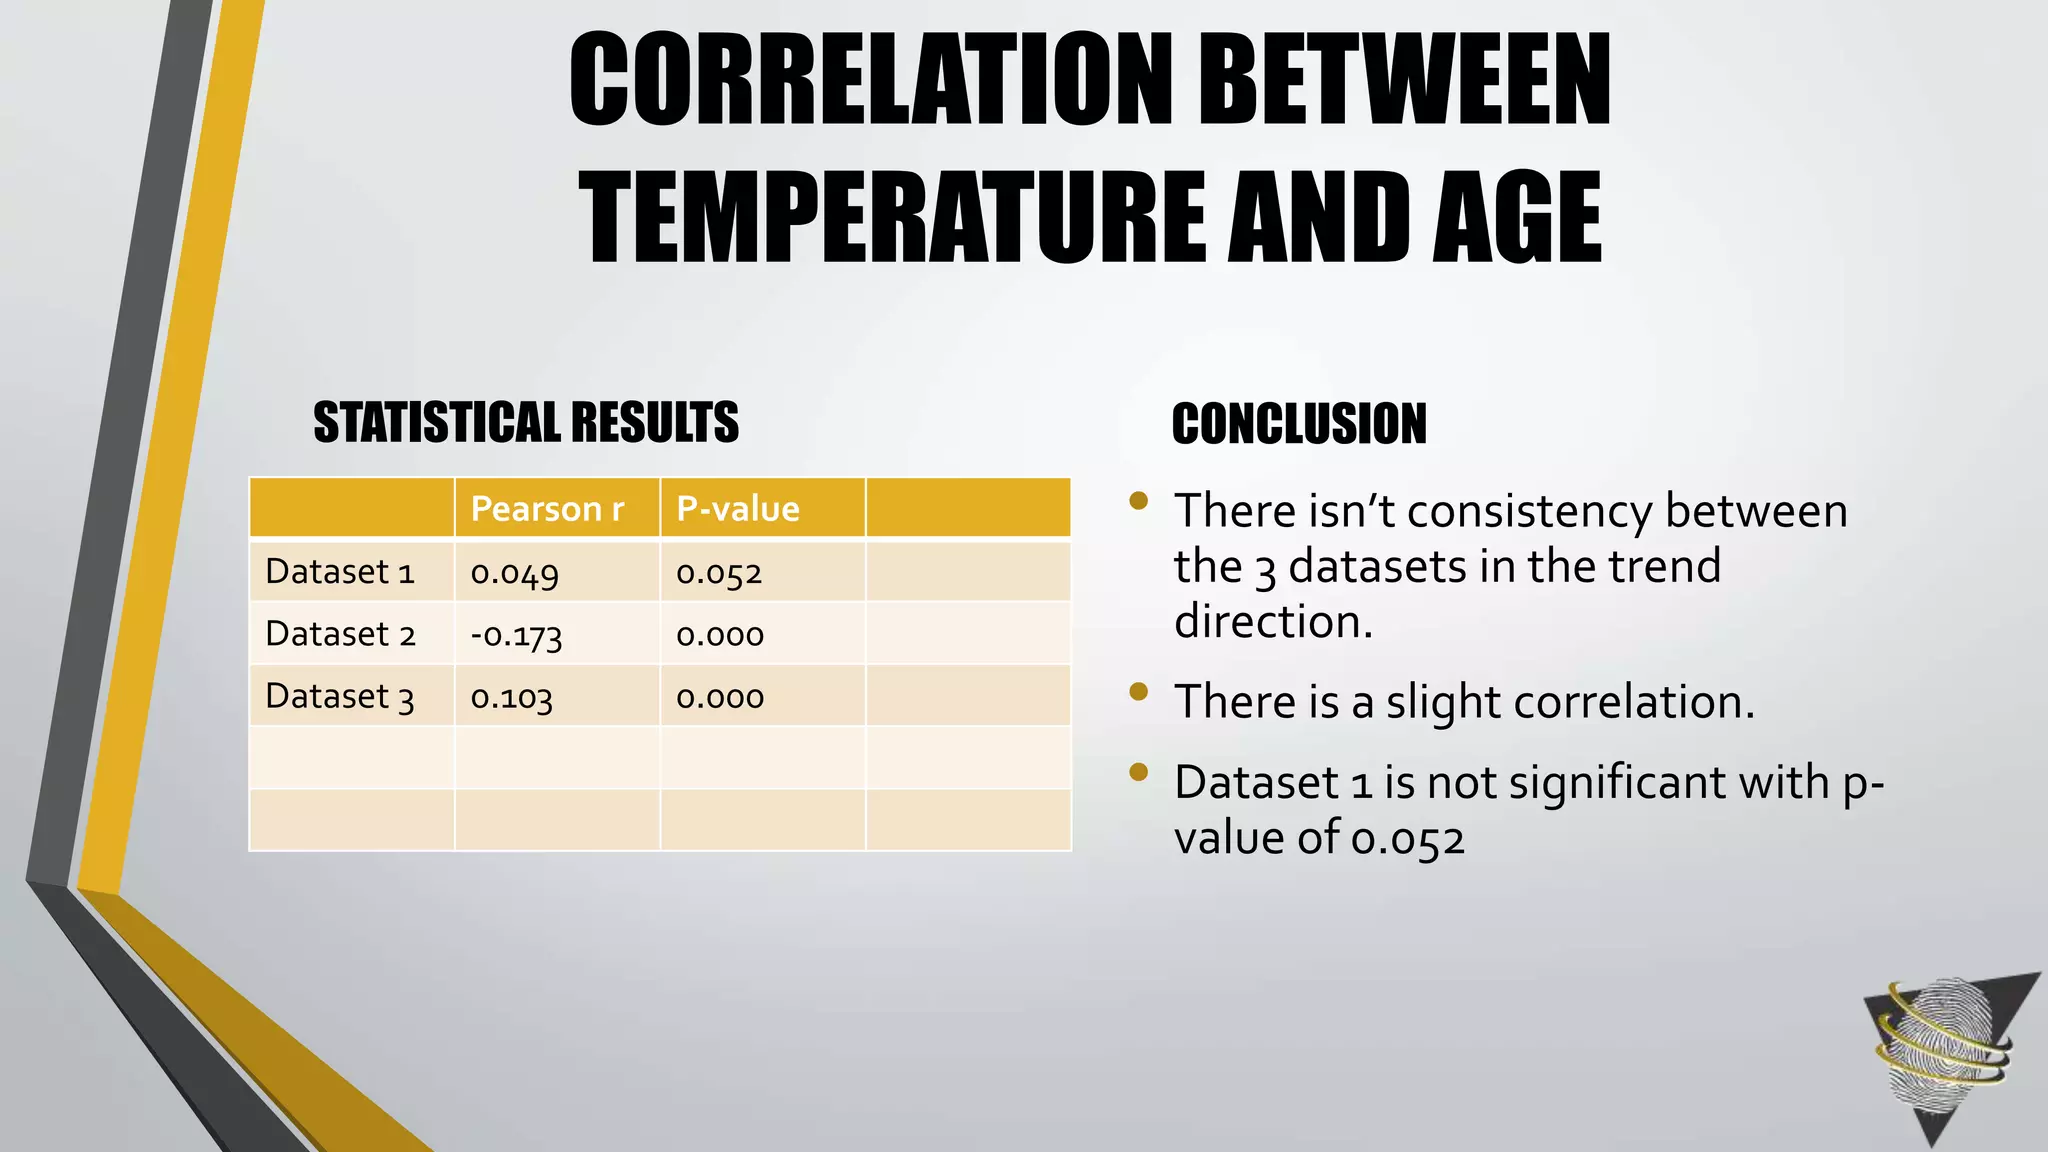
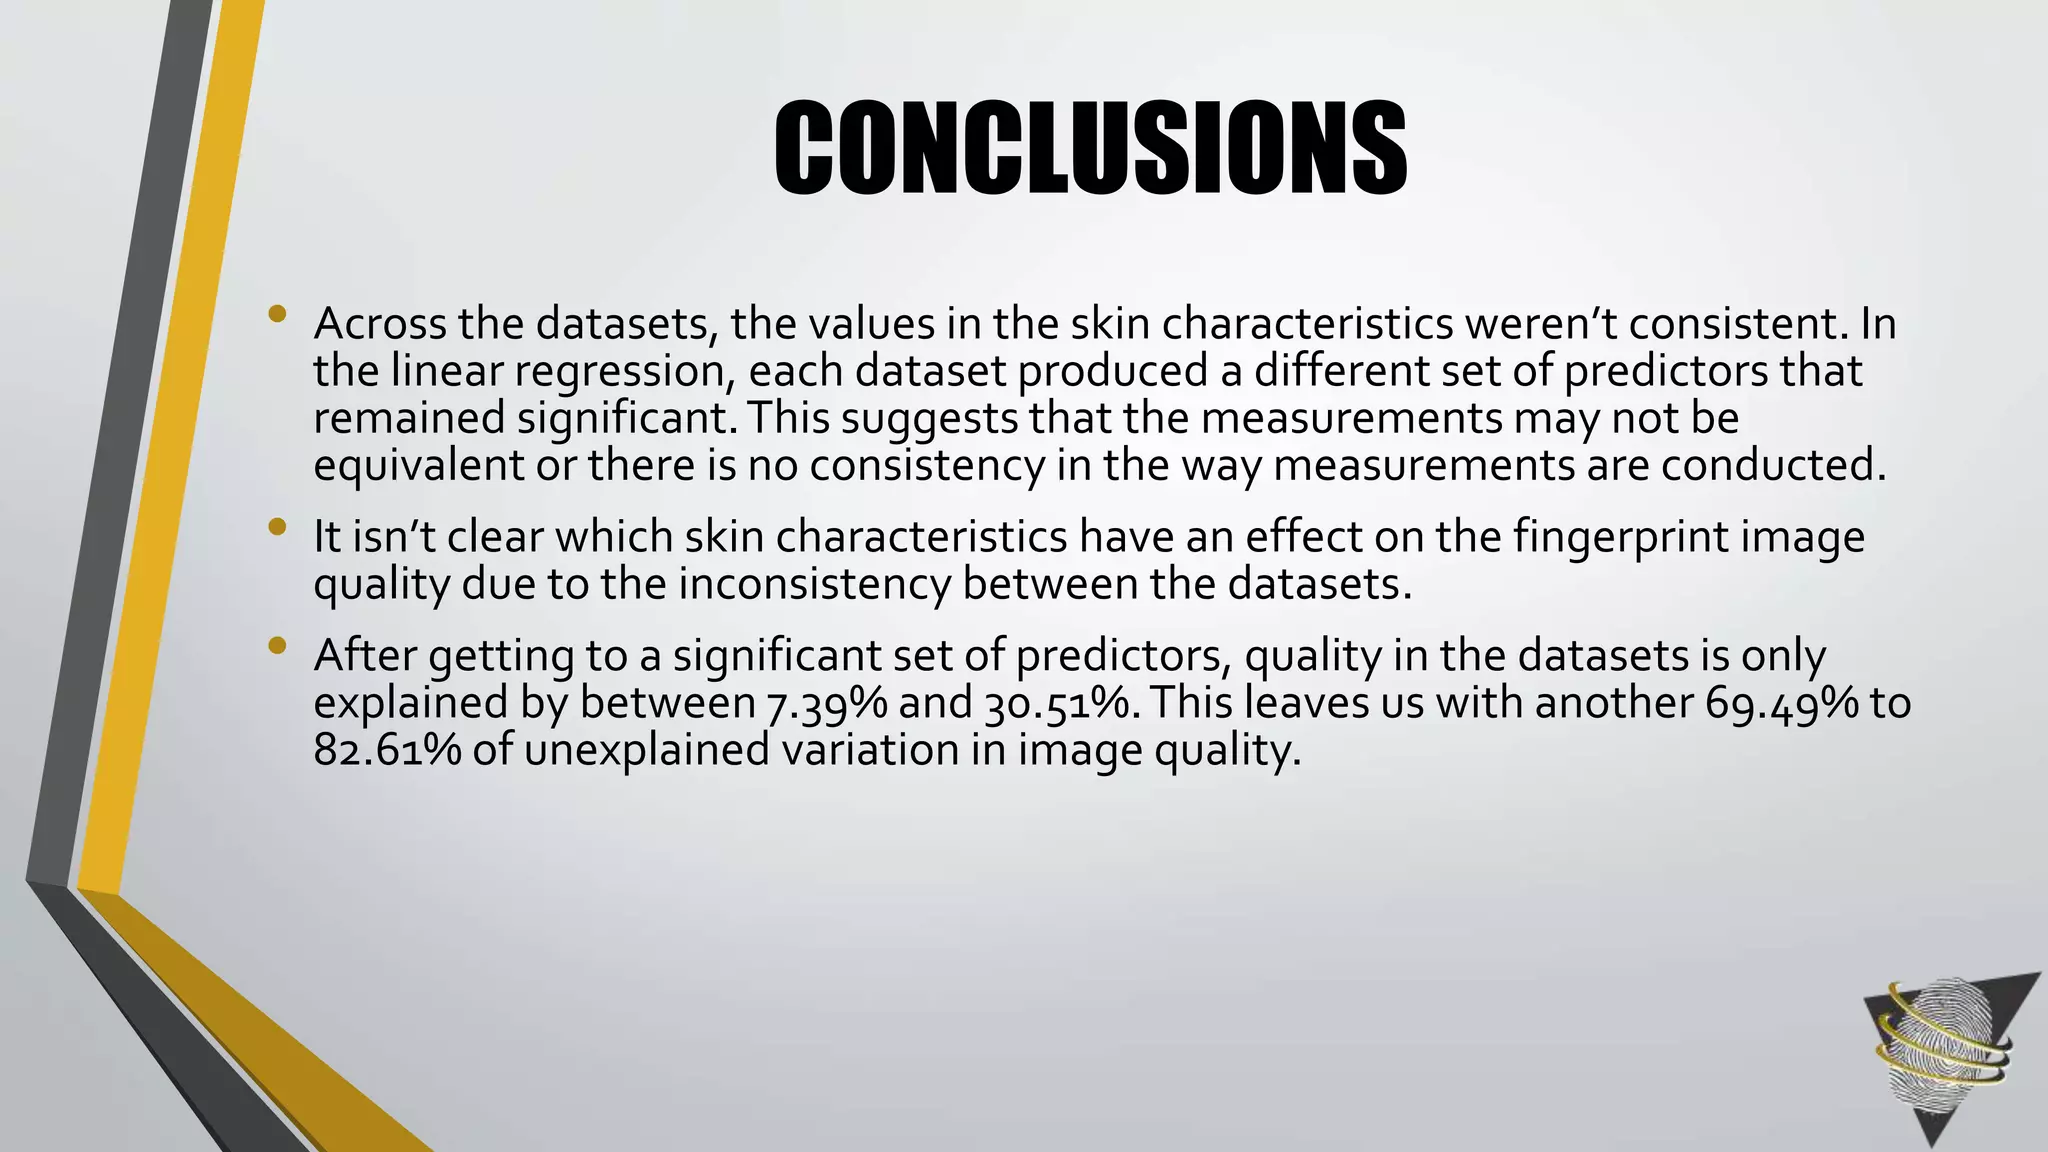
This document summarizes research examining the relationship between fingerprint skin characteristics (moisture, oiliness, elasticity, temperature) and image quality. Three datasets were collected from participants using different fingerprint sensors and skin analysis devices. Correlation analyses were conducted to determine relationships between the skin characteristics and image quality, as well as between characteristics. Preliminary results found slight correlations between some characteristics and quality, but inconsistencies between datasets. The research aims to determine if collecting skin data improves image quality.


![MDD Project Report By Dharmendra singh [Srm University] Ncr Delhi](https://cdn.slidesharecdn.com/ss_thumbnails/finalmddfilepdf-180424131522-thumbnail.jpg?width=640&height=640&fit=bounds)


