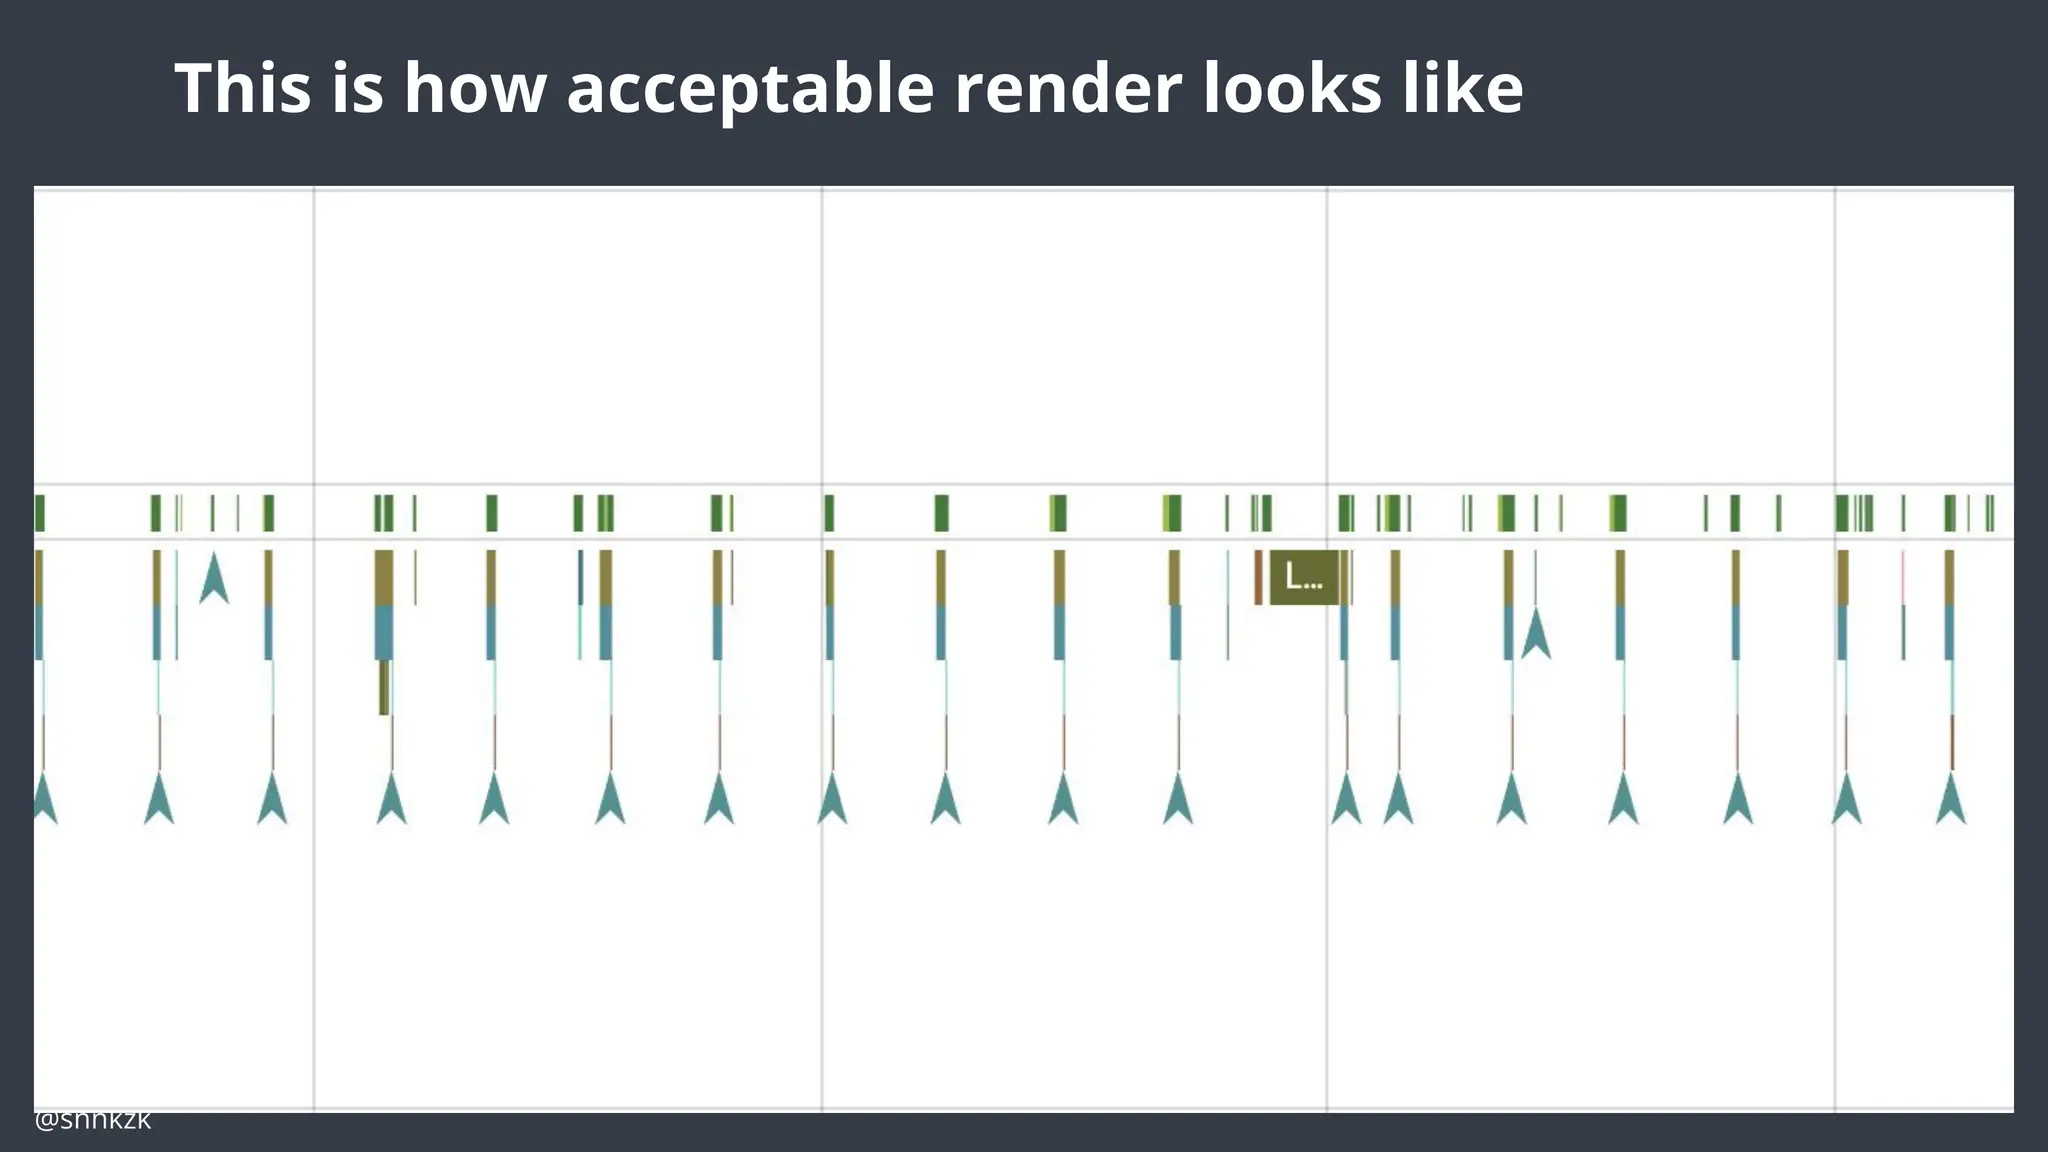
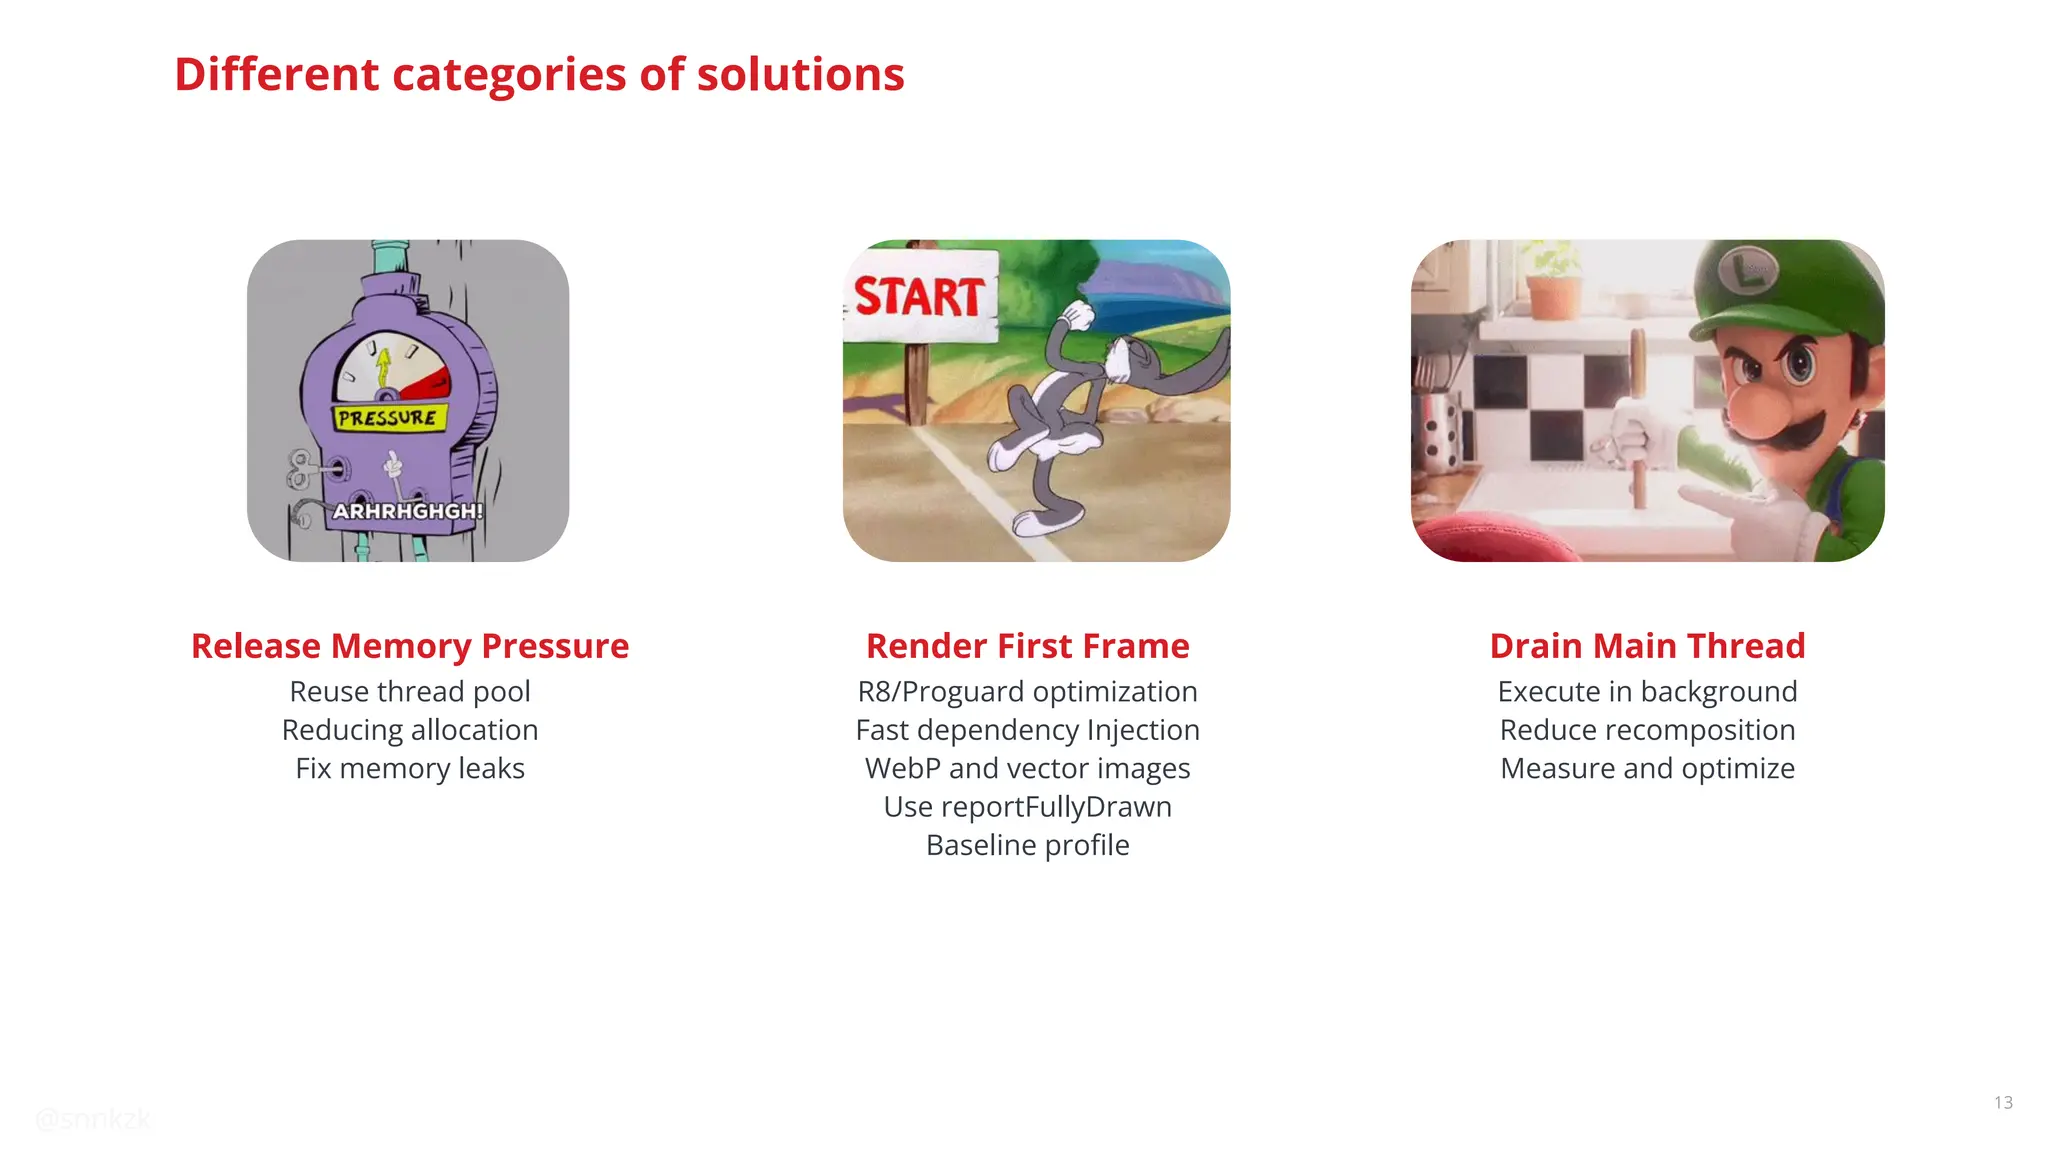
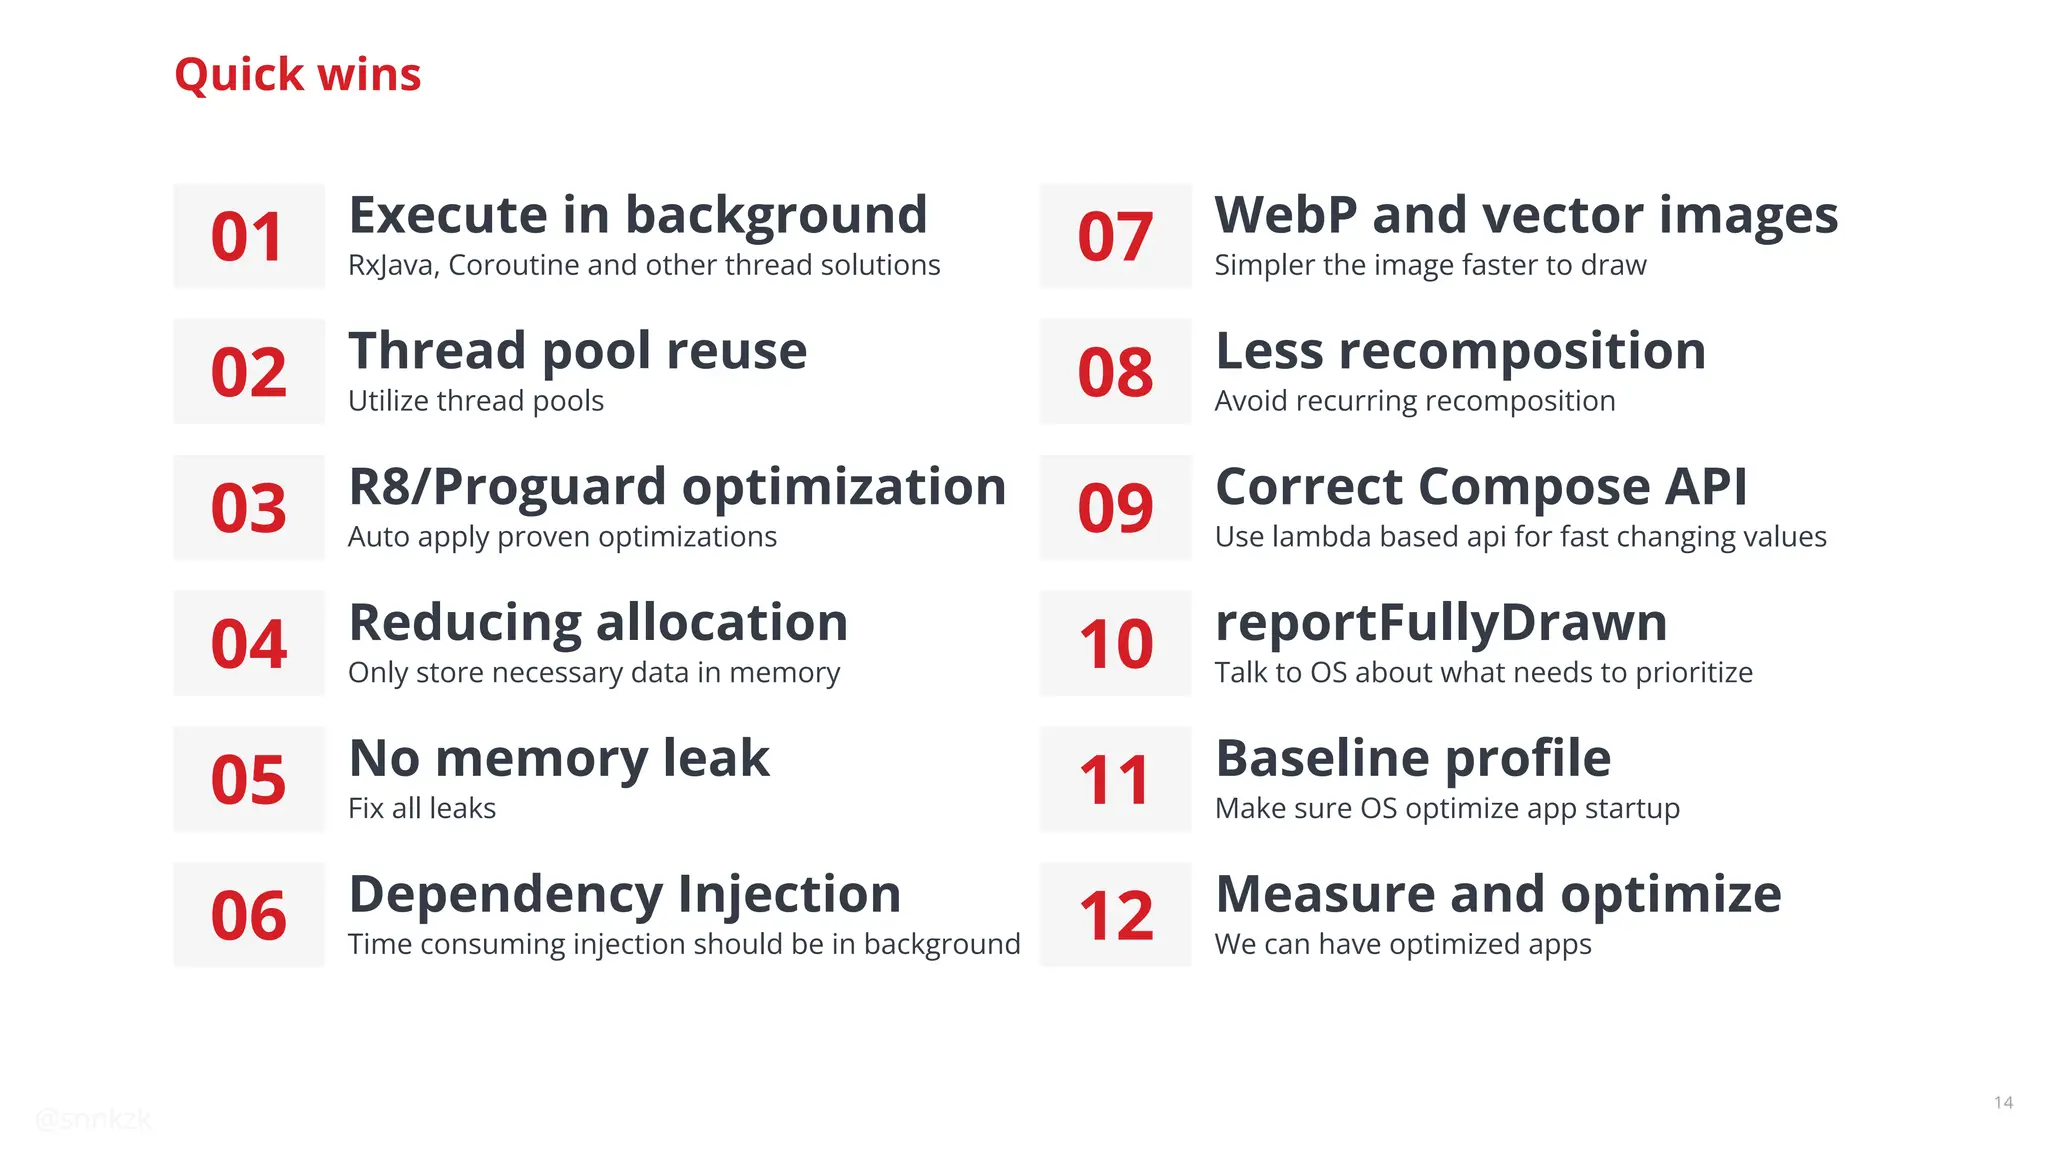
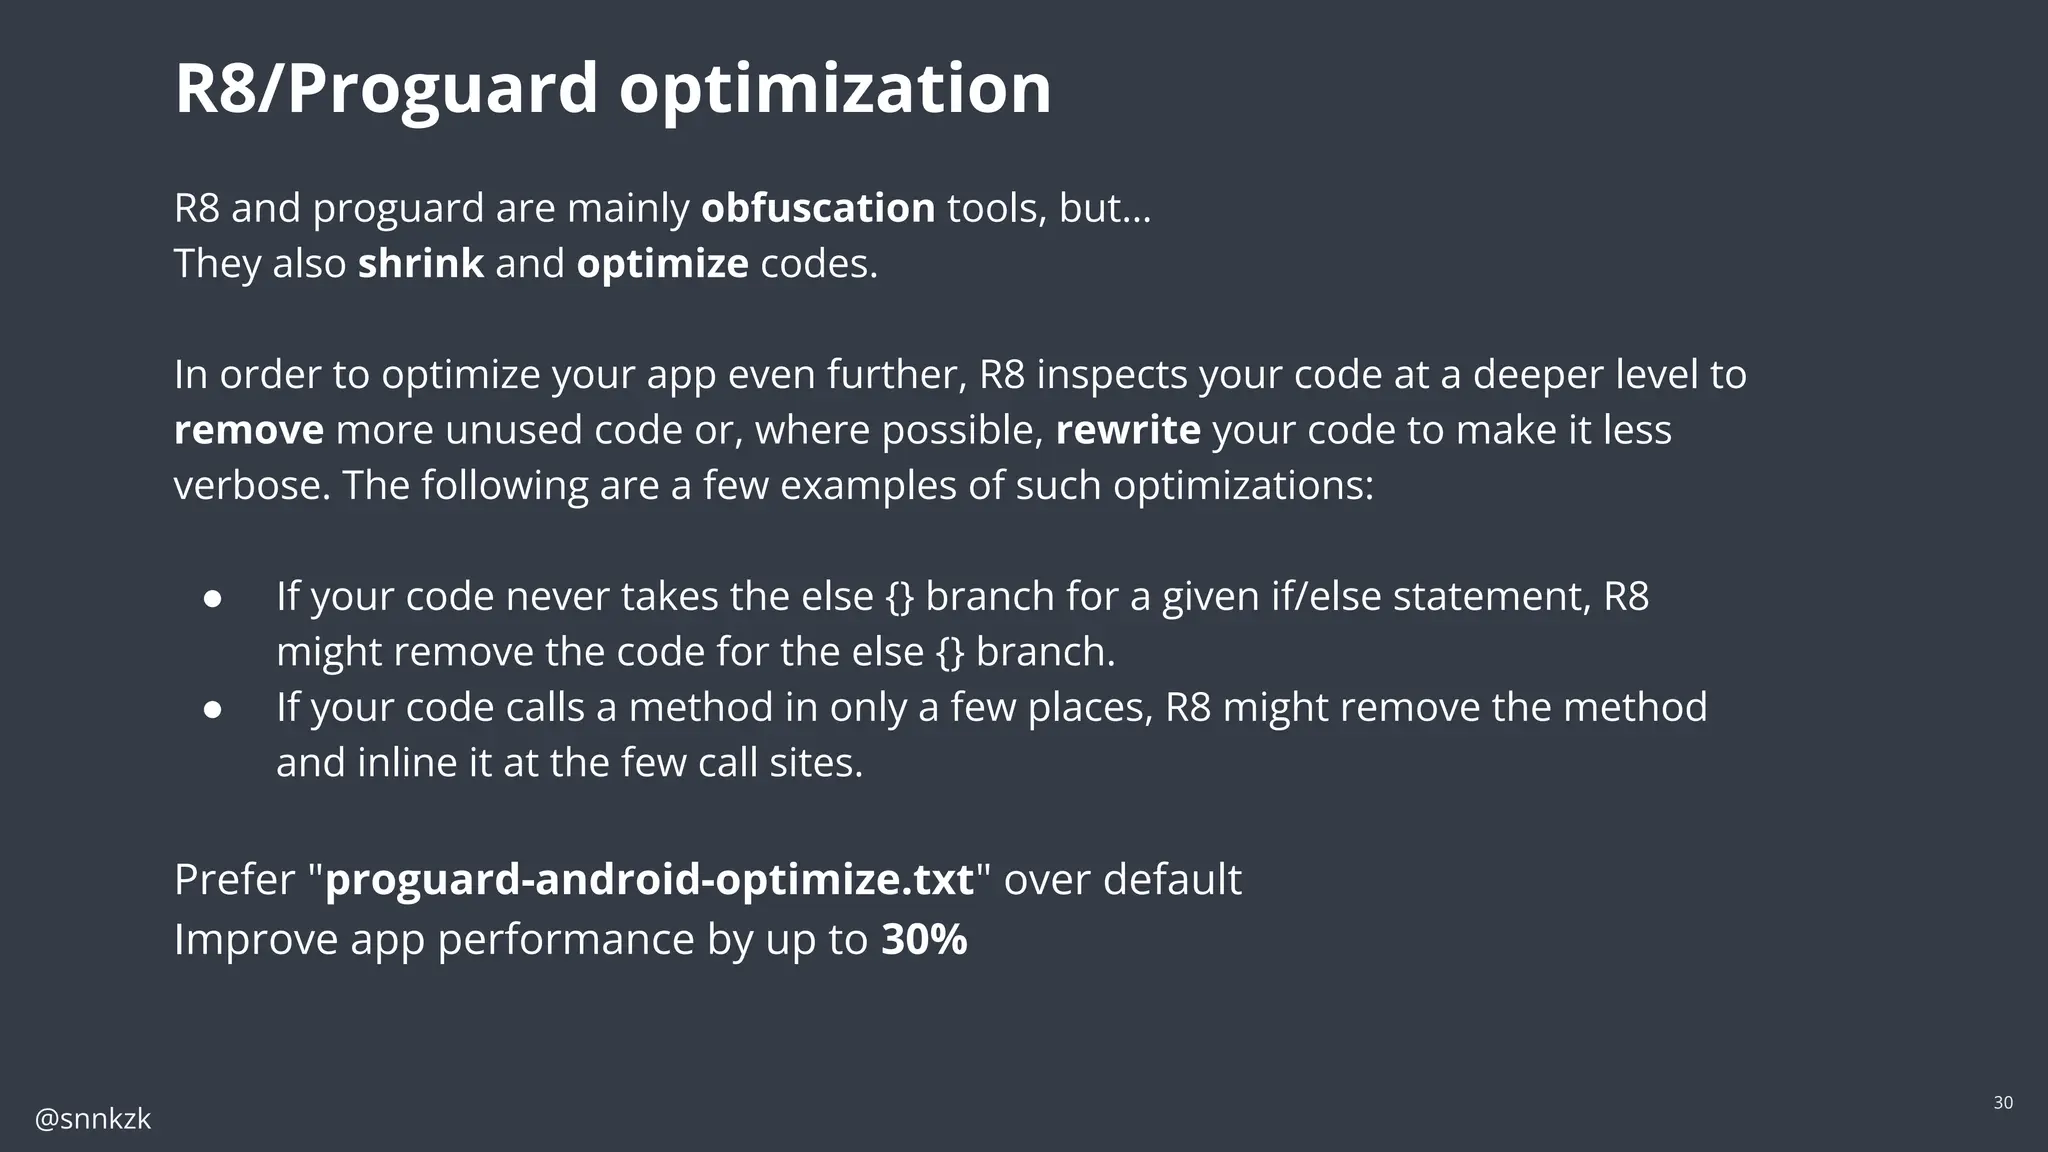
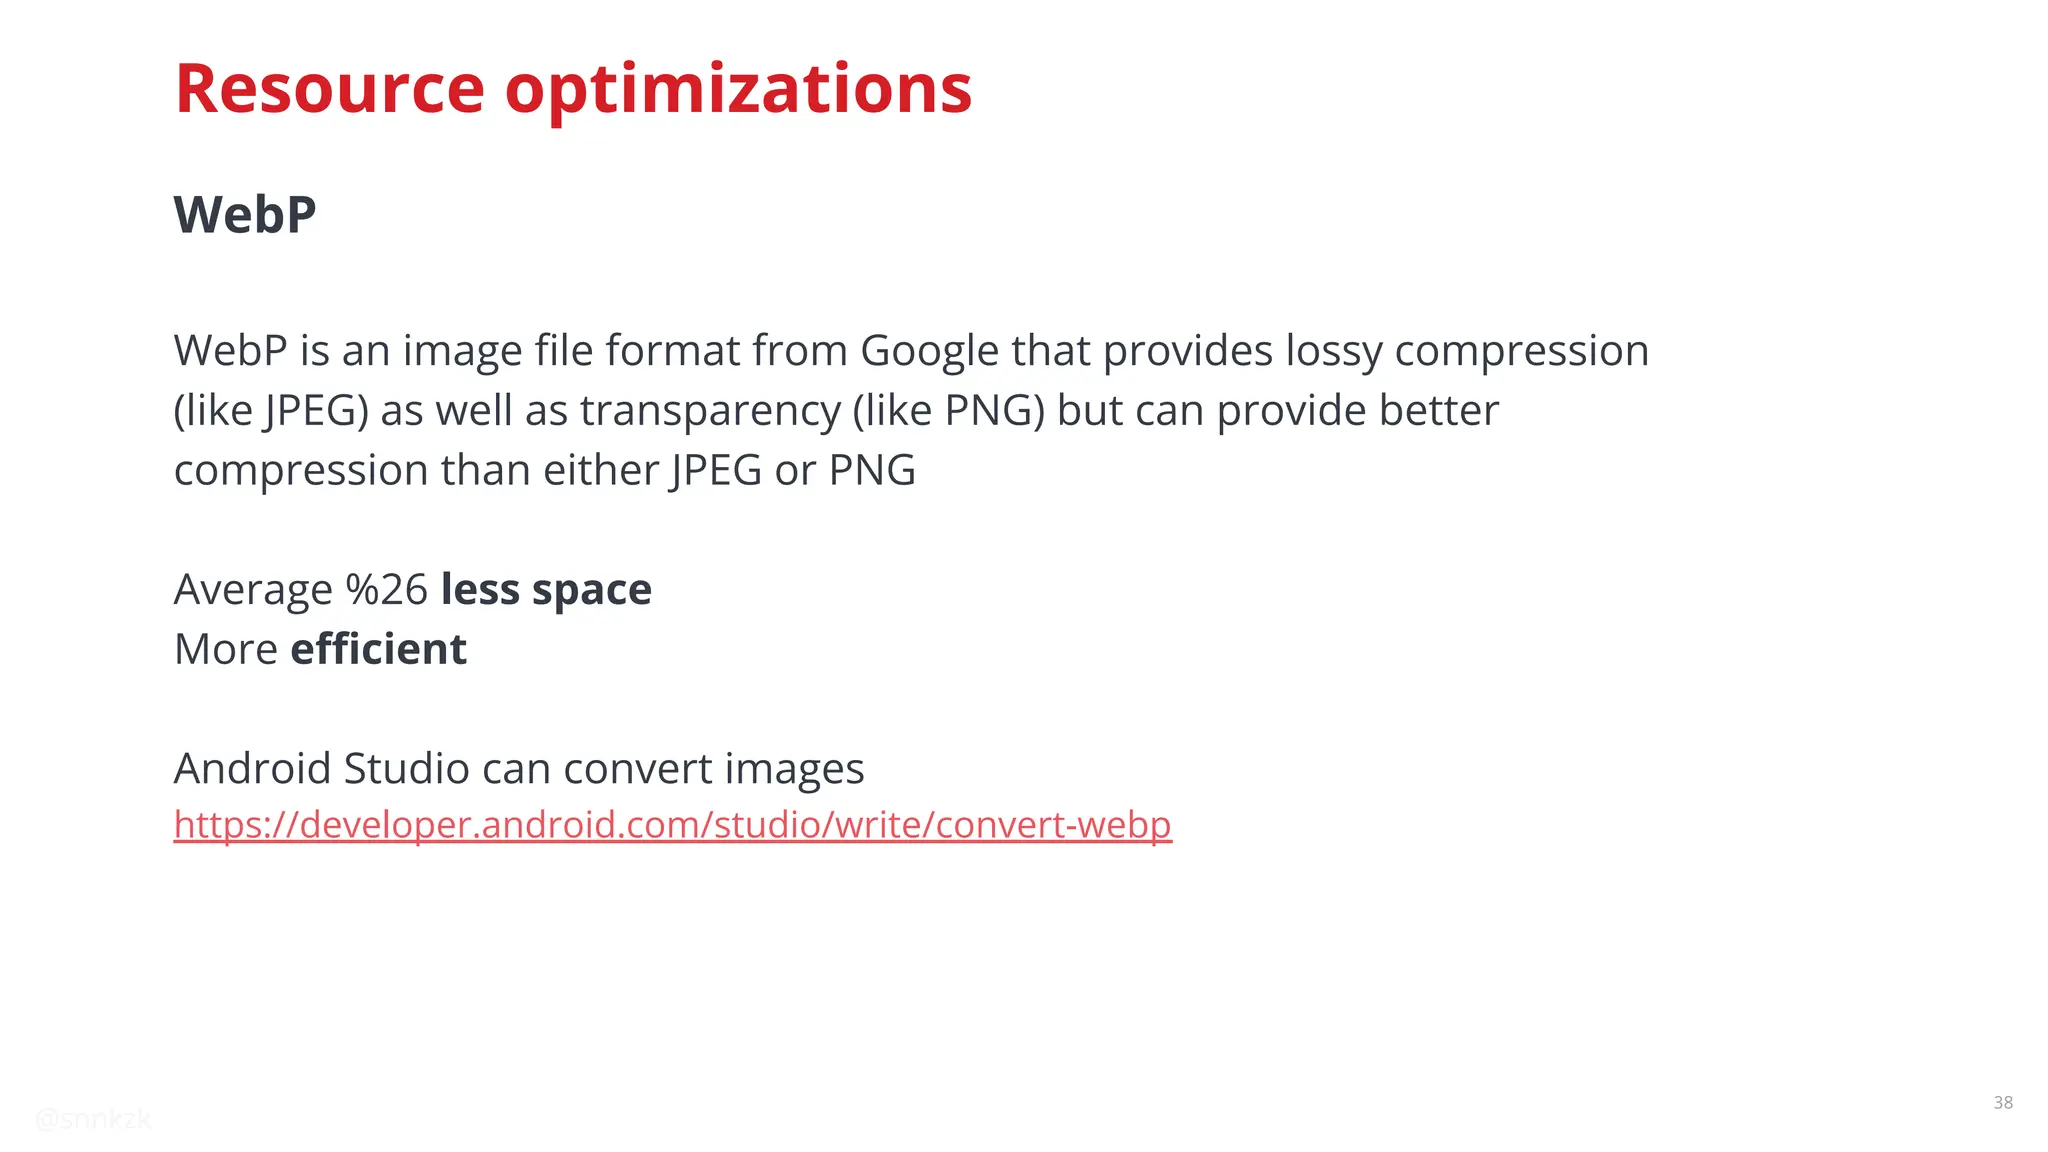
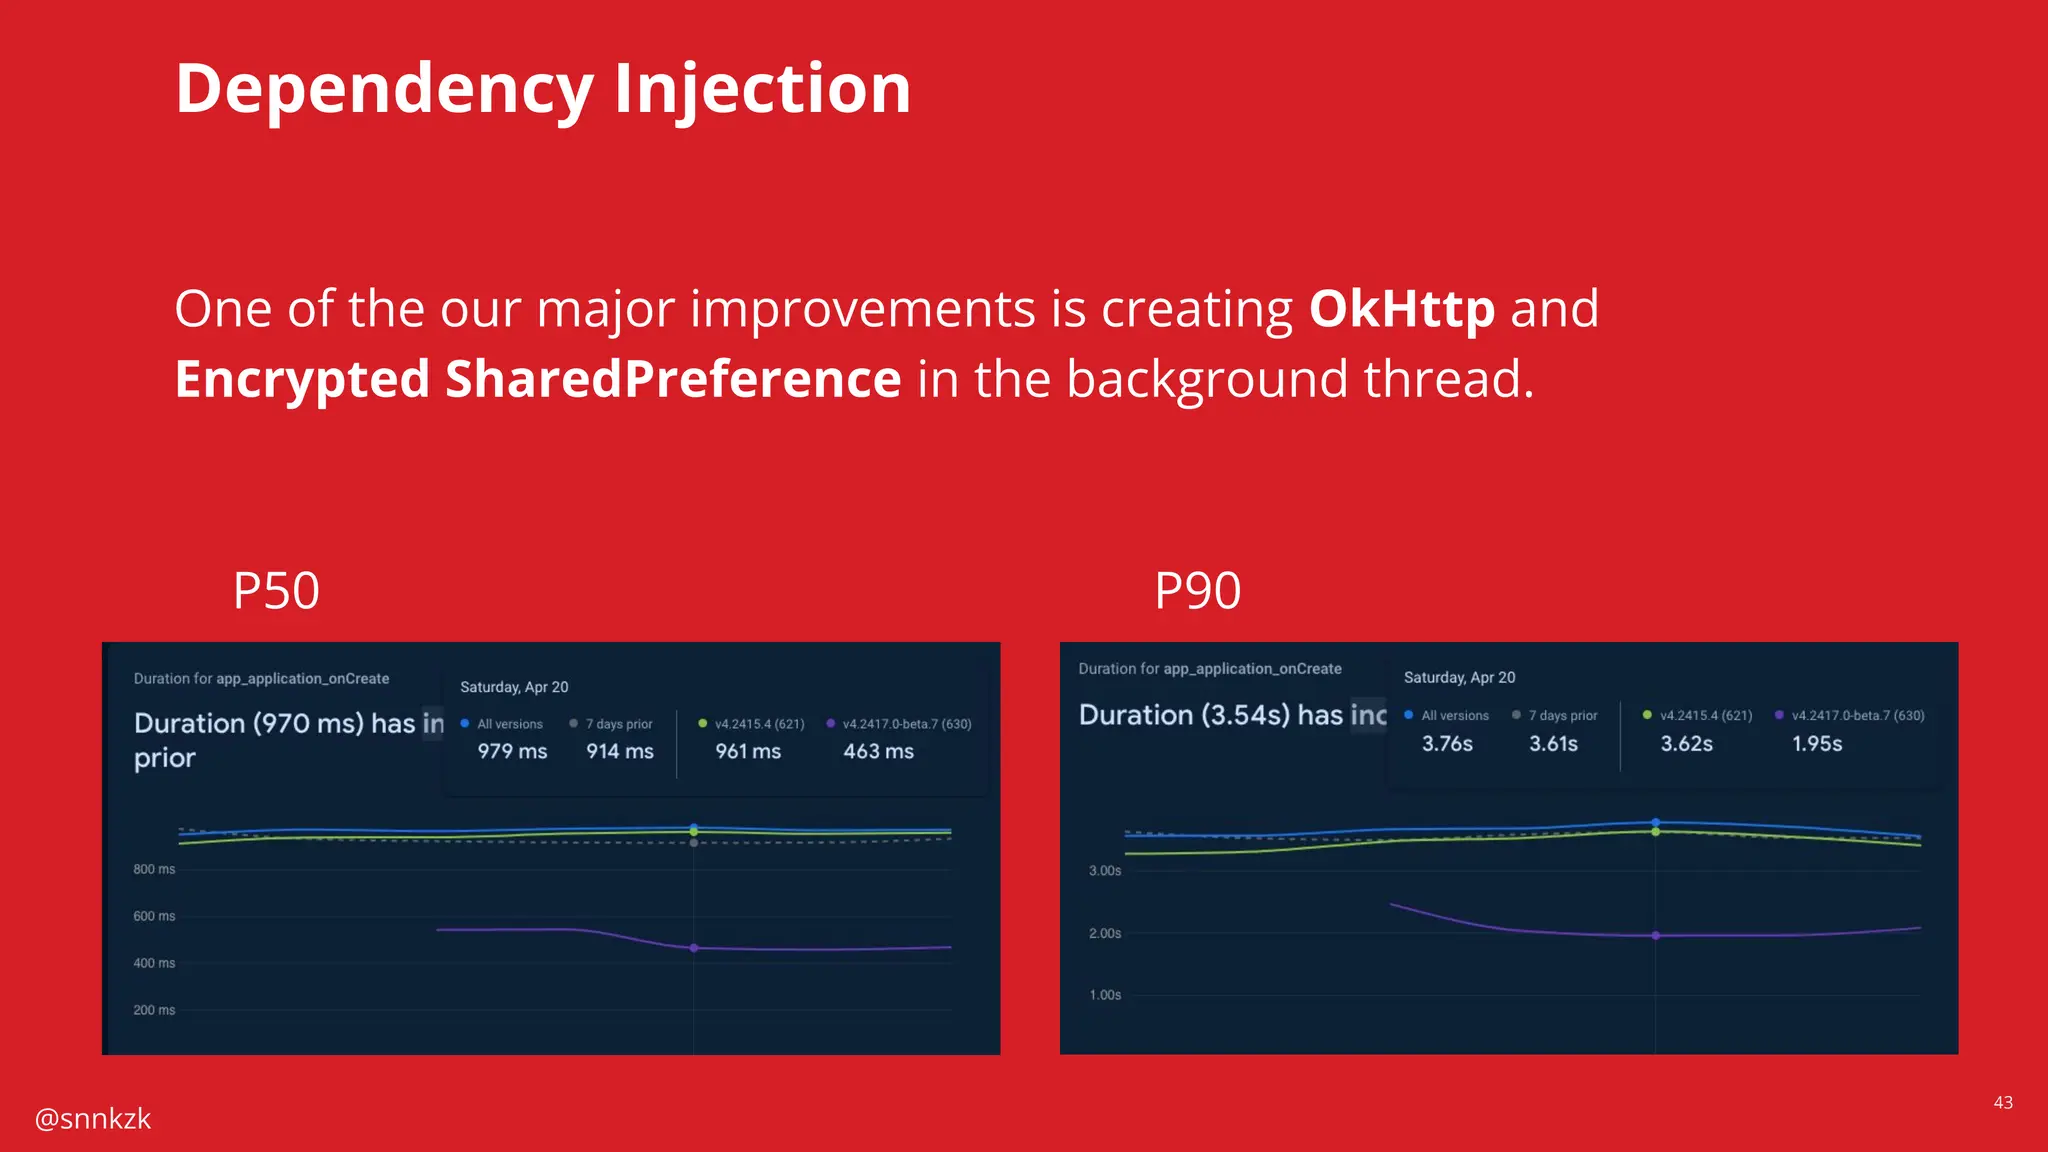
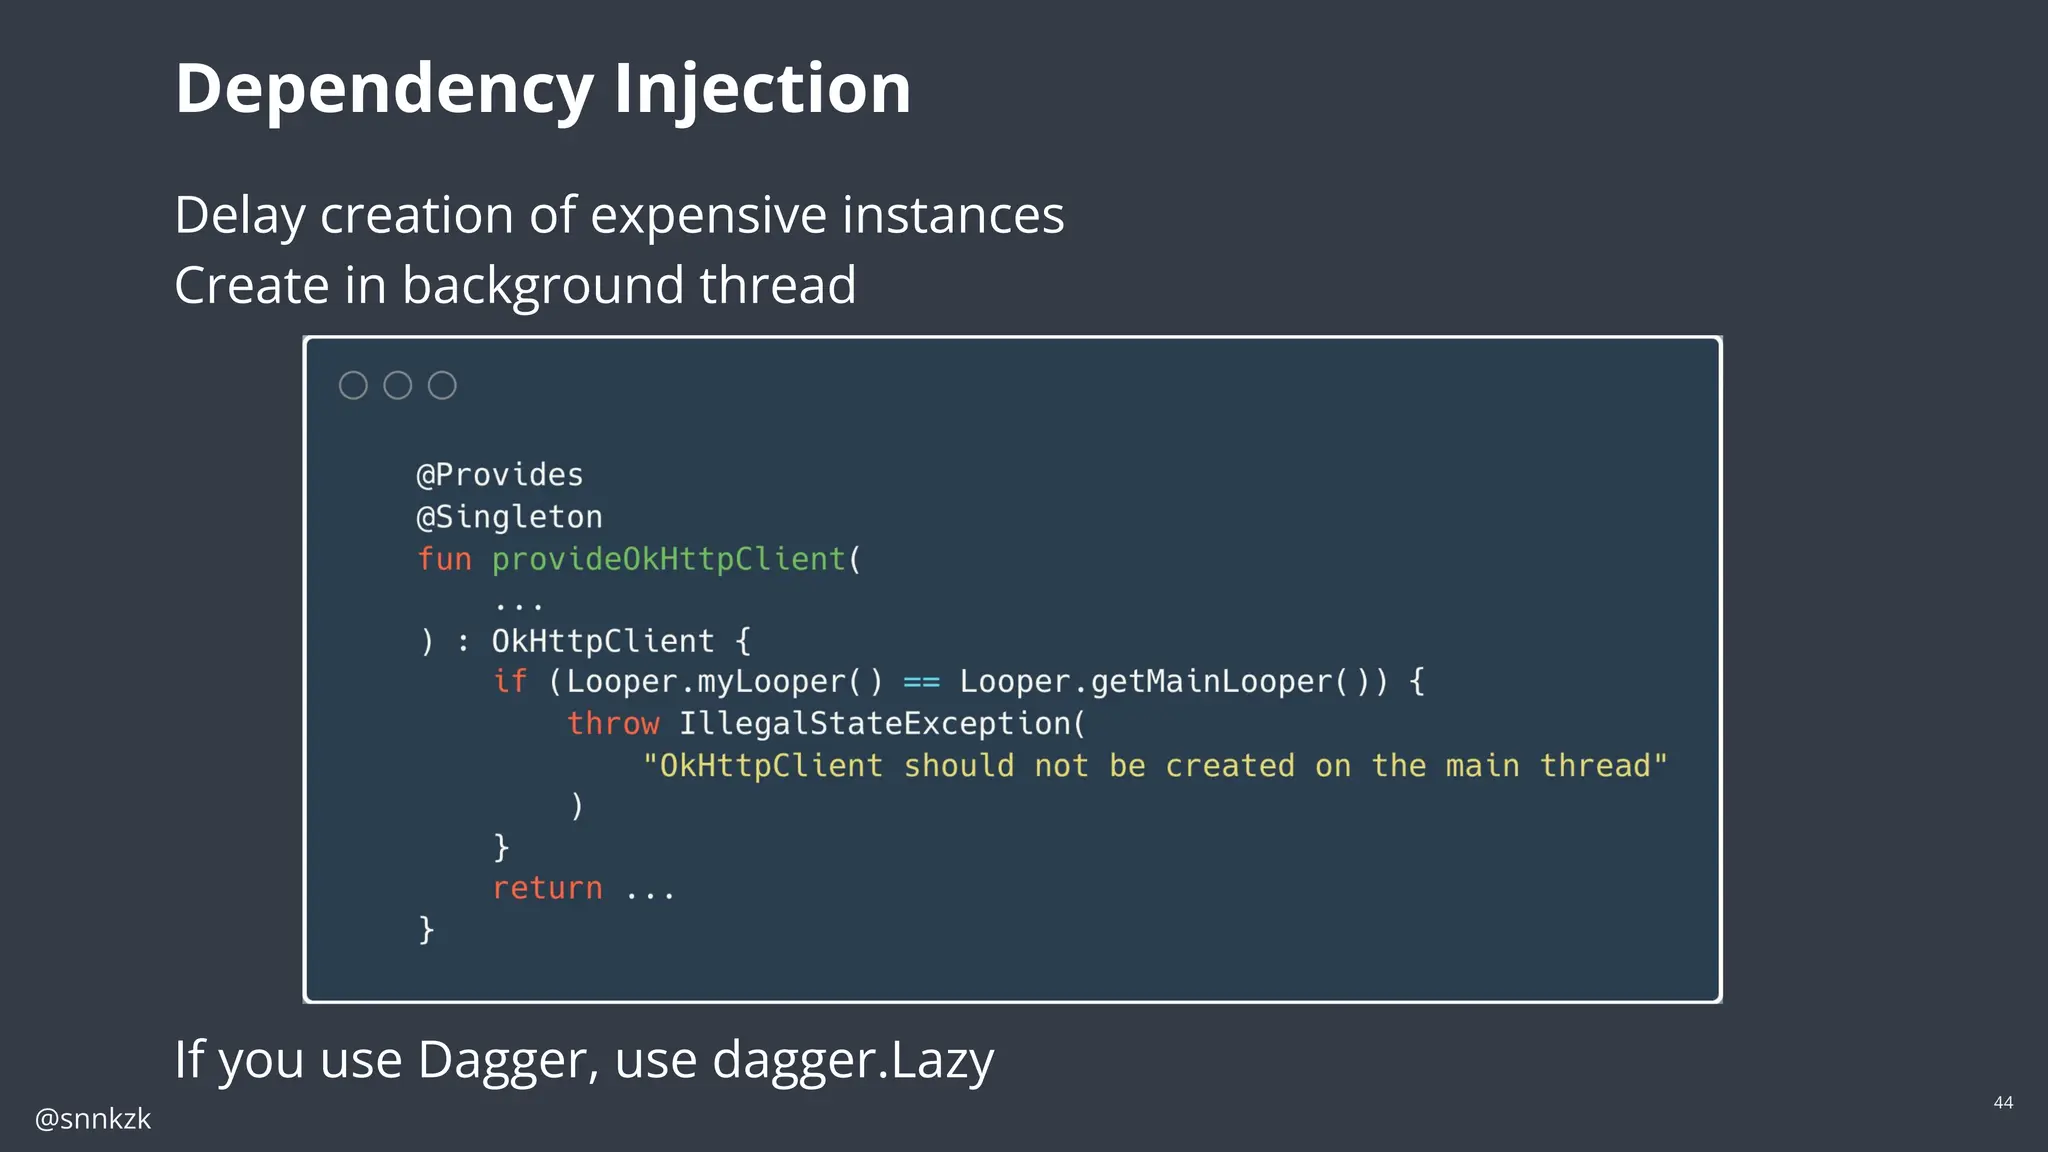
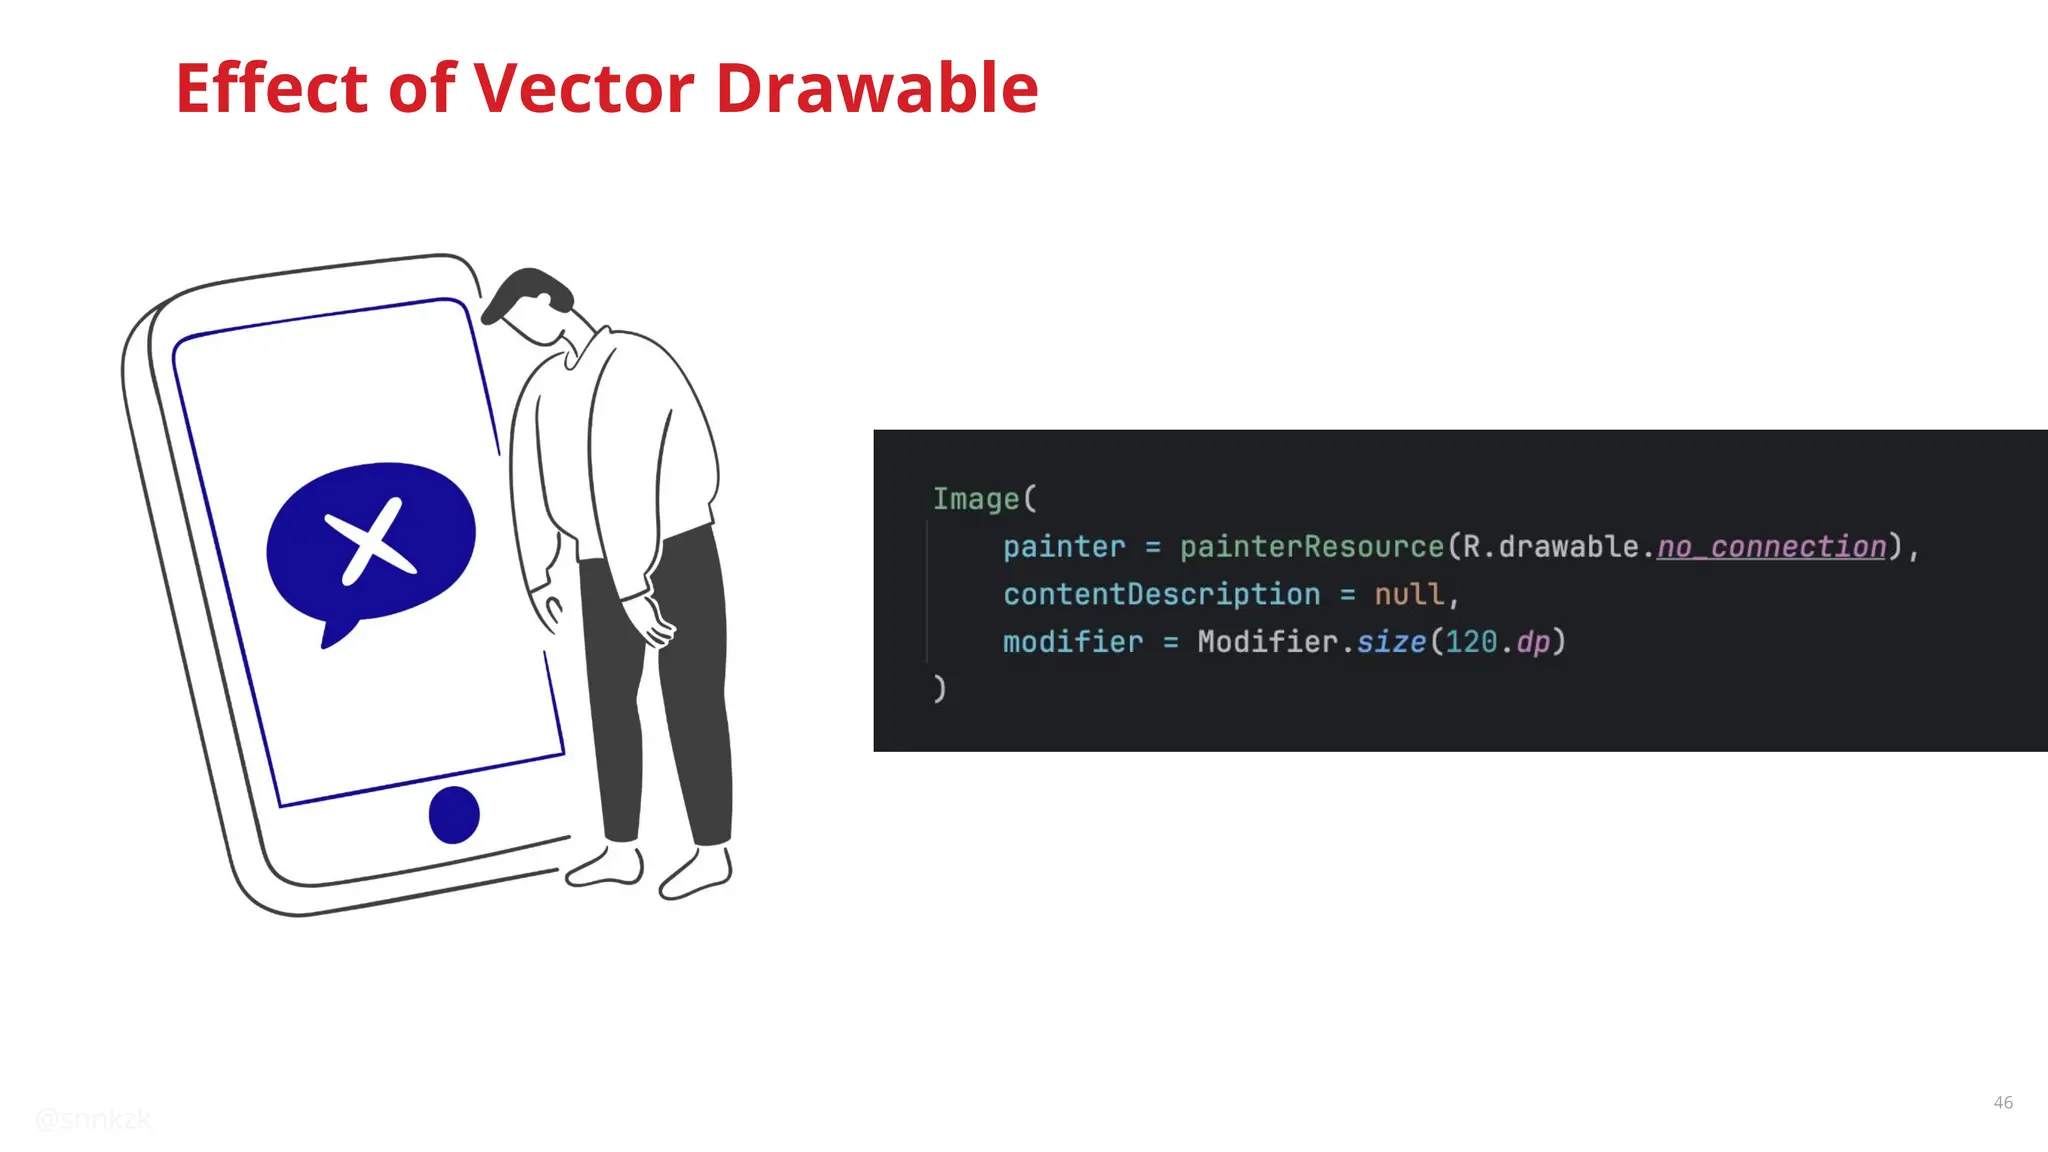
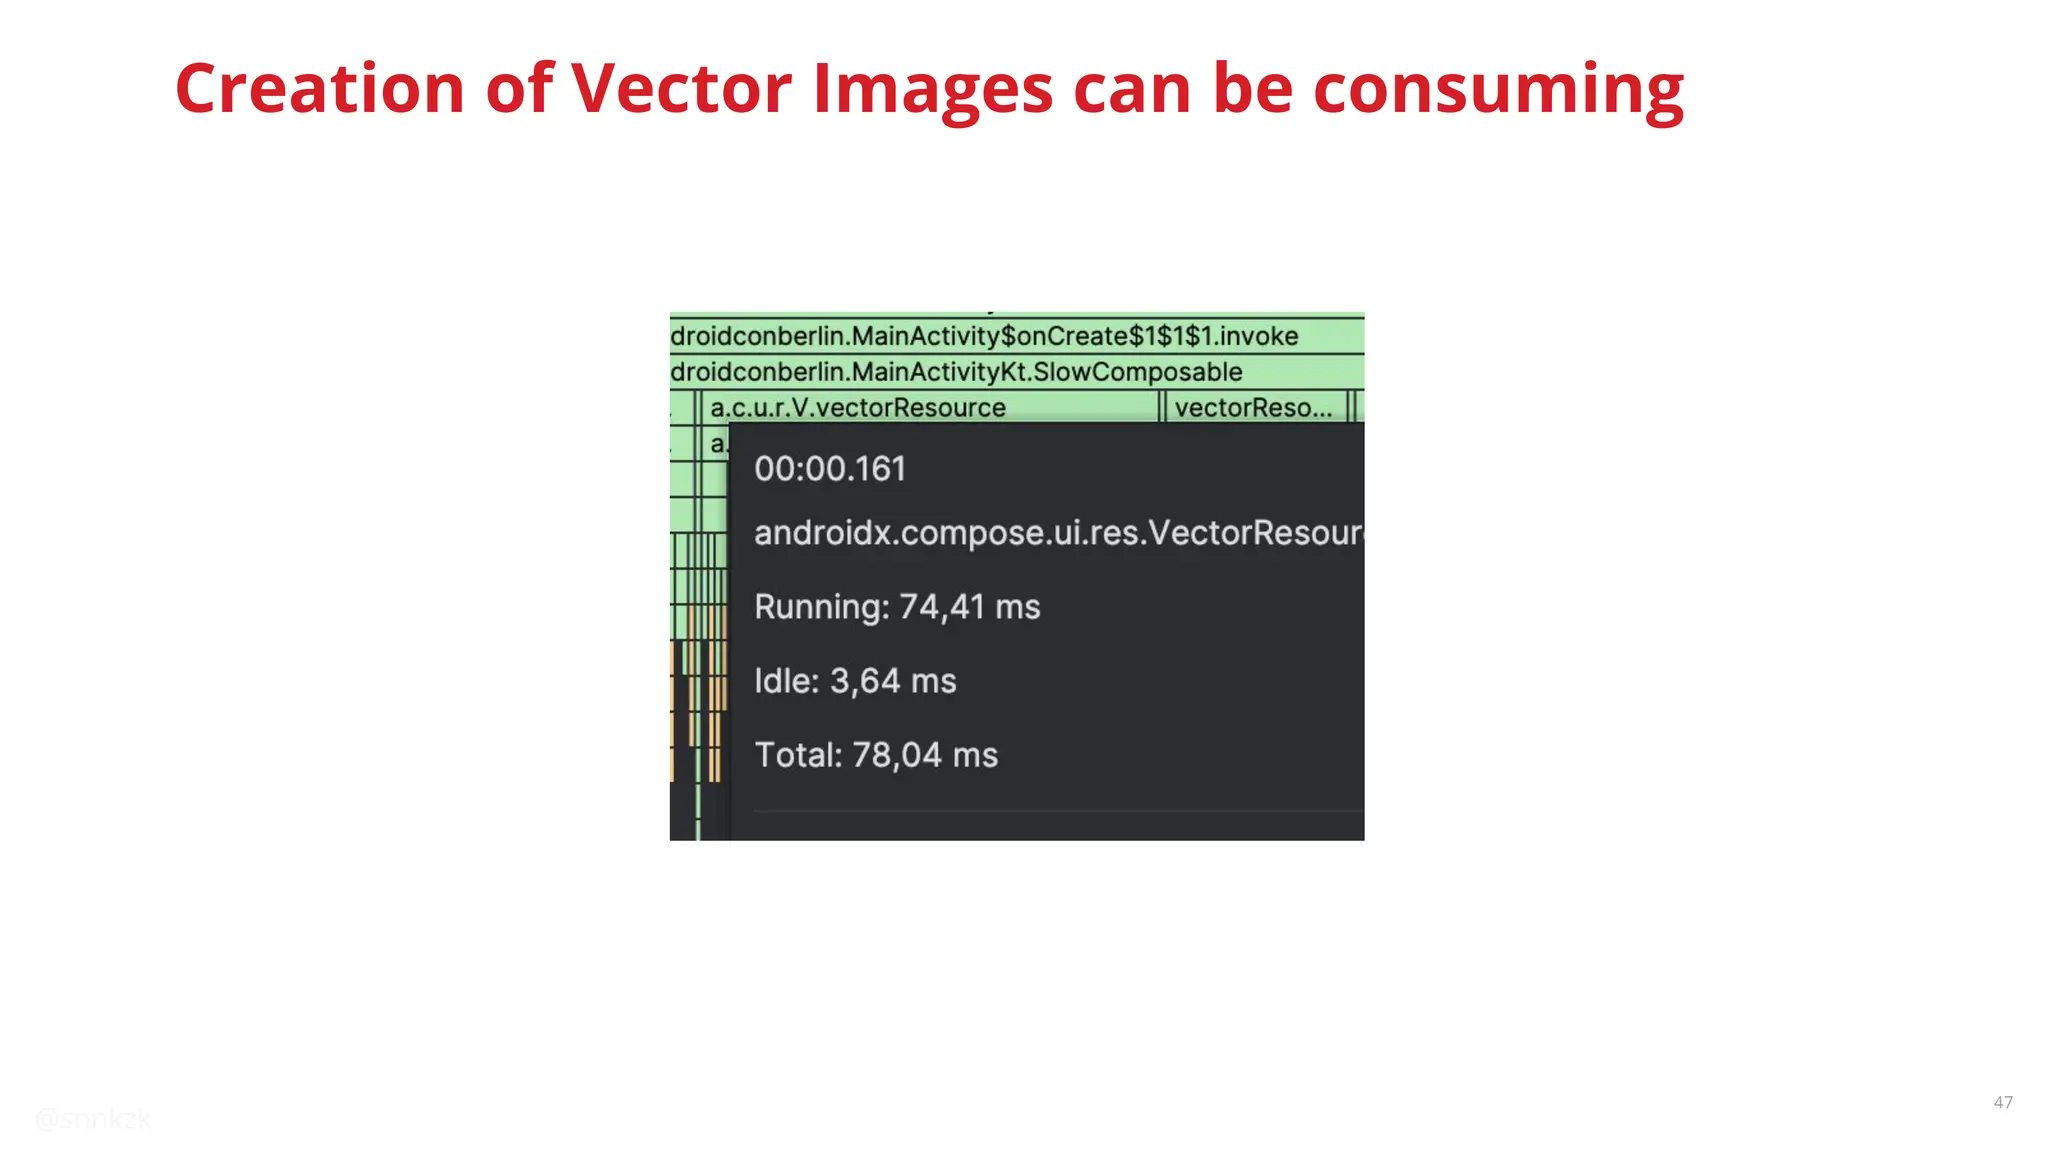
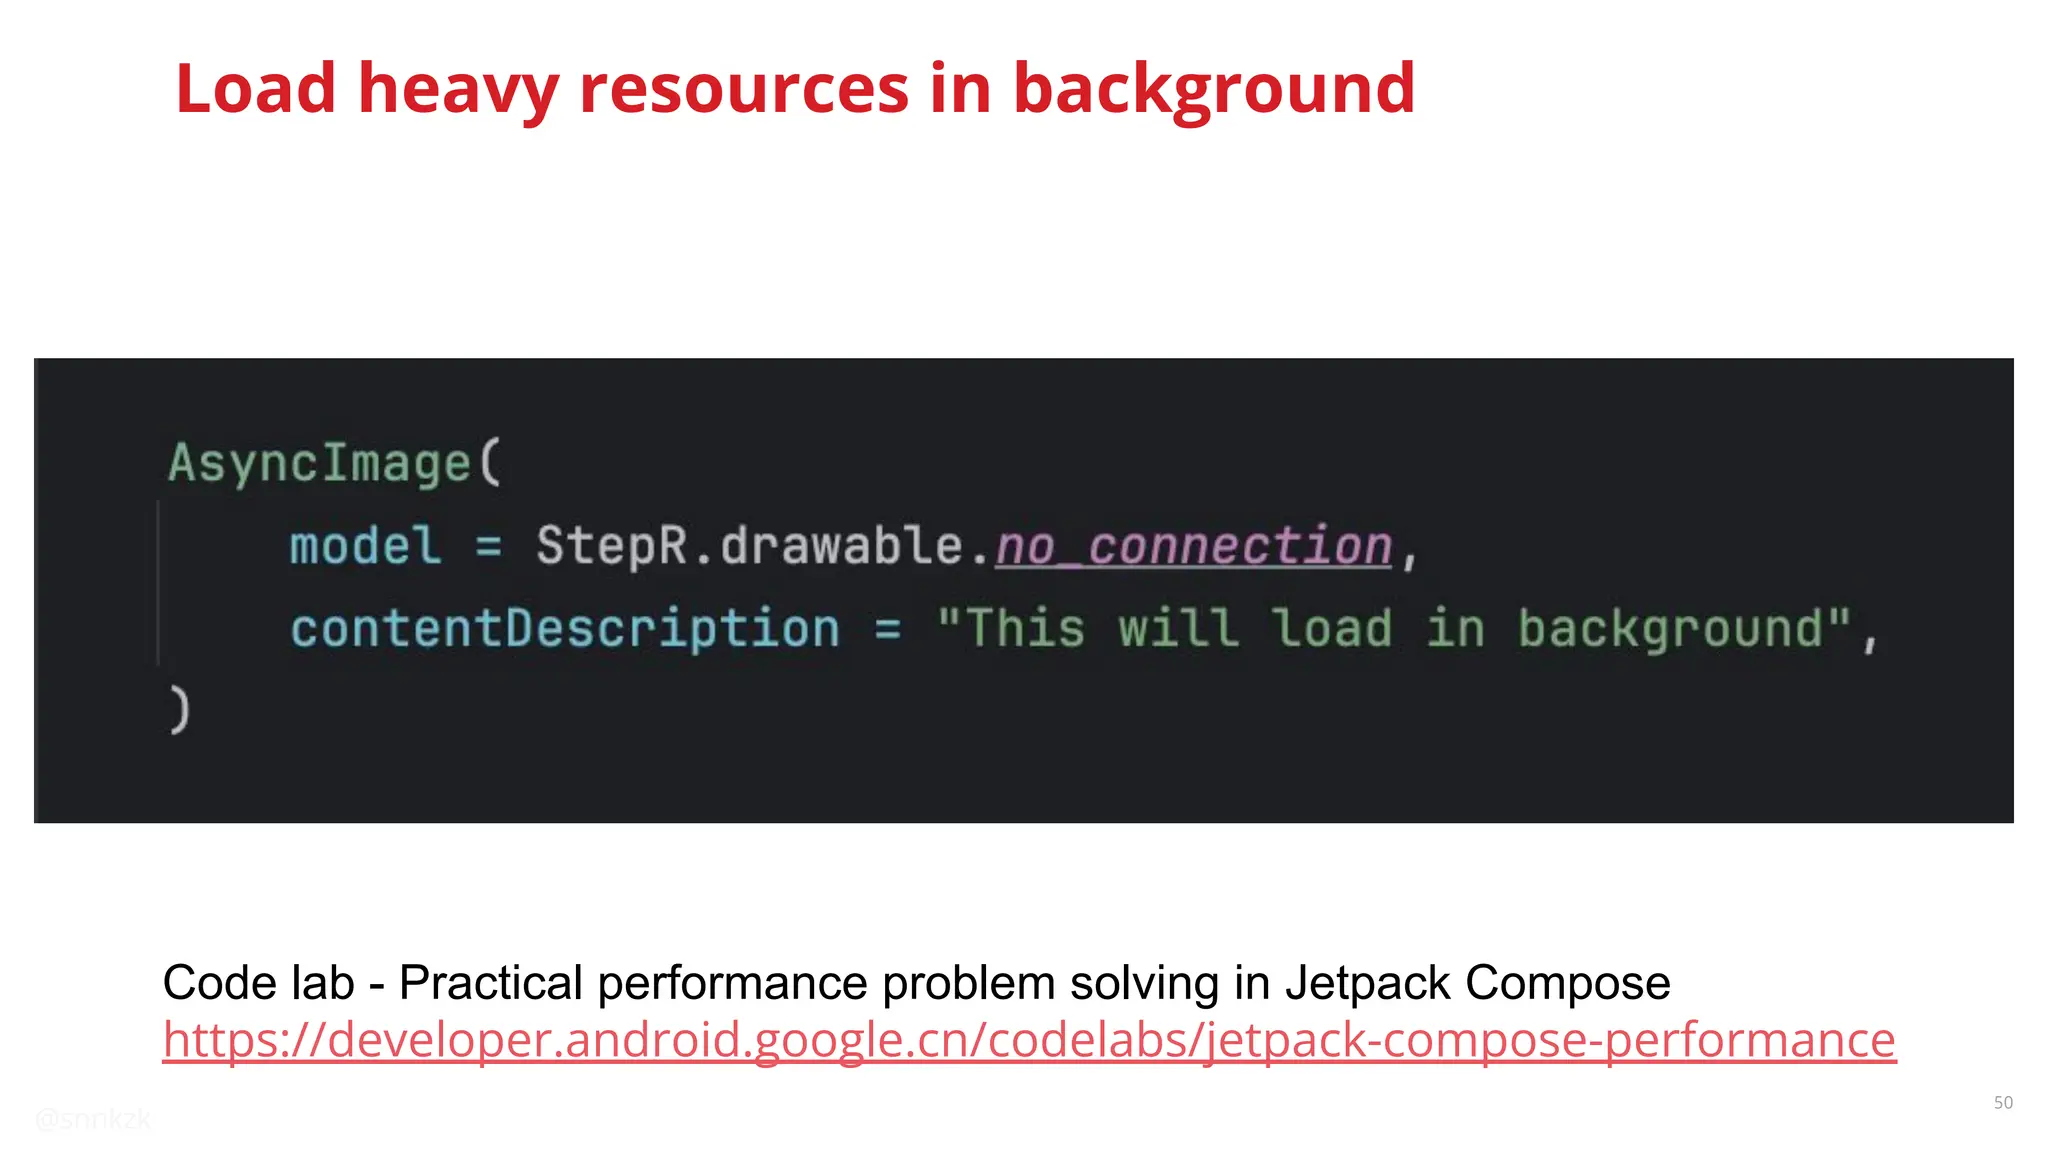
@snnkzk
Unblocking The Main Thread:
Solving ANRs and Frozen Frames
Sinan Kozak
Staff Android Developer
Google Developer Expert
@snnkzk
2
Sinan Kozak
Google Developer Expert &
Staff Android Developer
12 years Android experience
@snnkzk
I wrote a chapter about performance in 2014
book with GDG community Ankara, Turkey.
@snnkzk
3
We deliver
food over
70 countries
with a single rider application
@snnkzk
4
Production is wild,
really wild for Android
10s of thousands of different devices
@snnkzk
5
5
@snnkzk
6
Different stages of
Jank
What to measure?
@snnkzk
7
Rendering a frame
between 16ms and 700ms
Scroll
Animations
Frame rate
Slow Rendering
Rendering a frame
between 700ms and 5s
App startup
Navigation
Frozen Frame
Blocking main thread
over 5 seconds
Not being able to
handle user inputs
Application Not Responding
Different stages of Jank
@snnkzk
8
Apps have limited
resources
Focus on things we can control
@snnkzk
9
This his how bad rendering looks like
@snnkzk
10
This is how acceptable render looks like
@snnkzk
11
Can slow runtime cause app crashes?
YES
● User will continue to click the screen. Either ANR or Crash could
happen for different reasons.
● Foreground services crash when their start is delayed more than
5 seconds
@snnkzk
12
Is there a magic
solution?
Maybe…
@snnkzk
13
Reuse thread pool
Reducing allocation
Fix memory leaks
Release Memory Pressure
R8/Proguard optimization
Fast dependency Injection
WebP and vector images
Use reportFullyDrawn
Baseline profile
Render First Frame
Execute in background
Reduce recomposition
Measure and optimize
Drain Main Thread
Different categories of solutions
@snnkzk
14
Quick wins
01 Execute in background
RxJava, Coroutine and other thread solutions
02 Thread pool reuse
Utilize thread pools
03 R8/Proguard optimization
Auto apply proven optimizations
04 Reducing allocation
Only store necessary data in memory
05 No memory leak
Fix all leaks
06 Dependency Injection
Time consuming injection should be in background
07 WebP and vector images
Simpler the image faster to draw
08 Less recomposition
Avoid recurring recomposition
09 Correct Compose API
Use lambda based api for fast changing values
10 reportFullyDrawn
Talk to OS about what needs to prioritize
11 Baseline profile
Make sure OS optimize app startup
12 Measure and optimize
We can have optimized apps
@snnkzk
15
15
Reducing
allocation
Garbage collector pauses
runtime to clean up
Spare memory for all features
Photo by Andreas Gücklhorn on Unsplash
@snnkzk
16
Reducing allocation
@snnkzk
17
In your heap dump, look for memory leaks caused by any of the following:
● Long-lived references to Activity, Context, View, Drawable, and other objects
that might hold a reference to the Activity or Context container.
● Non-static inner classes, such as a Runnable, that can hold an Activity instance.
● Caches that hold objects longer than necessary.
Memory leak
In your heap dump, look for memory leaks caused by any of the
following:
● Long-lived references to Activity, Context, View, Drawable, and
other objects that might hold a reference to the Activity or
Context container.
● Listeners or Runnables can hold an Activity instance.
● Caches that hold objects longer than necessary.
@snnkzk
18
Running with memory leaks
@snnkzk
19
Fix memory leaks
@snnkzk
20
Memory leak
Detection:
● Leak Canary
● Android Studio
● Strict Mode
● Third party memory analyzer
Leak Canary Plumber fixes known common issues.
https://github.com/square/leakcanary/tree/main/plumber
@snnkzk
21
21
Collect
StrictMode
violations
Easiest way to collect data
@snnkzk
22
Collect StrictMode violations
@snnkzk
23
Collect StrictMode violations
@snnkzk
24
Use multi thread
solutions
● IO operations
● Data parsing
● Encryption
● Any time consuming operation
Move work to the background
Photo by Campbell on Unsplash
@snnkzk
25
Execute in background with Coroutine
https://kotlinlang.org/docs/coroutines-overview.html
https://developer.android.com/kotlin/coroutines#use-coroutines-for-main-safety
@snnkzk
26
Share Thread Pools
A single thread can use 1-3 MB memory
@snnkzk
27
Features with own thread pools
Most of features have their own thread pool
● RxJava
● Coroutine
● OkHttp
● Image loaders
● Room
● RecyclerView + DiffUtil
● WorkManager
● … many more
And they have APIs to change thread pool
@snnkzk
28
Share Thread Pools
We shared Coroutine Dispatchers with
● RxJava
● OkHttp
● Coil
● WorkManager
Thread count reduced 180+ to 130~ during high load operation
“asOkHttpExecutorService” is a custom implementation that only handle execute function
@snnkzk
29
Runtime optimization
Code we write is not same as core runs on the device
@snnkzk
30
R8 and proguard are mainly obfuscation tools, but…
They also shrink and optimize codes.
In order to optimize your app even further, R8 inspects your code at a deeper level to
remove more unused code or, where possible, rewrite your code to make it less
verbose. The following are a few examples of such optimizations:
● If your code never takes the else {} branch for a given if/else statement, R8
might remove the code for the else {} branch.
● If your code calls a method in only a few places, R8 might remove the method
and inline it at the few call sites.
Prefer "proguard-android-optimize.txt" over default
Improve app performance by up to 30%
R8/Proguard optimization
@snnkzk
31
More resources optimizations
High level documentation
https://developer.android.com/build/shrink-code
https://www.guardsquare.com/manual/configuration/optimizations
Detailed posts
https://jakewharton.com/blog/
@snnkzk
32
Compose recomposition
optimizations
Does count matter?
@snnkzk
33
Recomposition
Recompose count shouldn’t affect correctness.
The compose runtime might end up recomposing a lot more than
you’d expect.
Just looking at the code does not reveal reasons.
Functions can be inline
Classes can be mutable
@snnkzk
34
https://dev.to/zachklipp/scoped-recomposition-jetpack-compose-what-happens-when-state-changes-l78
Donut hole skipping
Compose API design enforces
better performance with
lambda and scoping
@snnkzk
35
Donut hole skipping
● Lambdas are special in Compose
● The runtime keeps track of values used in lambdas
● Lambdas get reevaluated if values change
● Composable can be skipped if they are not affected by change
@snnkzk
36
Compose API design
@snnkzk
37
Rendering first pixel
Avoid heavy operations during start up
@snnkzk
38
WebP
WebP is an image file format from Google that provides lossy compression
(like JPEG) as well as transparency (like PNG) but can provide better
compression than either JPEG or PNG
Average %26 less space
More efficient
Android Studio can convert images
https://developer.android.com/studio/write/convert-webp
Resource optimizations
@snnkzk
39
Resource optimizations
Vector Drawables
is a vector graphic defined in an XML file as a
set of points, lines, and curves along with its
associated color information.
Scalable
svg can be converted to Vector drawables
Simpler is better
The initial loading of a vector drawable can cost
more CPU cycles than the corresponding raster
image.
Size save should be justified with performance
Use Avocado tool to simplify complex vectors
https://github.com/alexjlockwood/avocado
@snnkzk
40
Resource optimizations
@snnkzk
41
Dependency Injection
DI slowness effects first frame rendering
@snnkzk
42
Dependency Injection
Lost of things run on main thread during dependency injection
● Activity/Fragment creation
● Field assignments
● init blocks of injected classes
@snnkzk
43
Dependency Injection
P50 P90
One of the our major improvements is creating OkHttp and
Encrypted SharedPreference in the background thread.
@snnkzk
44
Dependency Injection
Delay creation of expensive instances
Create in background thread
If you use Dagger, use dagger.Lazy
@snnkzk
45
Show me real example
Dependency injection issue
Inefficient vector drawable usage
@snnkzk
46
Effect of Vector Drawable
@snnkzk
47
Creation of Vector Images can be consuming
@snnkzk
48
Effect of Vector Drawable
@snnkzk
49
49
Talk to
designers for
simpler svgs
You can use webp images or
image loading libraries
@snnkzk
50
Load heavy resources in background
Code lab - Practical performance problem solving in Jetpack Compose
https://developer.android.google.cn/codelabs/jetpack-compose-performance
@snnkzk
51
Play Store helps you
Use reportFullyDrawn for better cloud profiles
@snnkzk
52
Baseline Profiles
● Helps app startup after new install or update
● Android run ahead of time compile to prepare app startup
● We can modify and create aggregated profiles
● Libraries can have their own baseline profiles
● Compose benefit from baseline profiles
https://developer.android.com/topic/performance/baselineprofiles/create-baselineprofile
@snnkzk
53
53
How to
measure?
Real data vs profiling
@snnkzk
54
How to measure?
Data from profiling
● perfetto.dev
● Systrace
● CPU and memory allocation
● Layout inspector and debugger
Data from users
● Firebase Performance Monitoring or similar solutions
● JankStat library
● Memory leaks
● Strict mode
@snnkzk
55
Measure as much as you can
● Profile a variant close to release
● Measure high level first
● Add more granular metrics and traces
● Use benchmark tests
● Profile before and after changes
● Collect data from production
@snnkzk
56
Random ANR points during app start up
ANR stacktrace is delayed
Android 14 has improved ANR capturing
Filter ANR for Android 14+ to get better picture
ANR report only contain last executed things
There could be other slowness on main thread
@snnkzk
57
Visible performance is
one side of the coin
App needs to be performant in all operations.
@snnkzk
58
10 years retro of
performance suggestions
Comments are welcome in QA
@snnkzk
59
@snnkzk
60
10 years retro of performance suggestions
View hierarchy - ViewStub > Composables with if else check
ListView - ViewHolder > RecyclerView + LazyColumn
Memory leaks > Memory leaks still exists
Running in background > Coroutine
We still have things to optimized.
They are just different.
@snnkzk
61
I hope you have this chart in your next release
@snnkzk
Thank you
github.com/kozaxinan linkedin.com/in/sinankozak strava.com/athletes/sinankozak
@snnkzk
Do you have any questions?

Unblocking The Main Thread_ Solving ANRs and Frozen Frames.pdf