History of UML
•Developed to standardize and unify object-oriented modeling notations.
• Before UML: Different notations → complexity & inconsistency.
• Mid-1990s – Created by the 'Three Amigos': Grady Booch, Ivar Jacobson, James Rumbaugh.
• Part of Rational Software Corporation.
3.
Motivation
• Problem: Nostandard in object-oriented modeling.
• Issues: Miscommunication, incompatibility between models.
• Goal: Integrate strengths of leading methods.
• Create a single, standard, comprehensive modeling language.
4.
Booch Method
• Creator:Grady Booch.
• Focus: Design & construction of object-oriented systems.
• Features: Modularity & encapsulation, static & dynamic views.
• Supports iterative & incremental development.
• Example: Banking system with inheritance & polymorphism.
5.
Object Modeling Technique(OMT)
• Creator: James Rumbaugh.
• Focus: Analysis & design phases.
• Models: Object Model, Dynamic Model, Functional Model.
• Example: Inventory system with Product, Warehouse, Supplier.
6.
Object-Oriented Software Engineering
(OOSE)
•Creator: Ivar Jacobson.
• Focus: Use Cases – interaction between actors & system.
• Advantages: User-driven approach, aligns with business goals.
• Example: E-commerce – Place Order, Add to Cart, Make Payment.
7.
Standardization of UML
•Adopted by Object Management Group (OMG) in 1997.
• Recognized as an ISO standard.
• Ensures consistency across tools, platforms, methodologies.
8.
Introduction to UML
•General-purpose visual modeling language for object-oriented systems.
• Key Characteristics: Standardized by OMG, not a methodology, platform-independent.
• Purpose: Visualization, Design, Documentation, Communication.
9.
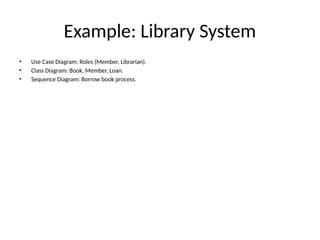
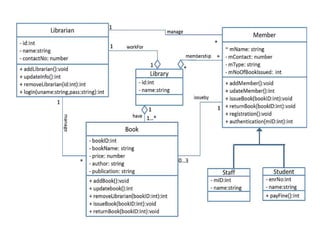
Example: Library System
•Use Case Diagram: Roles (Member, Librarian).
• Class Diagram: Book, Member, Loan.
• Sequence Diagram: Borrow book process.
10.
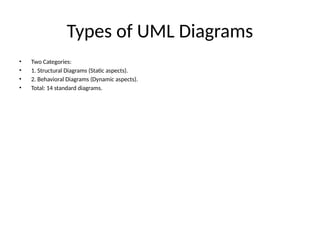
Types of UMLDiagrams
• Two Categories:
• 1. Structural Diagrams (Static aspects).
• 2. Behavioral Diagrams (Dynamic aspects).
• Total: 14 standard diagrams.
11.
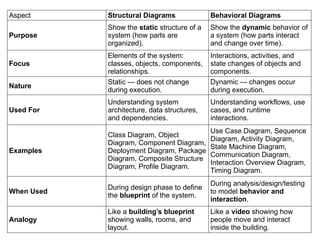
Aspect Structural DiagramsBehavioral Diagrams
Purpose
Show the static structure of a
system (how parts are
organized).
Show the dynamic behavior of
a system (how parts interact
and change over time).
Focus
Elements of the system:
classes, objects, components,
relationships.
Interactions, activities, and
state changes of objects and
components.
Nature
Static — does not change
during execution.
Dynamic — changes occur
during execution.
Used For
Understanding system
architecture, data structures,
and dependencies.
Understanding workflows, use
cases, and runtime
interactions.
Examples
Class Diagram, Object
Diagram, Component Diagram,
Deployment Diagram, Package
Diagram, Composite Structure
Diagram, Profile Diagram.
Use Case Diagram, Sequence
Diagram, Activity Diagram,
State Machine Diagram,
Communication Diagram,
Interaction Overview Diagram,
Timing Diagram.
When Used
During design phase to define
the blueprint of the system.
During analysis/design/testing
to model behavior and
interaction.
Analogy
Like a building’s blueprint
showing walls, rooms, and
layout.
Like a video showing how
people move and interact
inside the building.
12.
Structural Diagrams
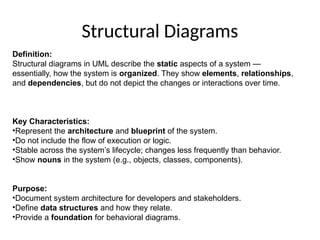
Definition:
Structural diagramsin UML describe the static aspects of a system —
essentially, how the system is organized. They show elements, relationships,
and dependencies, but do not depict the changes or interactions over time.
Key Characteristics:
•Represent the architecture and blueprint of the system.
•Do not include the flow of execution or logic.
•Stable across the system’s lifecycle; changes less frequently than behavior.
•Show nouns in the system (e.g., objects, classes, components).
Purpose:
•Document system architecture for developers and stakeholders.
•Define data structures and how they relate.
•Provide a foundation for behavioral diagrams.
13.
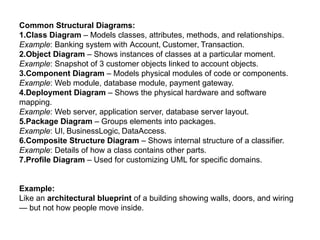
Common Structural Diagrams:
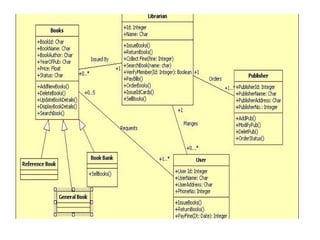
1.ClassDiagram – Models classes, attributes, methods, and relationships.
Example: Banking system with Account, Customer, Transaction.
2.Object Diagram – Shows instances of classes at a particular moment.
Example: Snapshot of 3 customer objects linked to account objects.
3.Component Diagram – Models physical modules of code or components.
Example: Web module, database module, payment gateway.
4.Deployment Diagram – Shows the physical hardware and software
mapping.
Example: Web server, application server, database server layout.
5.Package Diagram – Groups elements into packages.
Example: UI, BusinessLogic, DataAccess.
6.Composite Structure Diagram – Shows internal structure of a classifier.
Example: Details of how a class contains other parts.
7.Profile Diagram – Used for customizing UML for specific domains.
Example:
Like an architectural blueprint of a building showing walls, doors, and wiring
— but not how people move inside.
14.
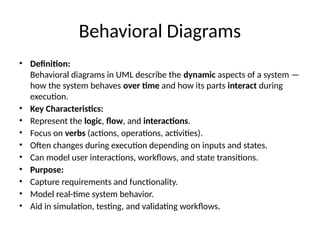
Behavioral Diagrams
• Definition:
Behavioraldiagrams in UML describe the dynamic aspects of a system —
how the system behaves over time and how its parts interact during
execution.
• Key Characteristics:
• Represent the logic, flow, and interactions.
• Focus on verbs (actions, operations, activities).
• Often changes during execution depending on inputs and states.
• Can model user interactions, workflows, and state transitions.
• Purpose:
• Capture requirements and functionality.
• Model real-time system behavior.
• Aid in simulation, testing, and validating workflows.
15.
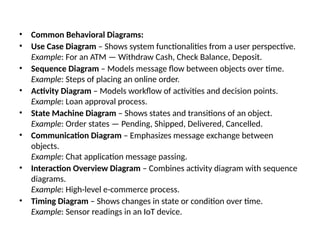
• Common BehavioralDiagrams:
• Use Case Diagram – Shows system functionalities from a user perspective.
Example: For an ATM — Withdraw Cash, Check Balance, Deposit.
• Sequence Diagram – Models message flow between objects over time.
Example: Steps of placing an online order.
• Activity Diagram – Models workflow of activities and decision points.
Example: Loan approval process.
• State Machine Diagram – Shows states and transitions of an object.
Example: Order states — Pending, Shipped, Delivered, Cancelled.
• Communication Diagram – Emphasizes message exchange between
objects.
Example: Chat application message passing.
• Interaction Overview Diagram – Combines activity diagram with sequence
diagrams.
Example: High-level e-commerce process.
• Timing Diagram – Shows changes in state or condition over time.
Example: Sensor readings in an IoT device.
16.
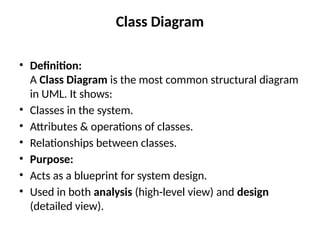
Class Diagram
• Definition:
AClass Diagram is the most common structural diagram
in UML. It shows:
• Classes in the system.
• Attributes & operations of classes.
• Relationships between classes.
• Purpose:
• Acts as a blueprint for system design.
• Used in both analysis (high-level view) and design
(detailed view).
17.
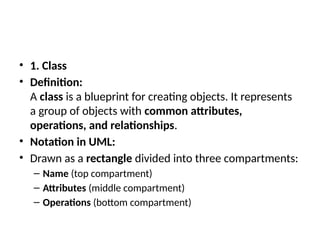
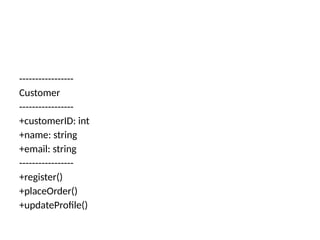
• 1. Class
•Definition:
A class is a blueprint for creating objects. It represents
a group of objects with common attributes,
operations, and relationships.
• Notation in UML:
• Drawn as a rectangle divided into three compartments:
– Name (top compartment)
– Attributes (middle compartment)
– Operations (bottom compartment)
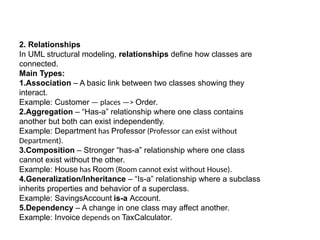
2. Relationships
In UMLstructural modeling, relationships define how classes are
connected.
Main Types:
1.Association – A basic link between two classes showing they
interact.
Example: Customer — places —> Order.
2.Aggregation – “Has-a” relationship where one class contains
another but both can exist independently.
Example: Department has Professor (Professor can exist without
Department).
3.Composition – Stronger “has-a” relationship where one class
cannot exist without the other.
Example: House has Room (Room cannot exist without House).
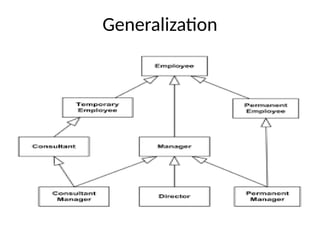
4.Generalization/Inheritance – “Is-a” relationship where a subclass
inherits properties and behavior of a superclass.
Example: SavingsAccount is-a Account.
5.Dependency – A change in one class may affect another.
Example: Invoice depends on TaxCalculator.
20.
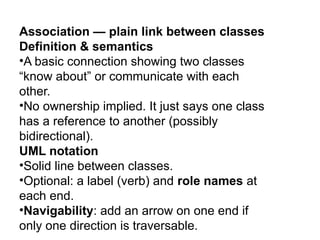
Association — plainlink between classes
Definition & semantics
•A basic connection showing two classes
“know about” or communicate with each
other.
•No ownership implied. It just says one class
has a reference to another (possibly
bidirectional).
UML notation
•Solid line between classes.
•Optional: a label (verb) and role names at
each end.
•Navigability: add an arrow on one end if
only one direction is traversable.
21.
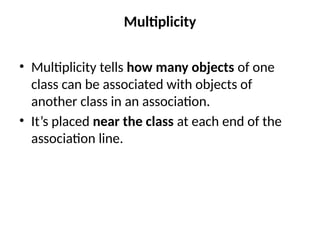
Multiplicity
• Multiplicity tellshow many objects of one
class can be associated with objects of
another class in an association.
• It’s placed near the class at each end of the
association line.
22.
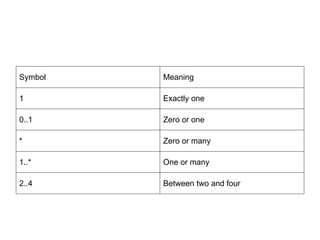
Symbol Meaning
1 Exactlyone
0..1 Zero or one
* Zero or many
1..* One or many
2..4 Between two and four
23.
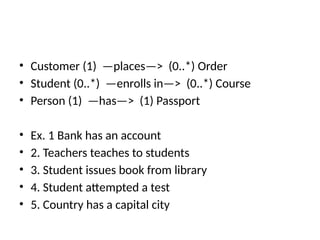
• Customer (1)—places—> (0..*) Order
• Student (0..*) —enrolls in—> (0..*) Course
• Person (1) —has—> (1) Passport
• Ex. 1 Bank has an account
• 2. Teachers teaches to students
• 3. Student issues book from library
• 4. Student attempted a test
• 5. Country has a capital city
24.
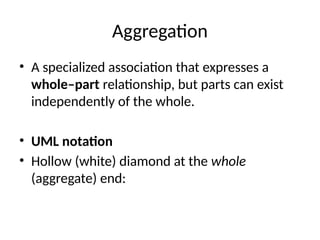
Aggregation
• A specializedassociation that expresses a
whole–part relationship, but parts can exist
independently of the whole.
• UML notation
• Hollow (white) diamond at the whole
(aggregate) end:
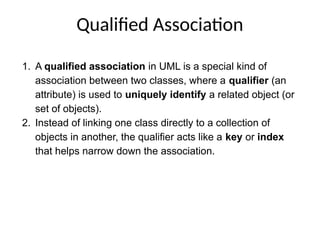
Qualified Association
1. Aqualified association in UML is a special kind of
association between two classes, where a qualifier (an
attribute) is used to uniquely identify a related object (or
set of objects).
2. Instead of linking one class directly to a collection of
objects in another, the qualifier acts like a key or index
that helps narrow down the association.
27.
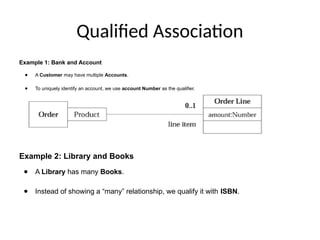
Qualified Association
Example 1:Bank and Account
● A Customer may have multiple Accounts.
● To uniquely identify an account, we use account Number as the qualifier.
Example 2: Library and Books
● A Library has many Books.
● Instead of showing a “many” relationship, we qualify it with ISBN.
28.
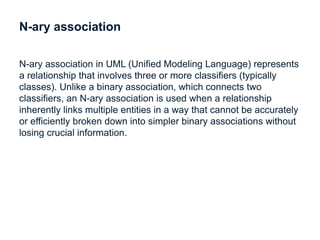
N-ary association
N-ary associationin UML (Unified Modeling Language) represents
a relationship that involves three or more classifiers (typically
classes). Unlike a binary association, which connects two
classifiers, an N-ary association is used when a relationship
inherently links multiple entities in a way that cannot be accurately
or efficiently broken down into simpler binary associations without
losing crucial information.
29.
N-ary Association inUML
● In UML, most associations are binary (between two classes).
● But sometimes, a relationship naturally involves more than two classes → that’s an n-ary
association.
● It’s shown as a diamond (rhombus) connected by lines to the participating classes.
● The diamond is labeled with the association name, and multiplicities can be shown at each end.
Ex. Employee works on project given by company
Ex. Student has taken the course for a semester
Ex Customer has an account in a branch
32.
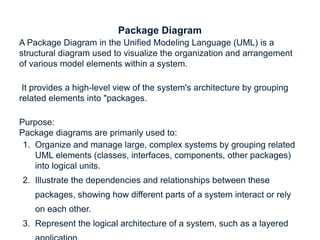
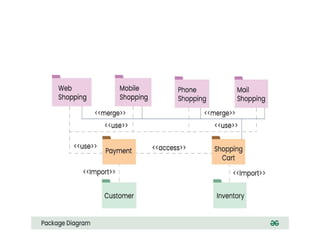
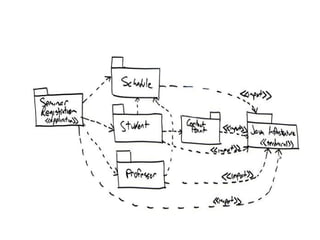
Package Diagram
A PackageDiagram in the Unified Modeling Language (UML) is a
structural diagram used to visualize the organization and arrangement
of various model elements within a system.
It provides a high-level view of the system's architecture by grouping
related elements into "packages.
Purpose:
Package diagrams are primarily used to:
1. Organize and manage large, complex systems by grouping related
UML elements (classes, interfaces, components, other packages)
into logical units.
2. Illustrate the dependencies and relationships between these
packages, showing how different parts of a system interact or rely
on each other.
3. Represent the logical architecture of a system, such as a layered
35.
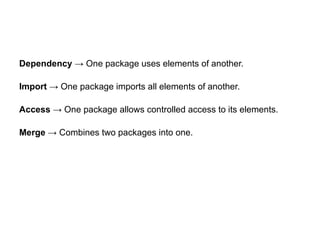
Dependency → Onepackage uses elements of another.
Import → One package imports all elements of another.
Access → One package allows controlled access to its elements.
Merge → Combines two packages into one.
36.
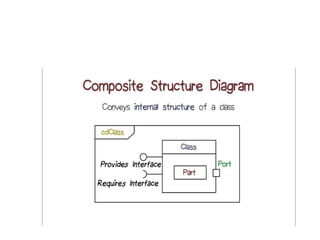
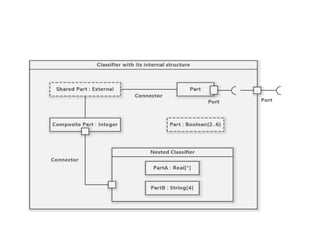
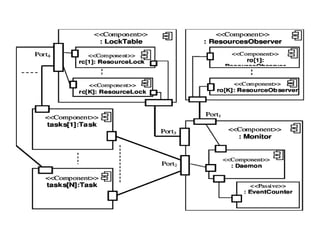
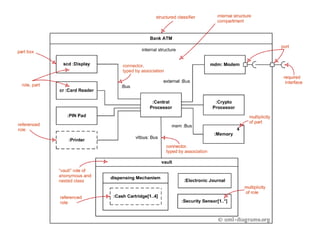
Composite Structure Diagram
AComposite Structure Diagram is a UML structural diagram that
shows the internal structure of a classifier (like a class, component, or
collaboration) and how its parts interact to achieve some functionality.
It focuses on the runtime decomposition of a system into interconnected
parts.
37.
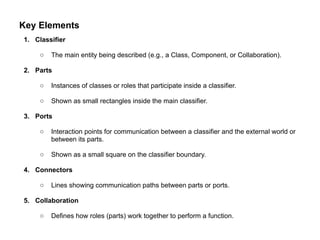
Key Elements
1. Classifier
○The main entity being described (e.g., a Class, Component, or Collaboration).
2. Parts
○ Instances of classes or roles that participate inside a classifier.
○ Shown as small rectangles inside the main classifier.
3. Ports
○ Interaction points for communication between a classifier and the external world or
between its parts.
○ Shown as a small square on the classifier boundary.
4. Connectors
○ Lines showing communication paths between parts or ports.
5. Collaboration
○ Defines how roles (parts) work together to perform a function.
42.
Purpose of CompositeStructure Diagram
● Shows the internal working of a complex classifier.
● Useful for component-based design and service-oriented
architectures.
● Explains how objects collaborate at runtime inside a system.
● Provides more detail than a class diagram, which only shows static
structure.