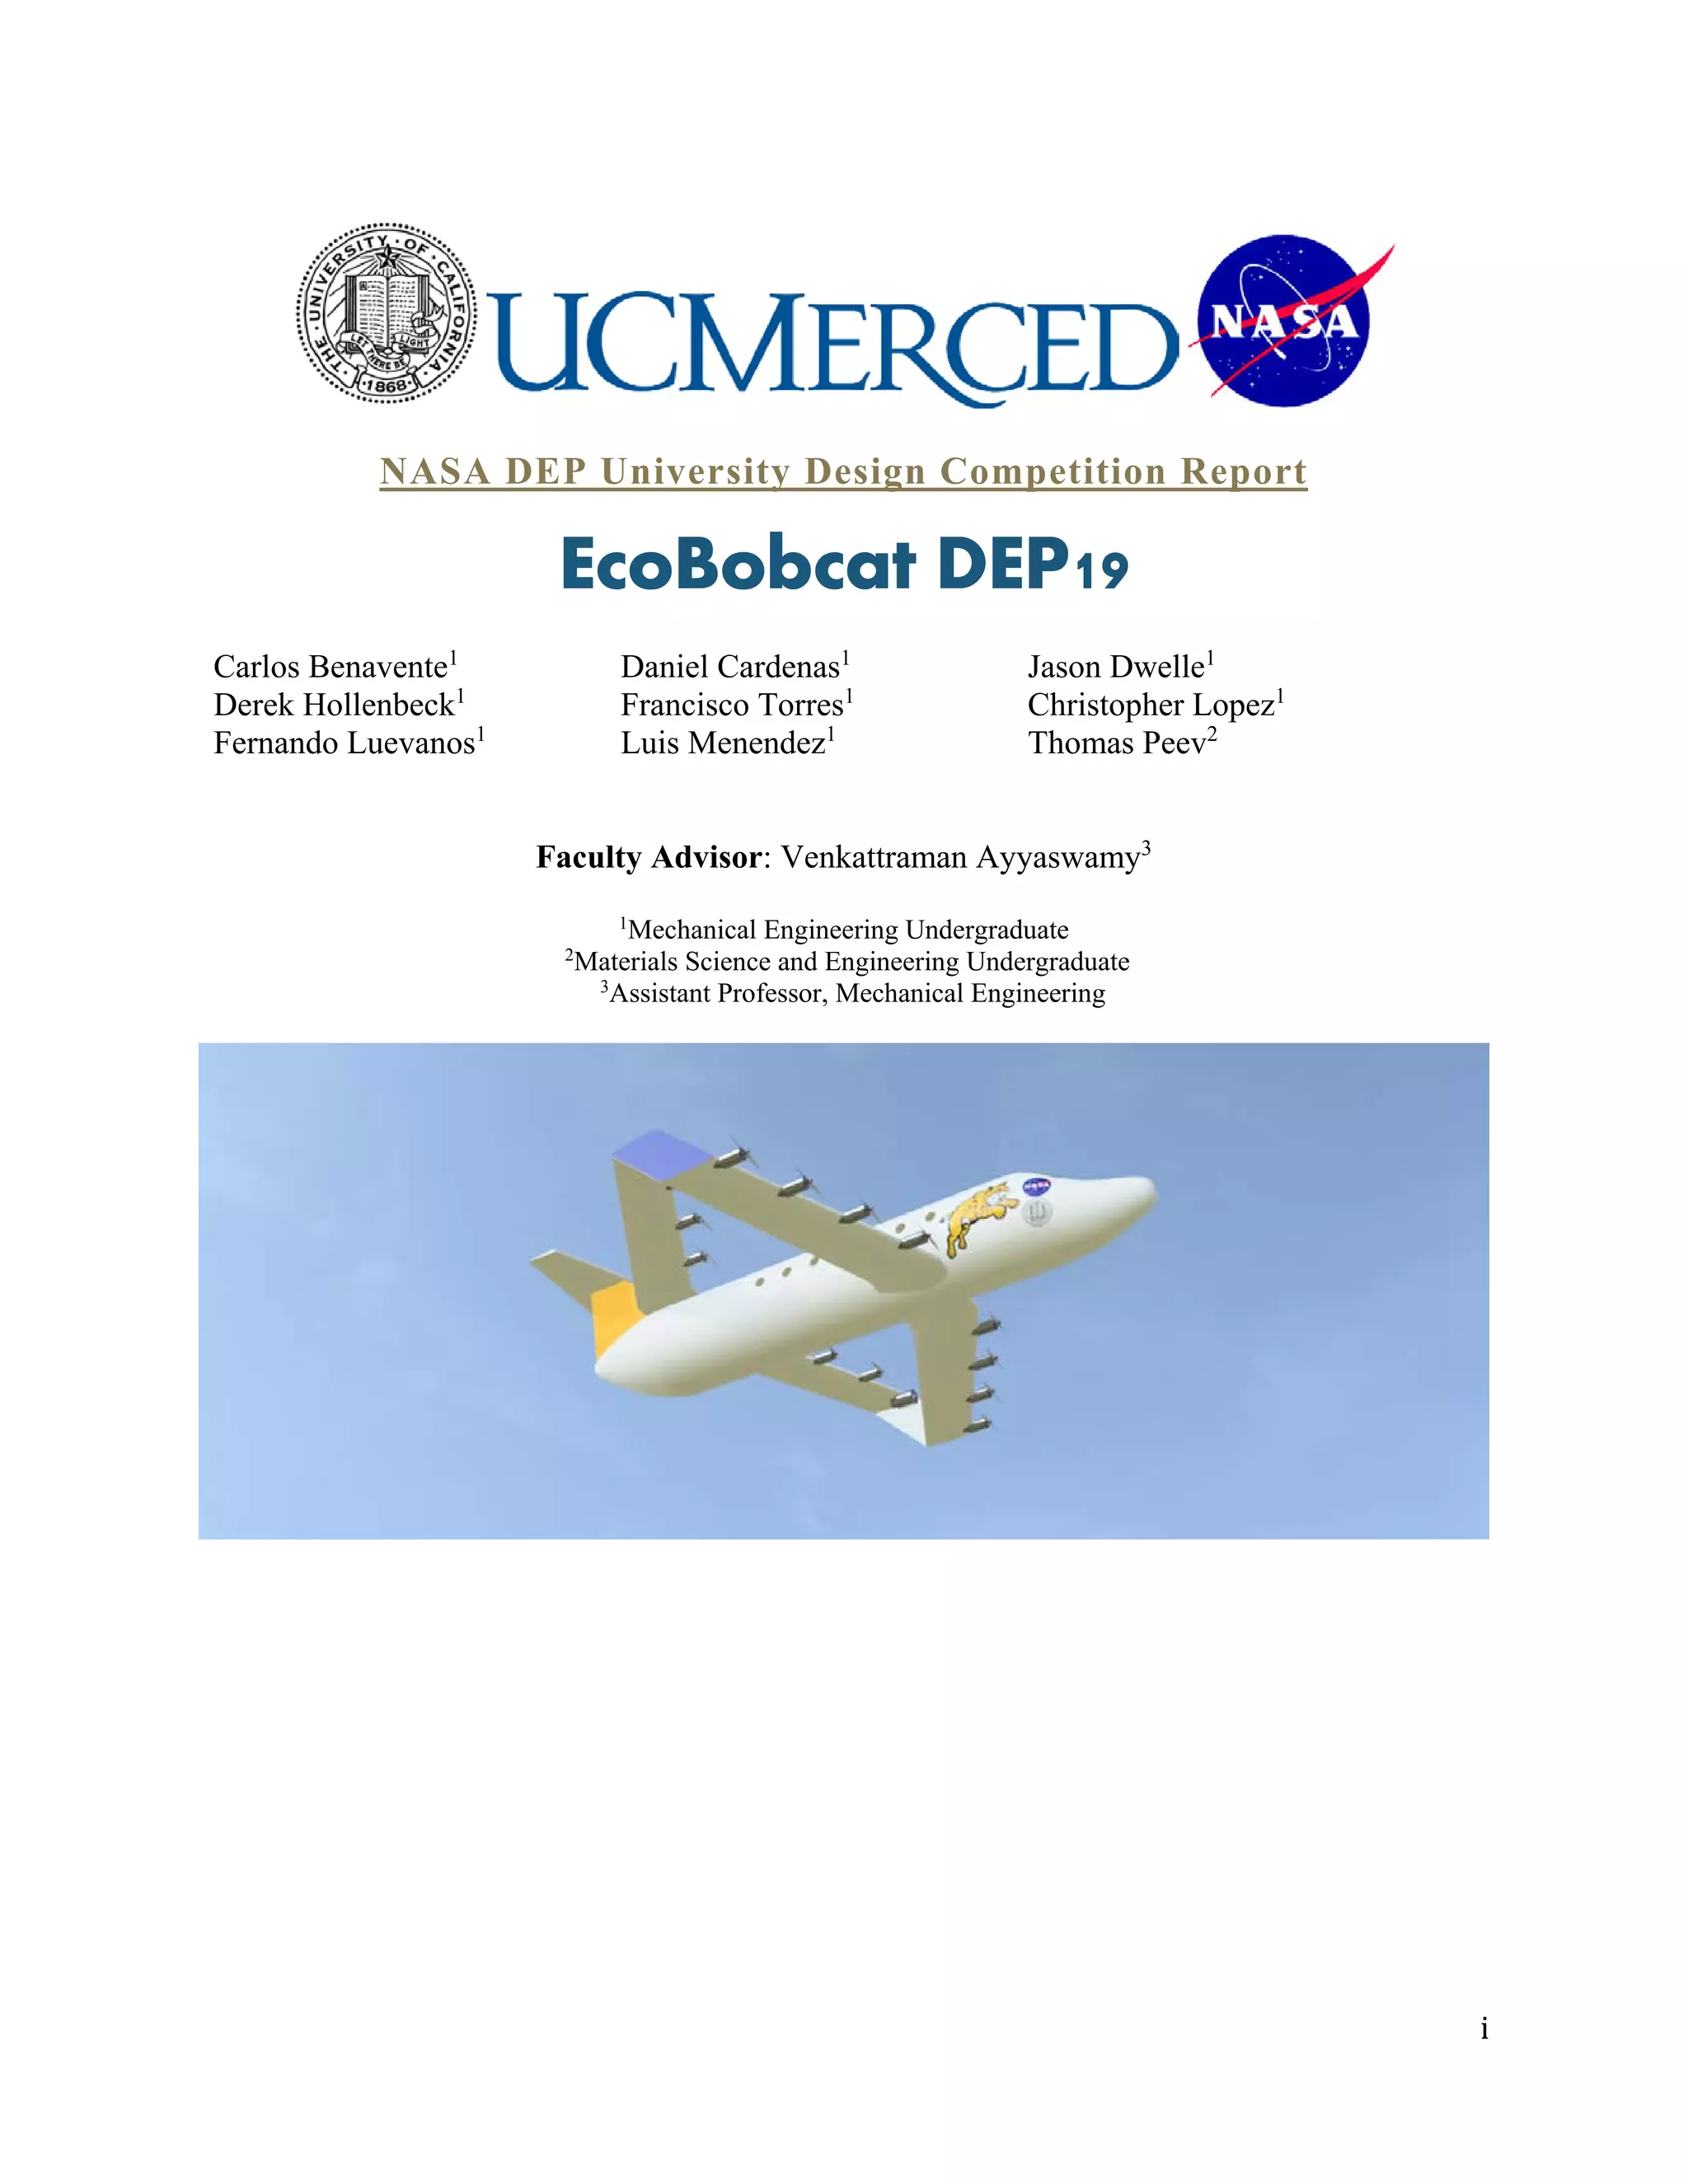
This report summarizes the preliminary design of the EcoBobcat DEP19 aircraft, which uses distributed electric propulsion (DEP) with 14 propellers powered by turbo-electric generators. The design team selected epoxy sheet molding compound (carbon fiber) as the primary material. An estimated empty weight of 3,200 kg was calculated based on comparable aircraft. A novel "looped-back wing" concept is proposed, with the main wing looping back to attach near the tail, powered by superconducting motors. Performance analysis shows the aircraft meets all competition requirements with a range over 3,500 km, endurance over 8 hours, and a climb rate of 513 m/min. Structural analysis confirmed the wing can

![1
Introduction
With the rapid increase in the number of airplanes that currently decorate the sky, there is a
growing concern on the harmful effects they have on our environment. Of all the concerns, the
harmful effects of NOx emissions [1, 2] are one of the most significant and there are several efforts
underway to reduce emissions using more efficient engines, alternate fuels [3] and better air traffic
management [4]. In this regard, electric aircraft present an attractive zero-emission option while
the aircraft is in operation. While the energy production itself will still produce emissions if the
source is non-renewable (such as producing electricity by burning coal), this can be controlled and
being able to operate electric aircraft will certainly go a long way in decreasing the effects of
harmful emissions. Apart from the obvious green effect of electric aircraft, there are less obvious
advantages that such technology can lead to. Specifically, electric aircraft technology can lead to
paradigm shifts in the way airplanes are designed and one such alternative design strategy is the
concept of Distribution Electric Propulsion (DEP) [5, 6]. As an example, NASA researchers have
proposed a DEP concept referred to as Leading Edge Asynchronous Propellers Technology
(LEAPTech) [6] that has been an active area of research over the past few years. The DEP concept
provides the freedom to locate a large number propellers (that are driven by small motors) at
strategic locations on the wing to lead to other performance enhancements. For example, the
LEAPTech aircraft uses propellers that blow the wing during take-off and landing thereby
increasing the dynamic pressure over the wings and lowering the stall speed. While other high-lift
and flow control strategies can lead to a similar enhancement in take-off and landing performance,
the DEP concept leads to other multi-disciplinary advantages resulting in a synergy between
aerodynamics and propulsion. In spite of the attractive features of DEP, it is still a futuristic
concept and requires careful analysis before commercial passenger aircraft using this technology
are flown. Even the LEAPTech aircraft that NASA researchers have been studying is a four-seater
aircraft. In this regard, the primary goal of the current design competition is to explore the benefits
of using DEP on a typical commercial aircraft by proposing a complete on-paper design. Apart
from the design, we also present performance analysis to demonstrate the feasibility of a
commercial DEP aircraft.
Design Strategy
The overall design of the proposed aircraft (named EcoBobcat DEP19 to account for its eco-
friendly nature as well as emphasize the connection with the mascot of the University of California
Merced) was broken into three main categories: preliminary, critical, and overall design. This was
done to showcase the design process and final design selections based off the competition design
and mission requirements. As part of the NASA ARMD challenge, several design constraints are
required to be satisfied by the proposed design and are briefly summarized below. The mission
requirements included a 19 passenger seating capacity with 31-inch seat pitch, cruise speed of 250
mph, service ceiling of 28,000 ft, takeoff & landing field length of 3000 ft at maximum takeoff
weight at standard atmospheric conditions, Also included was the ability to fly in all weather
(including icing conditions) with a structural design criteria of +2.5/-1.0 g loading and safety factor
of 1.5. There is also a requirement to maintain a fuel reserve requirement as per the Federal
Aviation Regulations (FAR) under Instrument Flight Regulation (IFR) conditions. This fuel
requirement says that we must carry enough reserve such that
1. Complete the flight to the first airport of intended landing;
2. Fly from that airport to the alternate airport;](https://image.slidesharecdn.com/d9198c13-0cfc-4067-a09b-62230bca6066-161202063429/85/UCMerced_Benavente-4-320.jpg)
![2
3. Fly after that for 45 minutes at normal cruising speed
It will be shown that our aircraft can satisfies all of these requirements.
Preliminary Design
In the preliminary design we looked at the main design requirements and goals to evaluate
conceptual design platforms based on figures of merit (FOM). The essential parameters need of
the aircraft were determined first then were compared with already available aircraft. The first
step in our aircraft design process [7] was the data collection step which allows the choice of a
starting point for the design. For example, even though every aircraft in the Boeing or Airbus series
has its own unique features, the similarities in them cannot be discounted. The criteria used to
determine the conceptual design were based on flight parameters, cost of the system, and
uniqueness of the platform.
• Mission Requirements – The main parameters looked at were number of passengers,
cruise speed, range, and service ceiling. All aircraft looked at meet initial design
requirements
• Cost – The average aircraft cost was used to determine the most economical choice.
• Uniqueness – As a design challenge we wanted to include a uniqueness factor for selection
as we wanted to contribute an innovative solution to the design problem. In fact, we
present a novel wing concept which we believe is a strength of our design.
A list of aircraft was gathered and compiled into Table 1 and carefully chosen based on the criteria
mentioned above. While most parameters were determined from Jane’s All the World Aircraft [8],
some parameters were not available and are not included in the table. Once the preliminary list of
similar aircraft was compiled, we short-listed three aircraft from this table to design the EcoBobcat
DEP19. The three short-listed aircraft included the BAE Jetstream 31, Dornier Do 228 and
Beechcraft 1900. The design team then performed a figure-of-merit analysis for the short-listed
aircraft based on three quantities including mission requirements (60% weightage), cost (20%
weightage) and uniqueness (20% weightage). The team assigned points for each figure-of-merit
quantity to determine an overall score for each of the three aircraft. Based on Table 1 and the
findings of Table 2, the team found that the best platform to work from is the Beechcraft 1900. In
other words, the conceptual design will be based off the Beechcraft 1900’s bottom wing, T-tail
configurations with the tricycle landing gear. However, as will be clear in subsequent sections, we
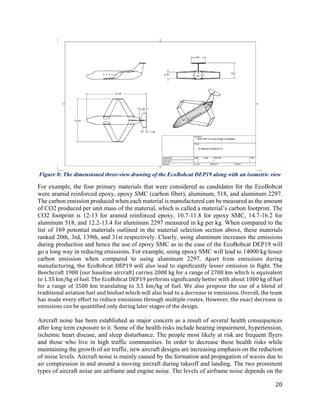
used a novel wing design wherein the regular wings are connected back to the fuselage (at a
location near the tail) through an auxiliary wing. We refer to this concept as a loop-back wing.
Table 1: Summary of preliminary data collection of various aircraft with comparable mission
requirements
Beechcraft
1900
L-
410
Do 228 EMB
110
SC.7
Skyvan
An-
28
B.A
Jetstre
am
Gulfstrea
m IV
Dassault
Falcon
7X
Passengers/
Crew
19/2 19/ 19/2 18/2 19/2 18/2 19/2 19/2 19/3
Length (m) 17.62 14.4 16.56 15.1 12.21 12.98 14.37 27.2 23.38
Wingspan
(m)
17.64 19.5 16.97 15.33 19.78 22.00 15.85 23.7 26.21
Height (m) 4.72 5.83 4.86 4.92 4.6 4.6 5.32 7.67 7.93](https://image.slidesharecdn.com/d9198c13-0cfc-4067-a09b-62230bca6066-161202063429/85/UCMerced_Benavente-5-320.jpg)
![3
Empty
weight (kg)
4732 3985 3739 3393 3331 3900 4360 19700 15465
Max.
weight (kg)
7764 6400 6400 5900 5670 6100 6950 32200 31750
Max Speed
(km/h)
413 325 355 488 935 953
Cruise
Speed
(km/h)
518 (at
20000 ft)
365 352 341 317 335 426 850 900
Range (km) 2700 1380 1111 1964 1117 510 1260 8060 11000
Service
Ceiling (m)
7620 6320 8500 6550 6858 6000 7620 13700 15500
Rate of
climb (m/s)
13.28 7.4 7.5 8.3 8.33 12.0 10.6
Wing
loading
(kg/m2
)
136.6 146 276 435
Power/mass
(kW/kg)
0.250 0.201
Material Selection
Determination of the material used for the aircraft body crucial for all other performance
parameters. The properties of the material determine the ceiling service altitude, the maximum
speed, and the weight of the aircraft. Materials used in the aerospace industry include aluminum
alloys, titanium alloys, as well as other composite materials. Other materials previously used
include steel alloys and wood. Based on a literature survey, the materials considered as candidates
included Al 2024-T3, Al 3003-H14, Al 5052-H32, Al 6061-T6, Al 7075, and Ti6Al4V (Grade 5).
Table 3 below summarizes the properties of these materials. We are interested in materials with
high stiffness, high strength, high toughness, and low density. These figures of merit were used to
determine materials with comparable or superior material properties. Using a well-established
materials database (CES Edupack) [9], 169 potential materials were ranked based on their density,
strength as well as CO2 footprint. The four short-listed materials were determined to be
Epoxy/aramid fiber UD composite, Epoxy SMC (carbon fiber), Al 518.0 F, and Al 2297-T87. It
should be noted that the first two selections are composite materials, while the Al alloys are
metallic. It is worth mentioning that aircraft are traditionally not manufactured using a single
material, but comprises of a selection of different materials, each specialized for their application.
Also, current aircraft (including Boeing 787) are not exclusively built out of composites, and the
high cost is not the only reason for that. It is also difficult to recycle composite materials compared
to aluminum alloys. Replacing aluminum parts in planes with carbon fiber parts can reduce the
overall weight of the plane by up to 20%. For example, the Boeing 787 is modeled closely after
the Boeing 747, but the Boeing 787 is significantly lighter (by about 20%) since it includes
advanced composites in its construction. Due to the weight reduction, the Boeing 787 Dreamliner
model is said to be more fuel efficient than other aircraft of similar size. Carbon fiber is more
expensive than aluminum due to the molding process required (also included in our cost analysis
by doubling the values obtained for aluminum), but this may also be beneficial in the long run. By
using carbon fiber, aircraft can be molded in fewer pieces. As an example, the wings can be molded
with the fuselage thus making it more aerodynamic. This could be advantageous because of the
use of fewer parts such as fasteners and adhesives. Another benefit of the carbon fiber is that the
material is more durable and would require less maintenance. Aluminum airplanes often need to](https://image.slidesharecdn.com/d9198c13-0cfc-4067-a09b-62230bca6066-161202063429/85/UCMerced_Benavente-6-320.jpg)
![4
be maintained to avoid corrosion, but carbon fiber planes would require very little maintenance.
While carbon fiber is a great material, there was one major problem with it. When struck by
lightning, carbon fiber is completely shredded. In order to avoid such problem, small strands of
metal are woven into the material to decrease the damage caused by lightning. Based on all these
considerations, the team finalized that the structural support and parts of the plane skin should be
made out of Epoxy SMC (carbon fiber), which is lightweight, strong, and has a low carbon
footprint during its production.
Figure 1: Images of BAE Jetstream, Dornier Do 228 and Beechcraft 1900 - our baseline aircraft
Table 2: Summary of figure-of-merit analysis used to determine the short-list of baseline aircraft
BAE Jetstream 31 Dornier Do 228 Beechcraft 1900
Mission (60%) 5 4 7
Cost (20%) 10 5 7
Uniqueness (20%) 5 5 5
Total 6 4.4 6.6
Preliminary Empty Weight
In order to estimate the preliminary empty weight [10] of the EcoBobcat DEP19, we go back to
our survey of comparable aircraft. Among the three short-listed aircraft empty weights, the Dornier
Do 228 has the minimum empty weight and the Beechcraft has the maximum empty weight. We
start-off with an empty weight of 4300 kg which is between the values of Do 228 and Beechcraft
and incidentally agrees with the empty weight of the Jetstream 31. However, we anticipate a 20%
savings (based on data from weight savings of Boeing 787) since the proposed aircraft will be
manufactured using lightweight composite technology. This results in an empty weight of 3440
kg. However, it should be noted that this includes the engine weight and might be different for the
EcoBobcat DEP19. Specifically, as discussed in detail in a subsequent section, the proposed
aircraft will utilize two turbo-electric generators that will drive the DEP propellers distributed on
the wing. The propeller weight will be added to the empty weight discussed above. The dry engine
weight of the Beechcraft 1900 is about 240 kg (corresponding to two Pratt and Whitney Canada
PT6 turboprop engines). Therefore the empty weight of the engine-less EcoBobcat DEP19 is
estimated at 3200 kg. Assuming that the propulsion system will account for about 25% of the
overall gross maximum take-off weight, and including payload at 21 people (19 passengers + 2
crew) with each person weighing 225 lb (NASA recommendation), the estimated total maximum
take-off weight of the aircraft is obtained as 7101 kg corresponding to about 70 kN. The payload
accounts for 2126.25 kg. Our estimations allow 1775.75 kg for the propulsion system and fuel
which should be verified and updated while designing the turbo-electric generators, propellers and
the motors that drive the propellers.](https://image.slidesharecdn.com/d9198c13-0cfc-4067-a09b-62230bca6066-161202063429/85/UCMerced_Benavente-7-320.jpg)
![5
Table 3: Summary of properties of materials that are commonly used in existing aircraft - All data from
EduPack 2015
Aerodynamic Design
Once the material selection was completed, the team next focused on finalizing the aerodynamic
design which includes airfoil selection, wing and tail design. While it could be argued that the
extensive analysis on improving aerodynamic designs over the past several decades limits our
ability to make significant improvements in existing efficiencies, the team performed some
aerodynamic analyses to try to come up with a novel and yet efficient aerodynamic design which
is discussed below. Also, use of the DEP concept is anticipated to lead to significant improvements
in the aerodynamic characteristics as a result of the blowing effect it provides to the wings [6].
This will be accounted for in our design.
Airfoil Selection
For the airfoil selection of the design process we focused on the airfoils typically used by aircraft
of similar size and flight parameters. We considered the root and tip airfoils used by BAE Jetstream
31, Beechcraft 1900, and Gulfstream IV. The final airfoil was selected based on several parameters
including maximum lift coefficient, lift to drag ratio, and the pitching moment coefficient at cruise
and take-off. The team finalized the use of a NACA 23018 as the root airfoil and a NACA 23012
as the tip airfoil. The reasoning for using two different airfoils is to generate higher amounts of lift
at the root of the wing to reduce the structural stress from the high lift at the wing tips. The NACA
airfoils are all similar but have some key differences. In particular, the four-digit number at the
end of the NACA airfoils defines the shape of the airfoil. The first two digits characterize the
camber and the last two digits define the thickness of the airfoil as a percentage of the chord length.
The aerodynamic characteristics of the chosen airfoils and their dependence on the angle of attack
were obtained using the well-established XFLR5 software [11]. XFLR5 uses a panel method to
solve for flow past the given airfoil to obtain the performance coefficients (lift coefficient, drag
coefficient and moment coefficient) as a function of angle of attack. While XFLR5 can perform
both inviscid and viscous analysis, we included viscosity in all our analyses to capture airfoil stall
and hence obtain the maximum lift coefficient.
Figure 2 shows the variation of lift coefficient (Cl), drag coefficient (Cd) and lift-to-drag ratio as
a function of angle of attack. The lift coefficient reaches a maximum of about 1.8 beyond which
the airfoil stalls leading to a decrease in lift coefficient. The stall angle was determined to be about
160
. The maximum lift-to-drag ratio was obtained as 150 at an angle of attack of about 80
.
However, the lift-to-drag ratio (L/D) for the entire aircraft is likely to be significantly lower. For
example, an existing comparable aircraft (Beechcraft) has a cruise L/D of about 13.](https://image.slidesharecdn.com/d9198c13-0cfc-4067-a09b-62230bca6066-161202063429/85/UCMerced_Benavente-8-320.jpg)
![7
Figure 2: Aerodynamic characteristics of the NACA 23018 and NACA 23012 at take-off and cruise
conditions. The NACA 23018 and NACA 23012 are used as the root and tip airfoils in EcoBobcat DEP19.
Propulsion System Design
The EcoBobcat DEP19 will utilize the DEP concept not only to enhance the aerodynamic
characteristics but also to produce thrust. The DEP system on the proposed aircraft includes a
turbo-electric generator that will produce turbine power through traditional combustion. This
turbine power will be transmitted to the propellers that are distributed along the wing. The
transmission will be performed electrically (rather than mechanically) using superconducting
motors [12, 13] and power lines. The rapid growth in superconducting electrical machines allows
us to achieve this electrical transmission with a negligible weight penalty. The design
specifications of each of these components is described in detail below.
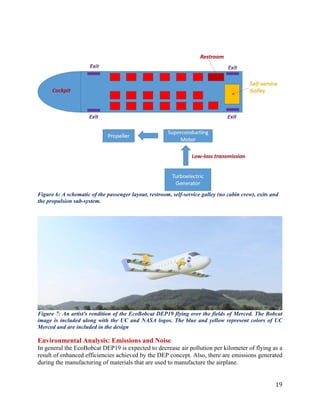
Propeller Design
In an aircraft propelled by DEP, a large number of relatively small propellers (as opposed to two
larger propellers) are distributed along the wing to produce thrust apart from aerodynamic
enhancement of the wing. The design of each propeller includes choice of diameter, number of
blades, pitch, and material. For the DEP concept, one must also specify the exact locations of these
propellers on the wing (seen clearly in the artist’s rendition). We propose to utilize propellers with
a diameter of 50 in. which translates to 1.27 m. Our design is also based on distributing a total of
14 propellers in total. The front wing will have 8 propellers (4 on each side) and the loop-back will
have 6 propellers (3 on each side). The relatively small number of propellers on each side provides
us with the maximum freedom in terms of their locations. Each propeller is then required to](https://image.slidesharecdn.com/d9198c13-0cfc-4067-a09b-62230bca6066-161202063429/85/UCMerced_Benavente-10-320.jpg)
![8
produce a thrust of 0.3 kN or 300 N (during cruise) and 1.5 kN during take-off and climb. The
momentum theory (actuator disk theory) was then used to determine the power requirements for
driving each propeller. It should be mentioned that a similar analysis was used to perform
preliminary design of propellers of the LEAPTech [6]. The momentum theory in spite of involving
approximations is an extremely useful technique for preliminary design of propellers.
The momentum theory expresses the velocity far downstream of the propeller (Ve) in terms of the
freestream velocity (V0) and thrust loading Tc as
𝑉𝑉𝑒𝑒 = 𝑉𝑉0�1 + 𝑇𝑇𝑐𝑐
where Tc is a non-dimensional thrust defined as
𝑇𝑇𝑐𝑐 =
2𝑇𝑇
𝜌𝜌𝑉𝑉0
2
𝐴𝐴𝑝𝑝
With Ap being the propeller area. The velocity at the propeller disk location (Vd) is the average of
Ve and V0 and therefore in terms of Tc is given by
𝑉𝑉𝑑𝑑 =
𝑉𝑉0(1 + �1 + 𝑇𝑇𝑐𝑐)
2
The total power required to drive the propeller is then obtained as
𝑃𝑃 =
1
4
𝑇𝑇𝑐𝑐 𝜌𝜌𝑉𝑉0
2
𝐴𝐴𝑝𝑝 𝑉𝑉0(1 + �1 + 𝑇𝑇𝑐𝑐)
Utilizing these equations for the propellers of the EcoBobcat DEP19, the value of Tc is given by
0.0635. The power requirement is then given by 37.47 kW for one propeller and adds to about
524.6 kW for all 14 propellers. Assuming an efficiency of 0.8 for the propeller, the turbo-electric
generator should produce a power of about 670 kW. The design of the turbo-electric generator
will be discussed in a subsequent section.
Also, the proposed propeller design uses a two-blade configuration. Ideally, the propeller diameter
should be as large as possible since it can provide momentum to a larger volume of air thereby
resulting in higher thrust. However, the tip speed of the propeller which is proportional to the
radius as well as the angular speed should not be too high. Specifically, a common rule of thumb
is to ensure that the tip Mach number does not exceed 0.85 or so. The more compressible the flow
is near the propeller tip, the more noise it generates making it more uncomfortable for the pilot
and passengers. The advance ratio J given by
𝐽𝐽 =
𝑉𝑉
𝑛𝑛𝑛𝑛
where V is the freestream velocity, n is the revolutions per second and D is the propeller diameter
plays a major role in determining the efficiency of the propeller. A propeller diameter of 50 inches
(1.27 m) and an angular speed of 16.67 revolutions per second (corresponding to 1000 rpm)](https://image.slidesharecdn.com/d9198c13-0cfc-4067-a09b-62230bca6066-161202063429/85/UCMerced_Benavente-11-320.jpg)
![9
ensures that J is about 0.9245 for a cruise speed of 123 m/s. The tip speed of the propeller is only
133 m/s (corresponding to a Mach number of about 0.5) thereby preventing supersonic flow near
the tip. The noise levels are also anticipated to be sufficiently low to ensure passenger comfort in
the cabin. Both fixed-pitch and constant-speed (variable pitch) propellers were considered as
options. While constant-speed propellers have the ability to control the blade pitch to ensure
maximum efficiency at various operating conditions, they come with the disadvantage of weighing
more than fixed-pitch propellers. We decided to choose a fixed-pitch propeller with the blade angle
of about 20 degrees which would ensure peak efficiency for the propeller for an advance ratio of
about 0.9245. To summarize, the proposed two-blade propeller of Eco-Bobcat DEP19 has a
diameter (d) of 50 inches with a pitch of about 20 degrees and will be made of carbon fiber
composites which in conjunction with the turbo-electric generator should produce sufficient
thrust to meet the desired aircraft requirements. The advance ratio values encountered will
ensure that the propeller efficiencies can be assumed to be about 80% at cruise and about 60%
during take-off based on curves from McCormick [14] as shown in Figure 3. While a more careful
optimization procedure should likely be adopted at later stages of the design, we conclude that this
is a good representative propeller for the Eco-Bobcat DEP19. The mass of each propeller is
estimated as 5 kg totaling 70 kg for all propellers.
Figure 3: Variation of efficiency as a function of advance ratio for various blade angles. Figure
reproduced from McCormick
Turbo-electric Generator
The power requirement quantified above will be met using two turbo-electric generators mounted
near the tip region of the wings (see exact location in the artist’s rendition). This section will
therefore present the sizing and analysis of the turbo-electric generators. The current design
proposes the use of generators that are very similar to traditional gas turbine engines. The turbo-
electric generator will take in a certain mass of air (depending on the inlet area) which will then
be slowed down in a diffuser before being compressed to higher pressures. The high pressure air
enters the combustion chamber where fuel is added and the exothermic combustion process
increases the temperature. The high pressure, high temperature exhaust then drives a high-pressure
turbine that is matched with the compressor. In other words, the compressor is driven using the
power generated by the high pressure turbine. The gas then enters the low pressure turbine which
produces power to drive all propellers of the DEP system before being exhausted through the
nozzle. It should be mentioned that the nozzle will also produce a small amount of thrust but the](https://image.slidesharecdn.com/d9198c13-0cfc-4067-a09b-62230bca6066-161202063429/85/UCMerced_Benavente-12-320.jpg)
![10
generator is designed in such a way that most of the energy is used to drive the propellers. This is
achieved by choosing the power split ratio (ratio of propeller power to total power available when
the gas exits the high pressure turbine) to be 0.96. A standard black-box analysis [15] of the engine
is performed by assuming state-of-the-art efficiencies and parameters for the diffuser, compressor,
combustion chamber, turbine and nozzle with the design discussed below.
The inlet are of the engine was chosen as 0.5 m which was suitable for an air mass flow rate of 2
kg/s. The ratio of specific heat was taken as 1.4 and the specific gas constant as 287 J/kg/K. The
engine diffuser slows down the air adiabatically (isentropic flow is not possible due to friction and
mild flow separation losses). While the shaping of the diffuser is beyond the scope of this system-
level analysis, we assume a stagnation pressure loss of 0.8. The flow then enters the compressor
with a pressure ratio of 10 and a polytropic efficiency of 0.90 (a good estimate for compressor
flow). The compressor exit leads to the burner/combustion chamber and a burning efficiency of
0.99 along with a stagnation pressure loss (across the combustion chamber) of 0.975 was assumed.
The flow exiting the combustor enters the high pressure turbine that runs the compressor with
polytropic efficiency of 0.85 and a mechanical efficiency (for the shaft connecting the compressor
to the high pressure turbine) of 0.99. Also, it is assumed that the turbine inlet temperature will be
a maximum of 1560 K which is well below the temperature that can be handled by state-of-the-art
materials. The exit of the high pressure turbine leads to the low pressure turbine with polytropic
efficiency of 0.88. The low pressure turbine will produce the power that will drive all propellors
and should therefore be able to generate about 1.3 MW during take-off. To reiterate 96% of the
power available in the flow at the point of exiting the high pressure turbine will be extracted in the
low pressure turbine and the remaining will be extracted through the nozzle. The remainder will
be exhausted through the nozzle (efficiency of 0.95) and will produce a small thrust but is not
accounted for in our design and will remain excess thrust (a buffer for possible errors due to
approximations performed during the design). If more power is extracted by low pressure turbine,
the nozzle will start producing a drag. The fuel will be a 50% blend of standard aviation fuel and
biodiesel. Such a blend has been shown to lead to significant decrease in emissions.
We now present a summary of our calculations for the turbo-electric generator performance at
cruise and take-off. At cruise, the freestream temperature and pressure (from International
Standard Atmosphere) are given by pa = 32932.4 Pa and Ta = 233 K respectively. The flow is
assumed to be slowed down isentropically to determine the inlet conditions. The stagnation
pressure and stagnation temperature at the exit of diffuser (entrance to compressor) are obtained
as
𝑝𝑝02 = 𝑝𝑝𝑎𝑎 �1 +
𝛾𝛾 − 1
2
𝑀𝑀𝑎𝑎
2
� 𝜋𝜋𝑑𝑑
𝑇𝑇02 = 𝑇𝑇𝑎𝑎 �1 +
𝛾𝛾 − 1
2
𝑀𝑀𝑎𝑎
2
�
where πd is the stagnation pressure loss across the diffuser and Ma is the freestream Mach number.
We obtain p02 = 33306.51 Pa along with T02 = 240.5 K. It should be noted that the stagnation
temperature remains the same at the inlet and exit of diffuser since flow across the diffusor is
adiabatic but not isentropic. The stagnation pressure increases across the compressor and since the](https://image.slidesharecdn.com/d9198c13-0cfc-4067-a09b-62230bca6066-161202063429/85/UCMerced_Benavente-13-320.jpg)
![12
maximum power (in kW) to mass ratio (in kg) between 3.5 and 4.5. We utilize a conservative value
of 2.6 to estimate the mass of each engine as 270 kg.
The power generated by the low pressure turbine will be transmitted through superconducting
power lines that will drive superconducting motors which in turn will drive the propellers.
Superconducting motors are essentially new types of alternating current (AC) motors that employ
high temperature superconductor (HTS) windings instead of traditional copper coils. Since HTS
wires can carry significantly larger currents than copper wire, these windings are capable of
generating much stronger magnetic fields in a given volume. The choice of superconducting
motors also stems from the fact that they, unlike traditional copper wires, allow power transmission
at much higher efficiencies with very limited loss. An HTS synchronous motor [16] has
considerably reduced losses, yielding significant annual savings in electricity consumption.
Elimination of iron teeth in the stator results in a lightweight motor that boasts quiet and smooth
operation. The compact design of HTS motors will facilitate placement in transportation
applications where space and/or weight is at a premium (such as in aircraft). Superconducting
motors can withstand large transients or oscillatory torques without losing synchronous speed. The
HTS machines do not require rapid field forcing during fast load changes or transients as is often
the case with conventional machines. The smaller size of superconducting motors will also enable
them to be manufactured and shipped directly to the customer without costly disassembly and
subsequent onsite re-assembly and testing. These advantages will reduce delivery lead times and
reduce overhead costs. These attractive traits make superconducting motors particularly suitable
for the EcoBobcat DEP19 that utilizes DEP. Specifically, the power generated in the turbo-electric
generator can be transmitted to various propellers (that could potentially be at distances as large
as 5 m from the turbo-electric generator) without losses. The mass of the superconducting motor
was estimated based on a reasonable estimate of about 15 kW/kg thereby translating to a mass of
200 kg. In summary, the total mass of the propulsion system (excluding fuel) is estimated to
be 820 kg which allows the remaining mass (based on an initial allocation of 1775 kg) of 955
kg for fuel.
Fuselage and Landing Gear Design
For the fuselage, our design team decided to stick to a simple conventional shape. The cabin was
modeled closely after the design of comparable aircraft that also seated 19 passengers and are
considered to have a comfortable layout. The fuselage cross section was chosen to be circular with
a width of 8 ft. The width was chosen based on a 6 ft cabin height and a 2 ft space (under the cabin)
for cargo. The seat layout was chosen as three seats in a row and an additional set in the last row
near the restroom. The seat pitch was chosen as 31 inch as prescribed in the competition
requirements. It should be noted that the cabin internal dimensions are slightly larger than the
Beechcraft 1900. As part of our preliminary design, we also made some initial choices for the
landing gear system. It is a major, but often neglected, component of any aircraft, given that it is
required for takeoff, landing and any movement on ground. Multiple factors are taken into account
when designing landing gears including the aircraft’s weight, center of gravity, take-off angle, and
desired level of ground mobility. The major factors that should be considered include the type of
landing gear, the distance of the front/back wheel(s) from the center of gravity, the expected load
on the gear, and the desired allowable turn angle while the aircraft is on the ground. Since there
was no specific requirement from the competition, we made some preliminary choices for the
landing gear system. The first choice that the team made was regarding the landing gear type. After](https://image.slidesharecdn.com/d9198c13-0cfc-4067-a09b-62230bca6066-161202063429/85/UCMerced_Benavente-15-320.jpg)
![13
looking at multiple airplanes that have a similar scope as our aircraft, the tricycle landing gear was
chosen. The position of the landing gear is governed by several factors including the take-off angle
as the plane leaves the ground and the center of gravity. While taking off, the angle made by the
aircraft with the horizontal should ensure that the rear of the aircraft does not strike the runway. In
addition, the front and rear landing gears need to be located in such a way that the front gear holds
only a small fraction (between 5 to 20 %) of the total aircraft weight. Based on an assumed center
of gravity location, we obtained the location of the front gear to be 0.1667 m and the rear gears to
be 3.02 m from the nose of the aircraft. Taking into account that the average aircraft takes off at
an angle of 10 degrees and by assuming a 15 degree buffer, we obtained a gear height of 1.378 m.
After adding a 30 cm for the ground clearance of the rear of the fuselage, we obtained a gear height
of 1.7 m. We also made some preliminary calculations for the gap between the rear landing gears.
The separation between the landing gears affects the turn angle and assuming a 25 degree turn
angle gives a separation of 1.58 m.
Performance Analysis
We now present a detailed discussion on the performance of the EcoBobcat DEP19 and
demonstrate how it satisfies the design requirements outlined in the NASA competition. Below,
we discuss our approach to determine the performance characteristics summarized above. While
we had the option to use the RDS software that ships with the design book of Raymer [7], we
chose to implement the equations in an in-house MATLAB since we had complete control on the
in-house MATLAB script. Our MATLAB script begins by taking in the motor power, targeted
cruise velocity and the range. The script then performs the take-off and landing analysis based on
the approach described by Raymer [7]. The stall velocity is computed as
𝑉𝑉𝑠𝑠𝑠𝑠𝑠𝑠𝑠𝑠𝑠𝑠 = �
2𝑊𝑊
𝜌𝜌𝜌𝜌𝐶𝐶𝐿𝐿𝐿𝐿𝐿𝐿𝐿𝐿
where S is the wing planform area, 𝜌𝜌 is the air density taken as 1.226 kg/m3
corresponding to
standard atmospheric conditions at sea-level, W is the weight of the airplane, and 𝐶𝐶𝐿𝐿𝐿𝐿𝐿𝐿𝐿𝐿 is the
maximum lift coefficient of our aircraft. While the maximum lift coefficient of our airfoil is around
1.6 (XFLR5 analysis presented earlier), high-lift devices are typically used during take-off to
increase this further. We propose to use trailing-edge flaps for our aircraft and this allows us to
achieve a 𝐶𝐶𝐿𝐿𝐿𝐿𝐿𝐿𝐿𝐿 of about 2.5. Also, the DEP concept helps achieve even higher 𝐶𝐶𝐿𝐿𝐿𝐿𝐿𝐿𝐿𝐿 values.
Therefore, we assume a value of 3.0 for our analysis. The take-off velocity was then determined
as
𝑉𝑉𝑡𝑡𝑡𝑡 = 1.1𝑉𝑉𝑠𝑠𝑠𝑠𝑠𝑠𝑠𝑠𝑠𝑠
The stall velocity for the Eco-Bobcat is 38.11 m/s and the take-off velocity is 41.92 m/s. For
reference, the Beechcraft 1900 has a stall speed of 43 m/s Next, the take-off thrust, lift and drag
coefficient at take-off were calculated as
𝑇𝑇𝑡𝑡𝑡𝑡 =
𝑃𝑃𝑝𝑝 𝜂𝜂𝑡𝑡𝑡𝑡
𝑉𝑉𝑡𝑡𝑡𝑡](https://image.slidesharecdn.com/d9198c13-0cfc-4067-a09b-62230bca6066-161202063429/85/UCMerced_Benavente-16-320.jpg)
![14
𝐶𝐶𝐿𝐿,𝑡𝑡𝑡𝑡 =
2𝑊𝑊
𝜌𝜌𝜌𝜌𝑉𝑉𝑡𝑡𝑡𝑡
2
𝐶𝐶𝐷𝐷,𝑡𝑡𝑡𝑡 = 𝐶𝐶𝐷𝐷𝐷𝐷 + 𝐾𝐾𝐶𝐶𝐿𝐿,𝑡𝑡𝑡𝑡
2
𝐾𝐾 =
1
𝜋𝜋𝜋𝜋𝜋𝜋𝜋𝜋
where 𝑃𝑃𝑝𝑝is the power produced by the superconducting motors and 𝜂𝜂𝑡𝑡𝑡𝑡 is the efficiency of the
propeller during takeoff assumed to be 0.60 which is a reasonable value based on our analysis
presented earlier when sizing the propeller. Also, the superconducting motor is assumed to be
transmitting 1.4 MW during take-off. The lift coefficient equation assumes that the weight of the
aircraft is balanced by the lift. In the above equations, AR is the aspect ratio and e is the Oswald
efficiency factor. The aspect ratio for the Eco-Bobcat DEP19 is 16.11, a little higher than for
similar aircraft but the advances in material science certainly allow current aircraft to be designed
with high values of AR. As suggested by Raymer [7], the take-off analysis is broken into three
sections: ground roll, transition to climb, and climb. The ground roll analysis is essentially a force
balance which is then used to obtain an expression for the acceleration of the airplane. Integrating
this from the initial velocity of zero to the final velocity that is equal to the take-off velocity gives
an expression for the ground roll distance as
𝑆𝑆𝐺𝐺 = �
1
2𝑔𝑔𝐾𝐾𝐴𝐴
� 𝑙𝑙𝑙𝑙 �
𝐾𝐾𝑇𝑇 + 𝐾𝐾𝐴𝐴 𝑉𝑉𝑡𝑡𝑡𝑡𝑡𝑡𝑡𝑡𝑡𝑡𝑡𝑡𝑡𝑡
2
𝐾𝐾𝑇𝑇
�
𝐾𝐾𝑇𝑇 = �
𝑇𝑇
𝑊𝑊
� − 𝜇𝜇
𝐾𝐾𝐴𝐴 =
𝜌𝜌
2(𝑊𝑊/𝑆𝑆)
(𝜇𝜇𝐶𝐶𝐿𝐿 − 𝐶𝐶𝐷𝐷𝐷𝐷 − 𝐾𝐾𝐶𝐶𝐿𝐿
2)
where 𝐾𝐾𝑇𝑇 contains the thrust terms, 𝐾𝐾𝐴𝐴 contains the aerodynamic terms and 𝜇𝜇 is the friction
coefficient. Typical friction coefficient values for standard runways can be found in Raymer and
for our analysis, we used 0.03. During transition from take-off to climb, we assume that the
aircraft’s path approximately follows a circular arc. The aircraft also accelerates from take-off
velocity to climb speed (1.2Vstall) during this transition. In order to simplify the analysis (without
requiring to numerically integrate along the flight path), an average velocity of 1.15 Vstall was
assumed for this phase. The radius of the circular transition path was obtained as
𝑅𝑅 =
1.3225𝑉𝑉𝑠𝑠𝑠𝑠𝑠𝑠𝑠𝑠𝑠𝑠
2
𝑔𝑔(𝑛𝑛 − 1)
where g is the acceleration due to gravity and n = L/W is the load factor typically about 1.2 just
after take-off. For our analysis, we computed the load factor using a take-off lift coefficient of 2.48
and an average climb speed of 43.83 m/s (1.15 Vstall). This resulted in a load factor of 1.09. The
climb angle was then determined as
𝑠𝑠𝑠𝑠𝑠𝑠(𝛾𝛾𝑐𝑐𝑐𝑐𝑐𝑐 𝑐𝑐𝑐𝑐) =
𝑇𝑇 − 𝐷𝐷
𝑊𝑊
𝑆𝑆𝑇𝑇𝑇𝑇 = 𝑅𝑅𝑠𝑠𝑠𝑠𝑠𝑠(𝛾𝛾𝑐𝑐𝑐𝑐𝑐𝑐 𝑐𝑐𝑐𝑐)](https://image.slidesharecdn.com/d9198c13-0cfc-4067-a09b-62230bca6066-161202063429/85/UCMerced_Benavente-17-320.jpg)


![21
aerodynamics of the plane’s fuselage, wings, control surfaces and undercarriage. The levels of
engine noise depends on the sounds generated by the propellers and moving parts of the engine
(turbo-electric generator in the case of EcoBobcat DEP19).
The use of a DEP concept plays a significant role in decreasing noise of the propulsion system
since the burden of producing thrust is divided among many propellers. If an aircraft uses two
turboprop engines (and hence two propellers), their size is inherently larger than a similar aircraft
that uses 14 propellers. A larger propeller dimension leads to higher tip speeds in the compressible
regime thereby leading to significantly more noise. While not very intuitive, two large propellers
will be much more noisy than 14 of the small propellers that our DEP aircraft will use. Also, the
fact that we use superconducting motors with fewer moving parts in comparison to traditional
motors will lead to noise reduction. Once again just as in the case of emissions, we have been very
cautious in order to maximize the noise reduction.
In order to further reduce airframe noise the current design could be modified to implement wing
morphing technology. Wing morphing adds considerable aerodynamic advantages to the aircraft
since it would replace slats and flaps and will be able to dynamically change the shape of the wing
based on the flight. To reduce undercarriage airframe noise the landing gear could have its small
components such as the hydraulic lines be placed in dead zones of the airflow by being placed
behind or enclosed by bigger components. Another method of reducing airframe noise would be
to implement vertical take-off and landing.
Cost Analysis
Cost analysis for the EcoBobcat DEP19 was done using the Development and Procurement Costs
of Aircraft (DAPCA) guidelines outlined in Raymer’s book [7]. Analysis was separated into 2
major phases, Manufacturing and Operations. Within the manufacturing phase, cost is broken
down into two groups. These two groups are known as RDT&E and Fly-away. RDT&E costs
includes research, development, testing, and evaluation. Fly-away cost includes both material and
labor. Using the DAPCA equations listed in Raymer’s book, the required hours to complete:
engineering, tooling, manufacturing, and quality control were estimated and multiplied by the
standard hourly rate. Development support, flight-test, and material costs can also be directly
estimated using DAPCA equations which are empirically calibrated and commonly used. For the
purpose of cost analysis, it was assumed that 695 units will be manufactured since the units cost
for Beechcraft 1900 was available based on 695 units manufactured. An increase in production
quantity would result in a decrease in manufacturing cost. This decrease in cost is a result of the
“learning curve” effect. That is, as production increases, the better the manufacturing work force
gets at producing each component, resulting in a decrease in hours needed for each phase.
According to Raymer, as production quantity is doubled the cost of labor per plane goes down by
about 20%. It is also important to recognize that the values calculated using these equations have
results in 1986 dollars and must be inflated to today’s dollars using the consumer price index (CPI).
The DAPCA equations depend primarily on the aircraft empty weight, maximum velocity,
production quantity, number of flight test aircraft, number of engines, engine maximum thrust,
engine maximum Mach number, and Turbine inlet temperature. We initially obtain the total
number of engineering hours that include the airframe design and analysis, test engineering,
configuration control, and system engineering. Engineering hours are primarily expended during
the RDT&E stage but there is some engineering aspect even during the production stage.](https://image.slidesharecdn.com/d9198c13-0cfc-4067-a09b-62230bca6066-161202063429/85/UCMerced_Benavente-24-320.jpg)
![26
References
[1] U. Schumann, "The impact of nitrogen oxides emissions from aircraft upon the atmosphere
at flight altitudes - results from the AERONOX project," Atmospheric Environment, pp.
1723 - 1733, 1997.
[2] I. Kohler, R. Sausen and R. Reinberger, "Contributions of aircraft emissions to the
atmospheric NOx content," Atmospheric Environment, vol. 31, no. 12, pp. 1801 - 18, 1997.
[3] D. Daggett, O. Hadaller, R. Hendricks and R. Walther, "Alternative fuels and their potential
impact on aviation," National Aeronautics and Space Administration NASA/TM 214365,
2006.
[4] A. Stevanovic, J. Stevanovic, K. Zhang and S. Batterman, "Optimizing traffic control to
reduce fuel consumption and vehicular emission: Integrated approach with VISSIM,
CMEM, and VISGAOST," Transportation Research Record: Journal of the transportation
research board, vol. 2128, pp. 105 - 113, 2009.
[5] A. S. Gohardani, G. Doulgeris and R. Singh, "Challenges of future aircraft propulsion: A
review of distributed propulsion technology and its potential application for the all electric
commercial aircraft," Progress in Aerospace Sciences, vol. 47, no. 5, pp. 369 - 91, 2011.
[6] A. M. Stoll, J. Bevirt, M. D. Moore, W. J. Fredericks and N. K. Borer, "Drag reduction
through distributed electric propulsion," in 14th AIAA Aviation Technology, Integration and
Operations Conference, 2014.
[7] D. P. Raymer, Aircraft Design: A Conceptual Approach, AIAA, 2012.
[8] P. Jackson, Jane's All the World's Aircraft (2004 - 2005), 2004.
[9] C. Edupack, Materials Database, Cambridge: Granta Design Limited, 2012.
[10] D. J. Roskam, Airplane Design: Part I: Prelininary Sizing of Airplanes, vol. 2, Lawrence,
Kansas: Design, Analysis and Research Corporation.
[11] X. Software, "www.xflr5.com," [Online].
[12] P. J. Masson and C. A. Luongo, "High power density superconducting motor for all-electric
aircraft propulsion," Applied Superconductivity, vol. 15, no. 2, pp. 2226 - 2229, 2005.
[13] J. L. Felder, H. D. Kim and G. V. Brown, "Turbo-electric distributed propulsion engine cycle
analysis for hybrid-wing-body aircraft," in 47th AIAA Aerospace Sciences Meeting, Orlando,
FL, 2009.
[14] B. W. McCormick, Aerodynamics, Aeronautics and Flight Mechanics, New York: Wiley,
1979.
[15] S. Farokhi, Aircraft Propulsion, 2014.
[16] http://www.azom.com/article.aspx?ArticleID=949. [Online].](https://image.slidesharecdn.com/d9198c13-0cfc-4067-a09b-62230bca6066-161202063429/85/UCMerced_Benavente-29-320.jpg)