This document outlines the conceptual design process for an aircraft being designed to compete in the Cessna/Raytheon Missile Systems Student Design Build Fly competition. Key aspects of the conceptual design include:
- Analyzing the mission requirements of the competition and translating them into design requirements focused on lightweight, short wingspan, speed, short takeoff distance, and versatility.
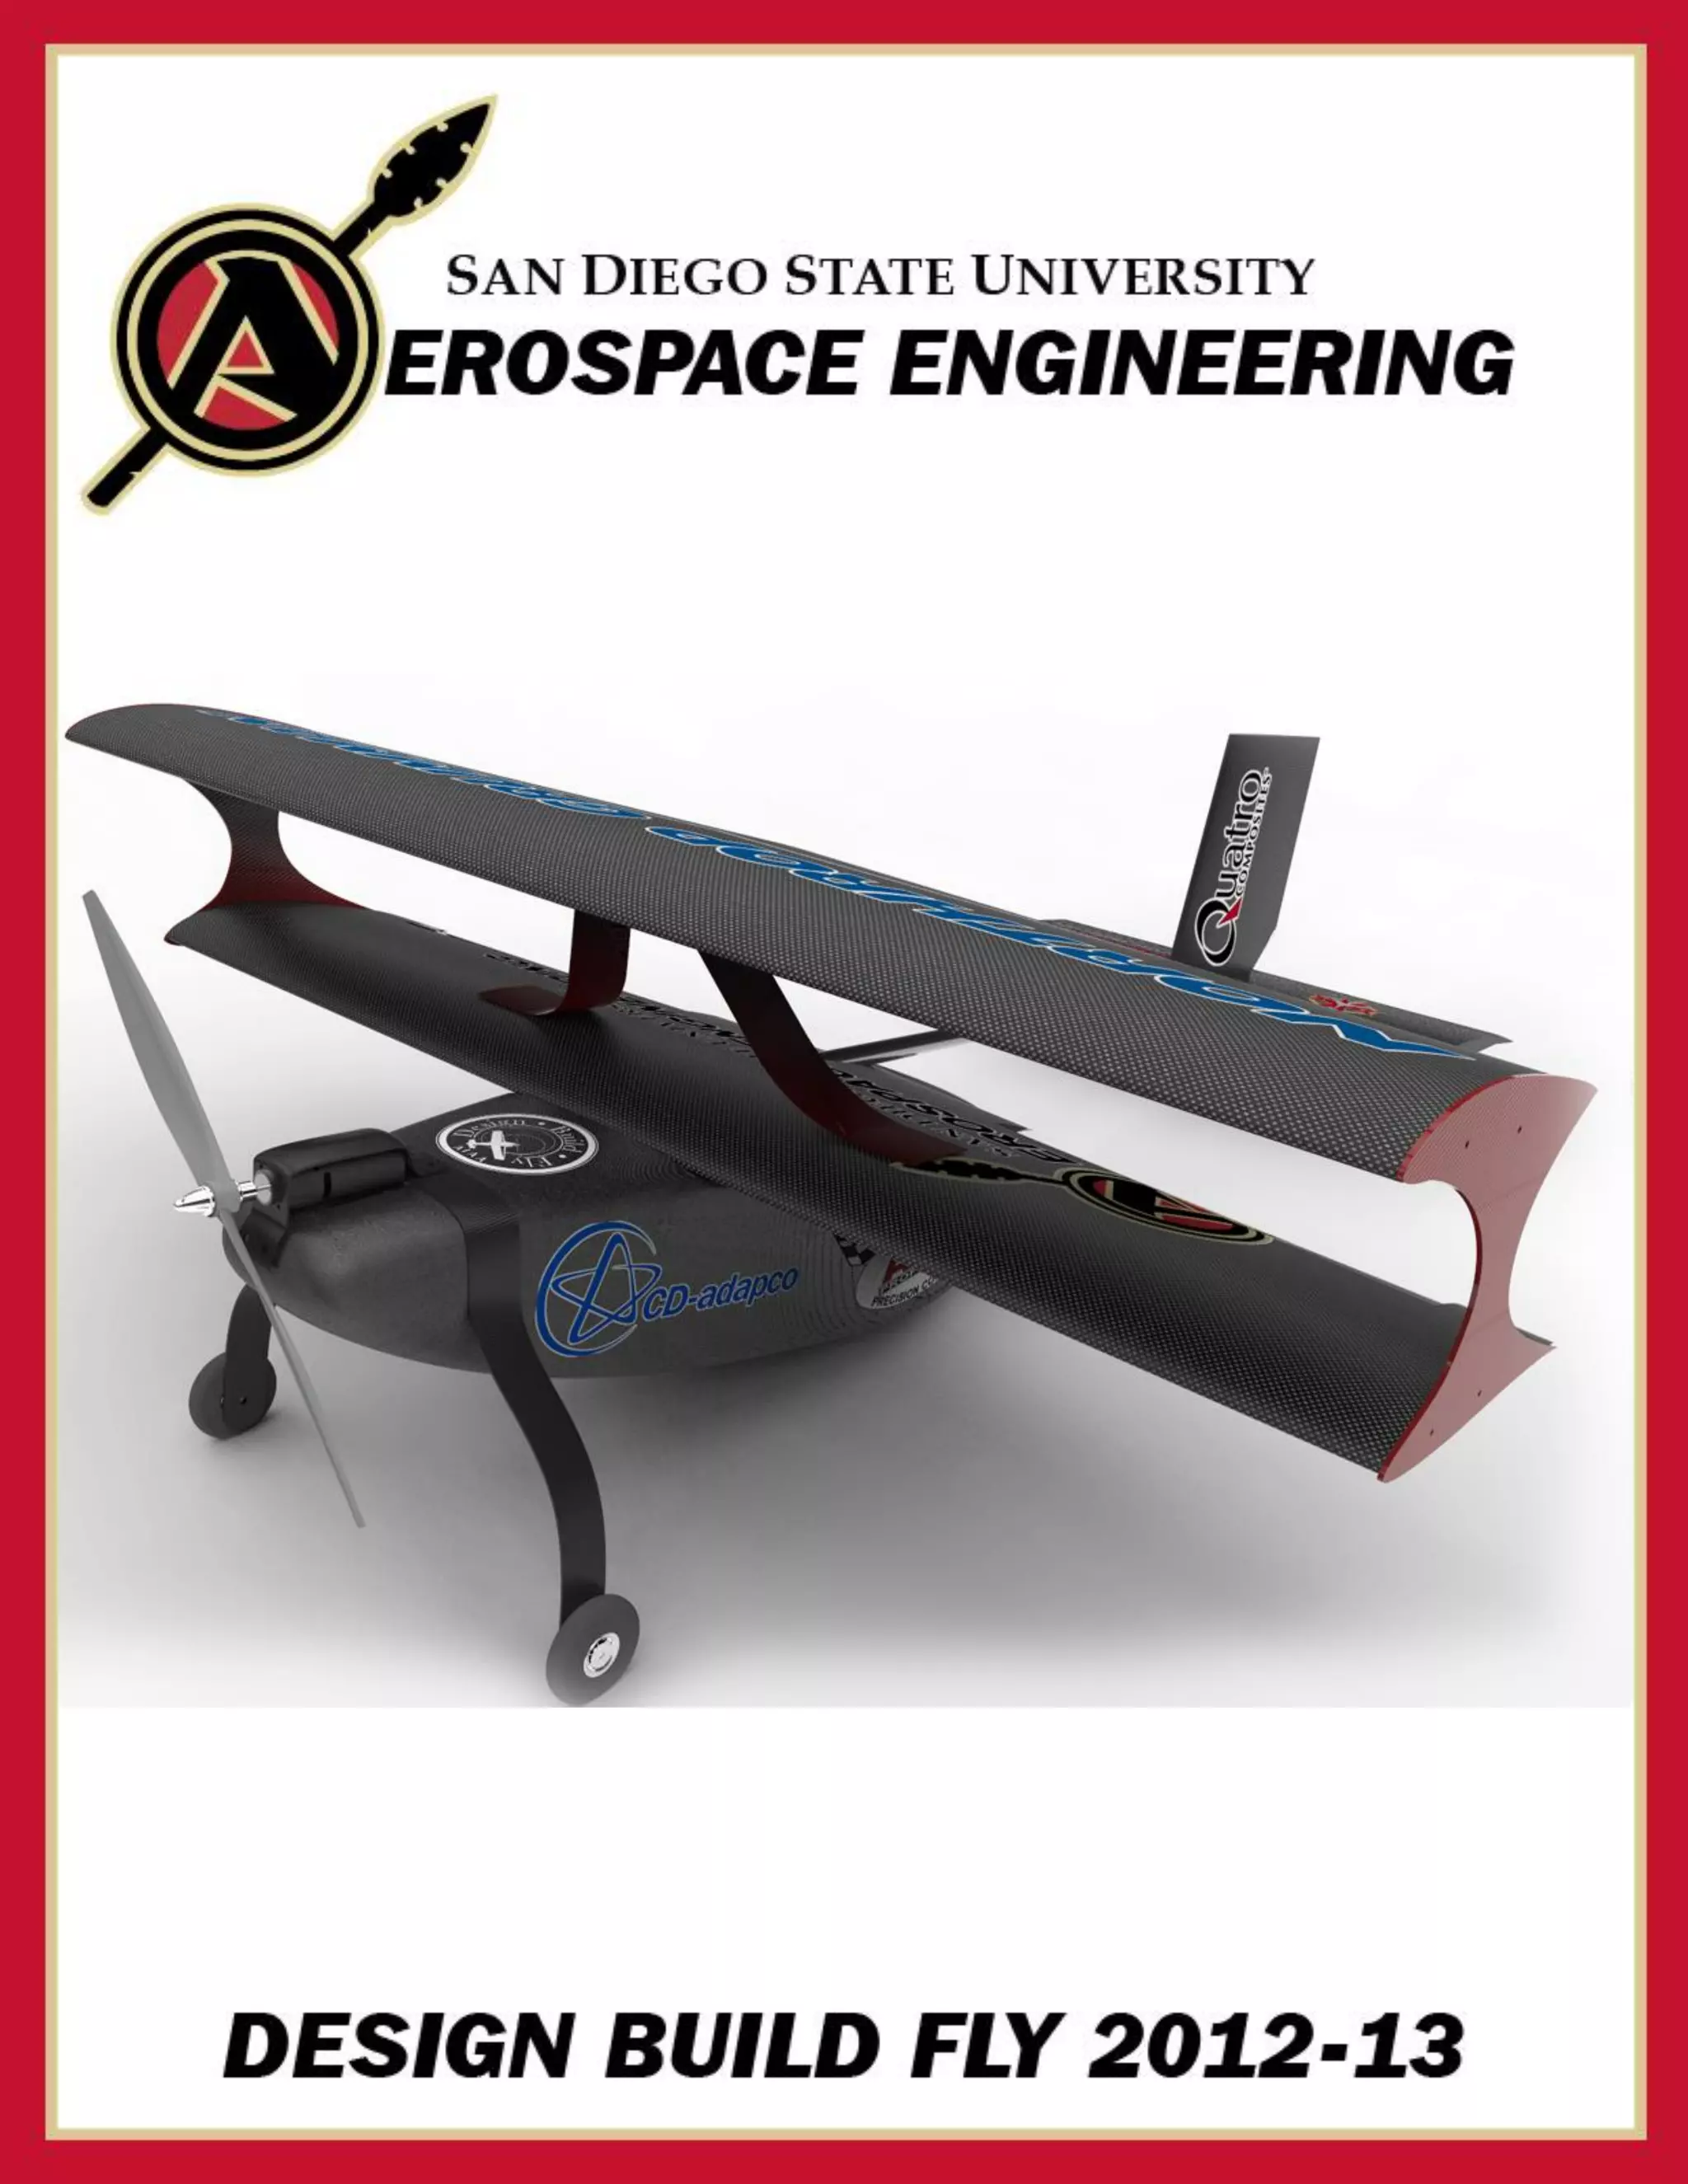
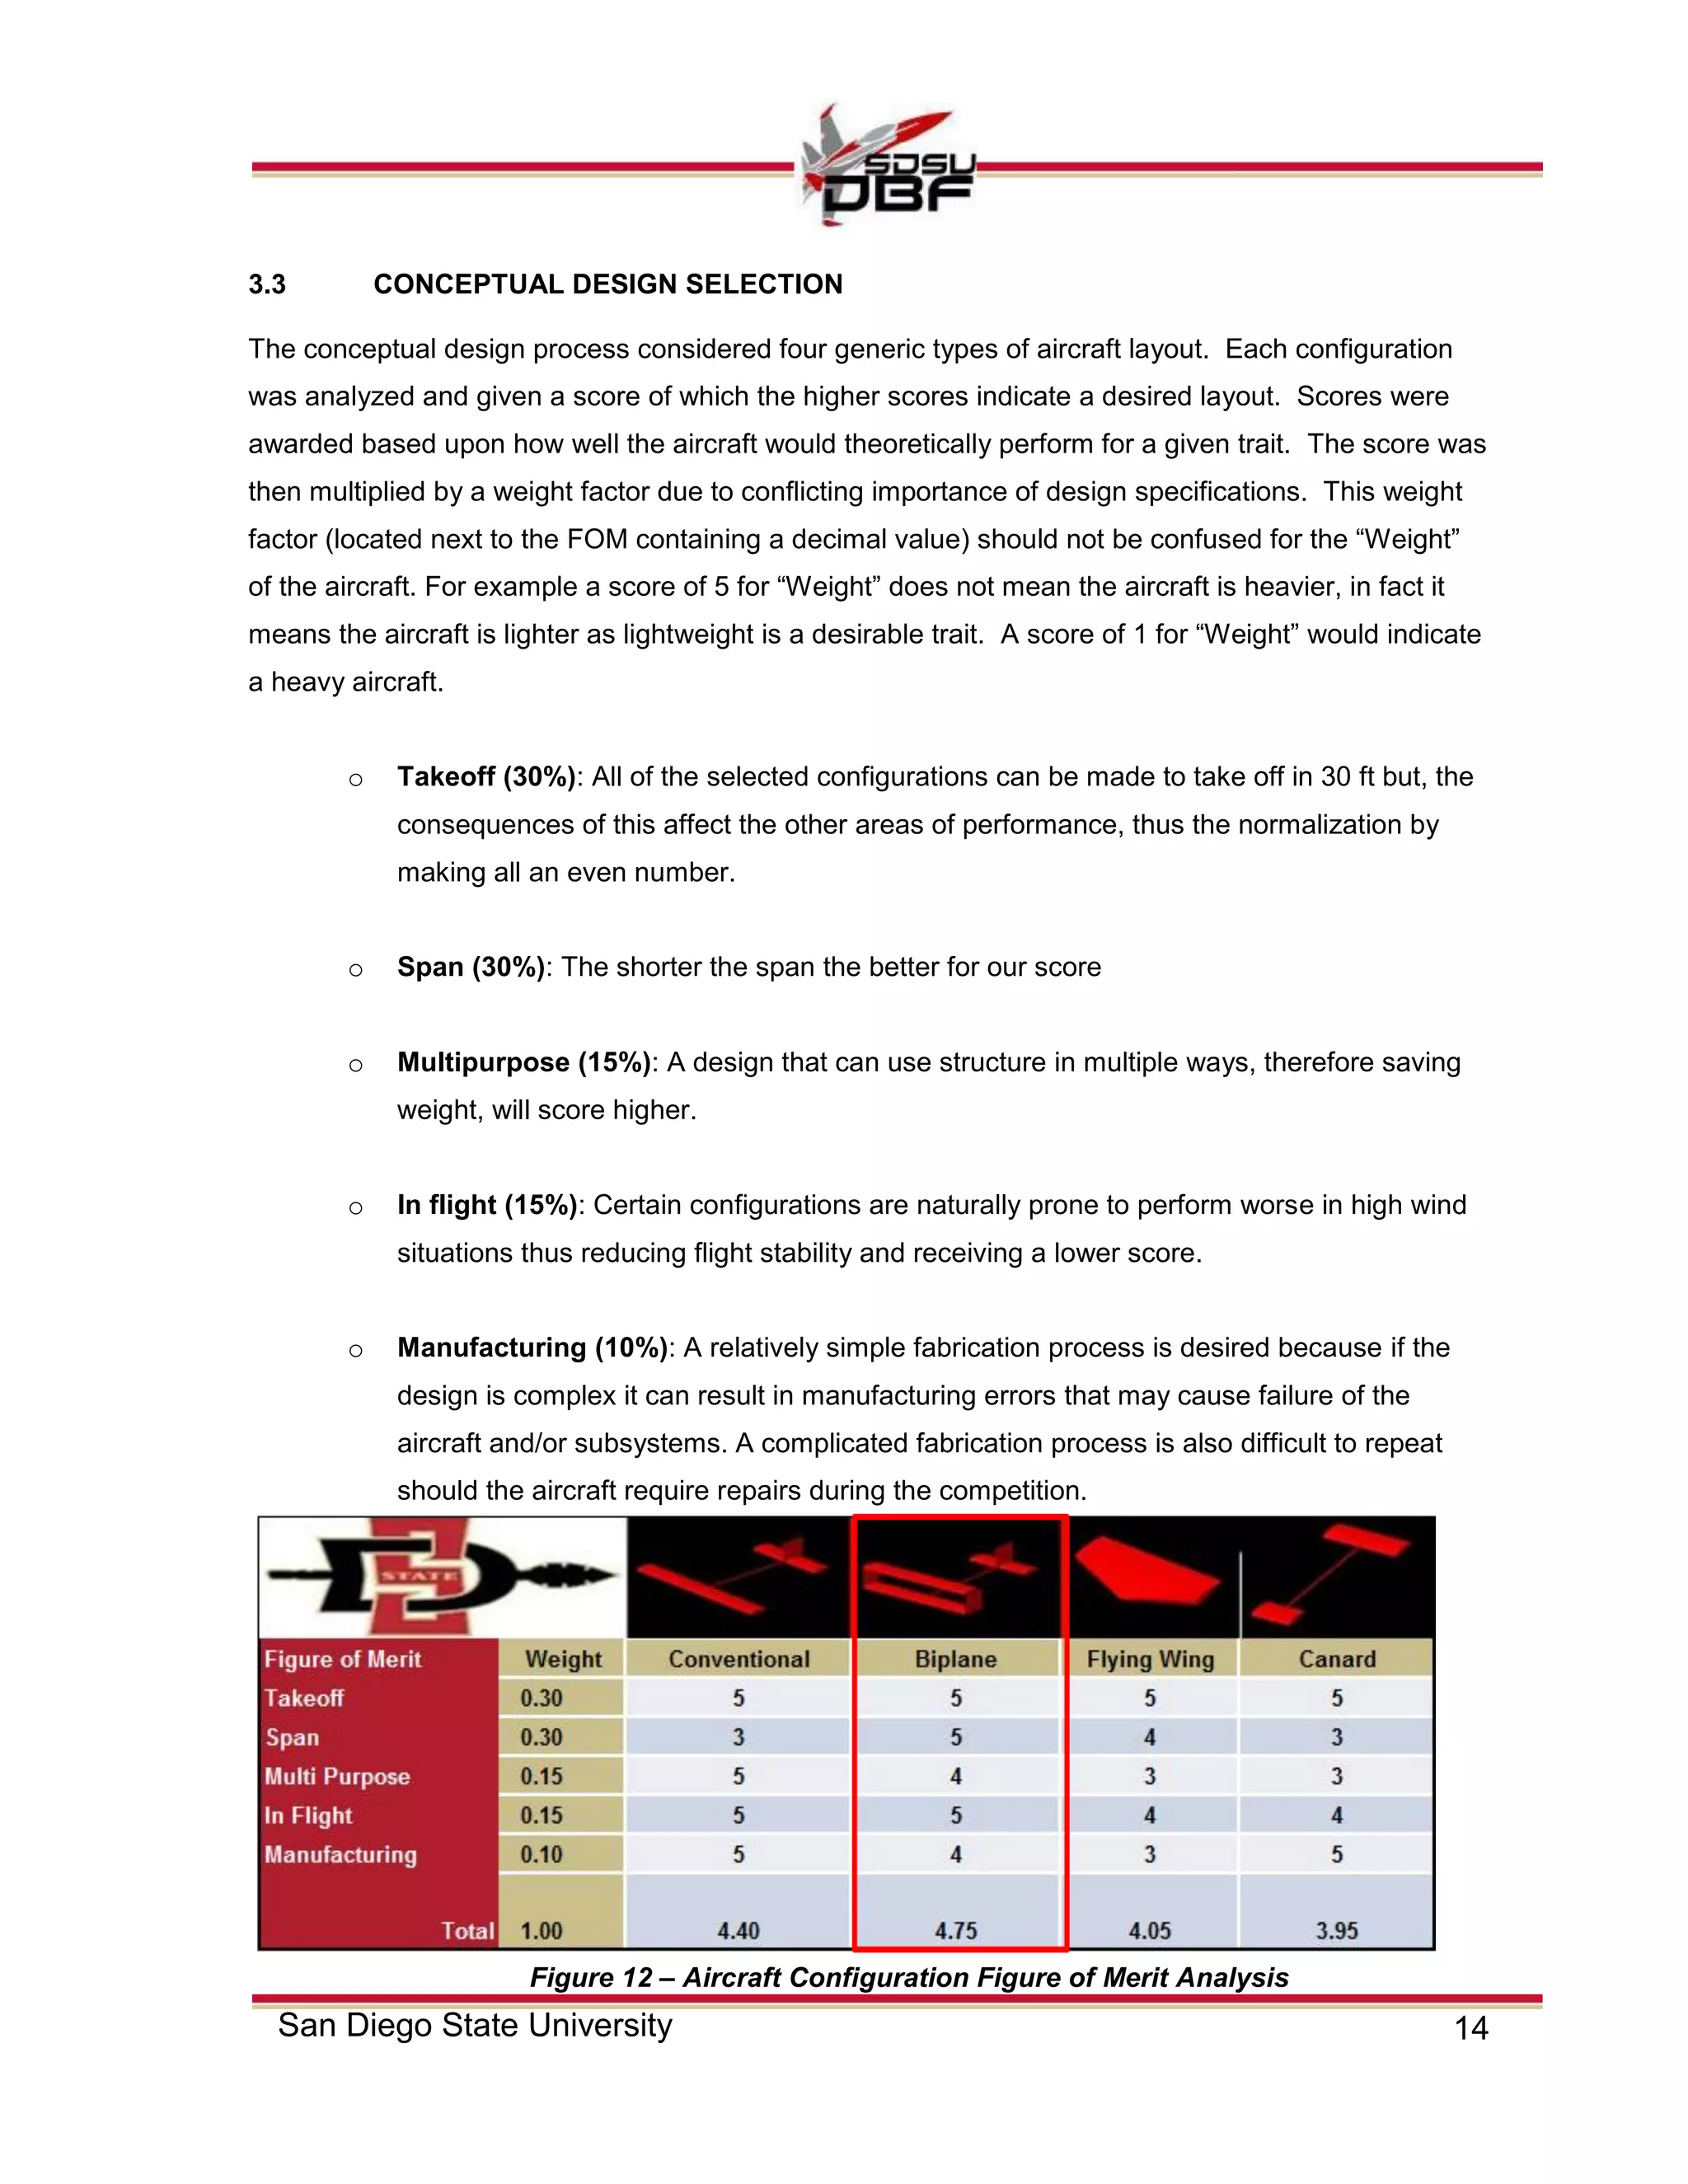
- Evaluating four generic aircraft configurations and selecting a biplane design based on traits like takeoff ability, wingspan, multipurpose structure, flight stability, and ease of manufacturing.
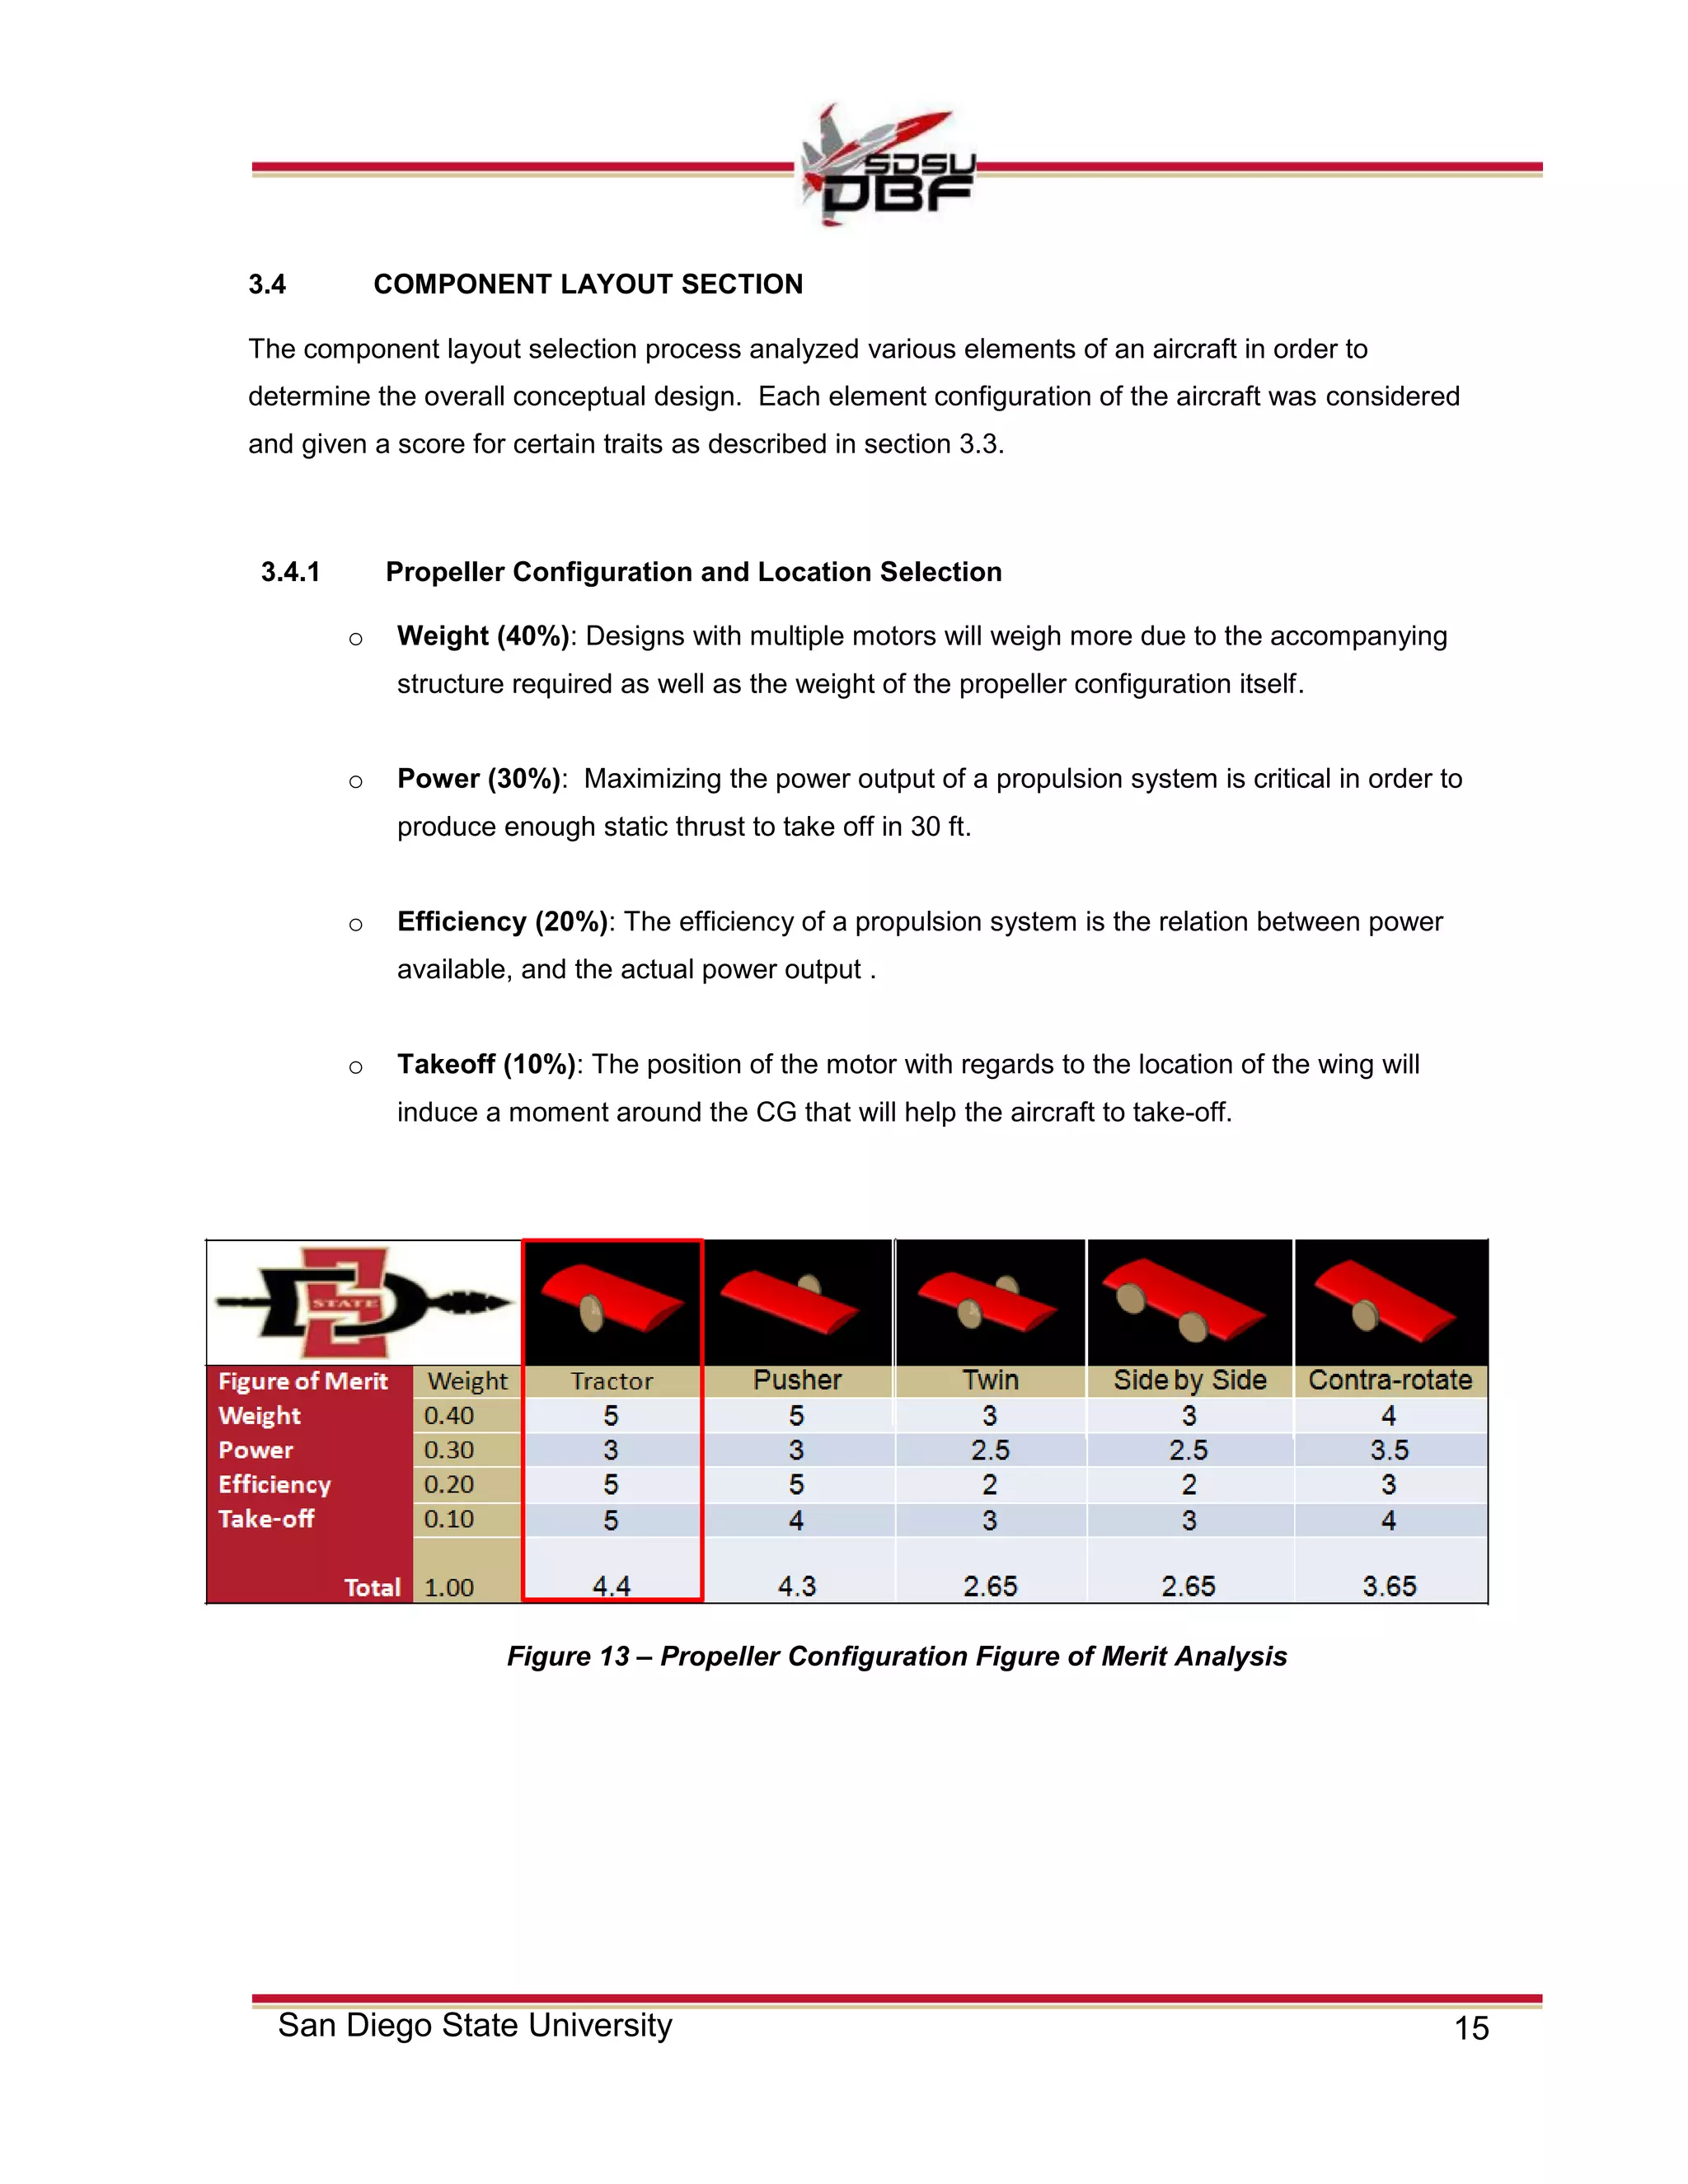
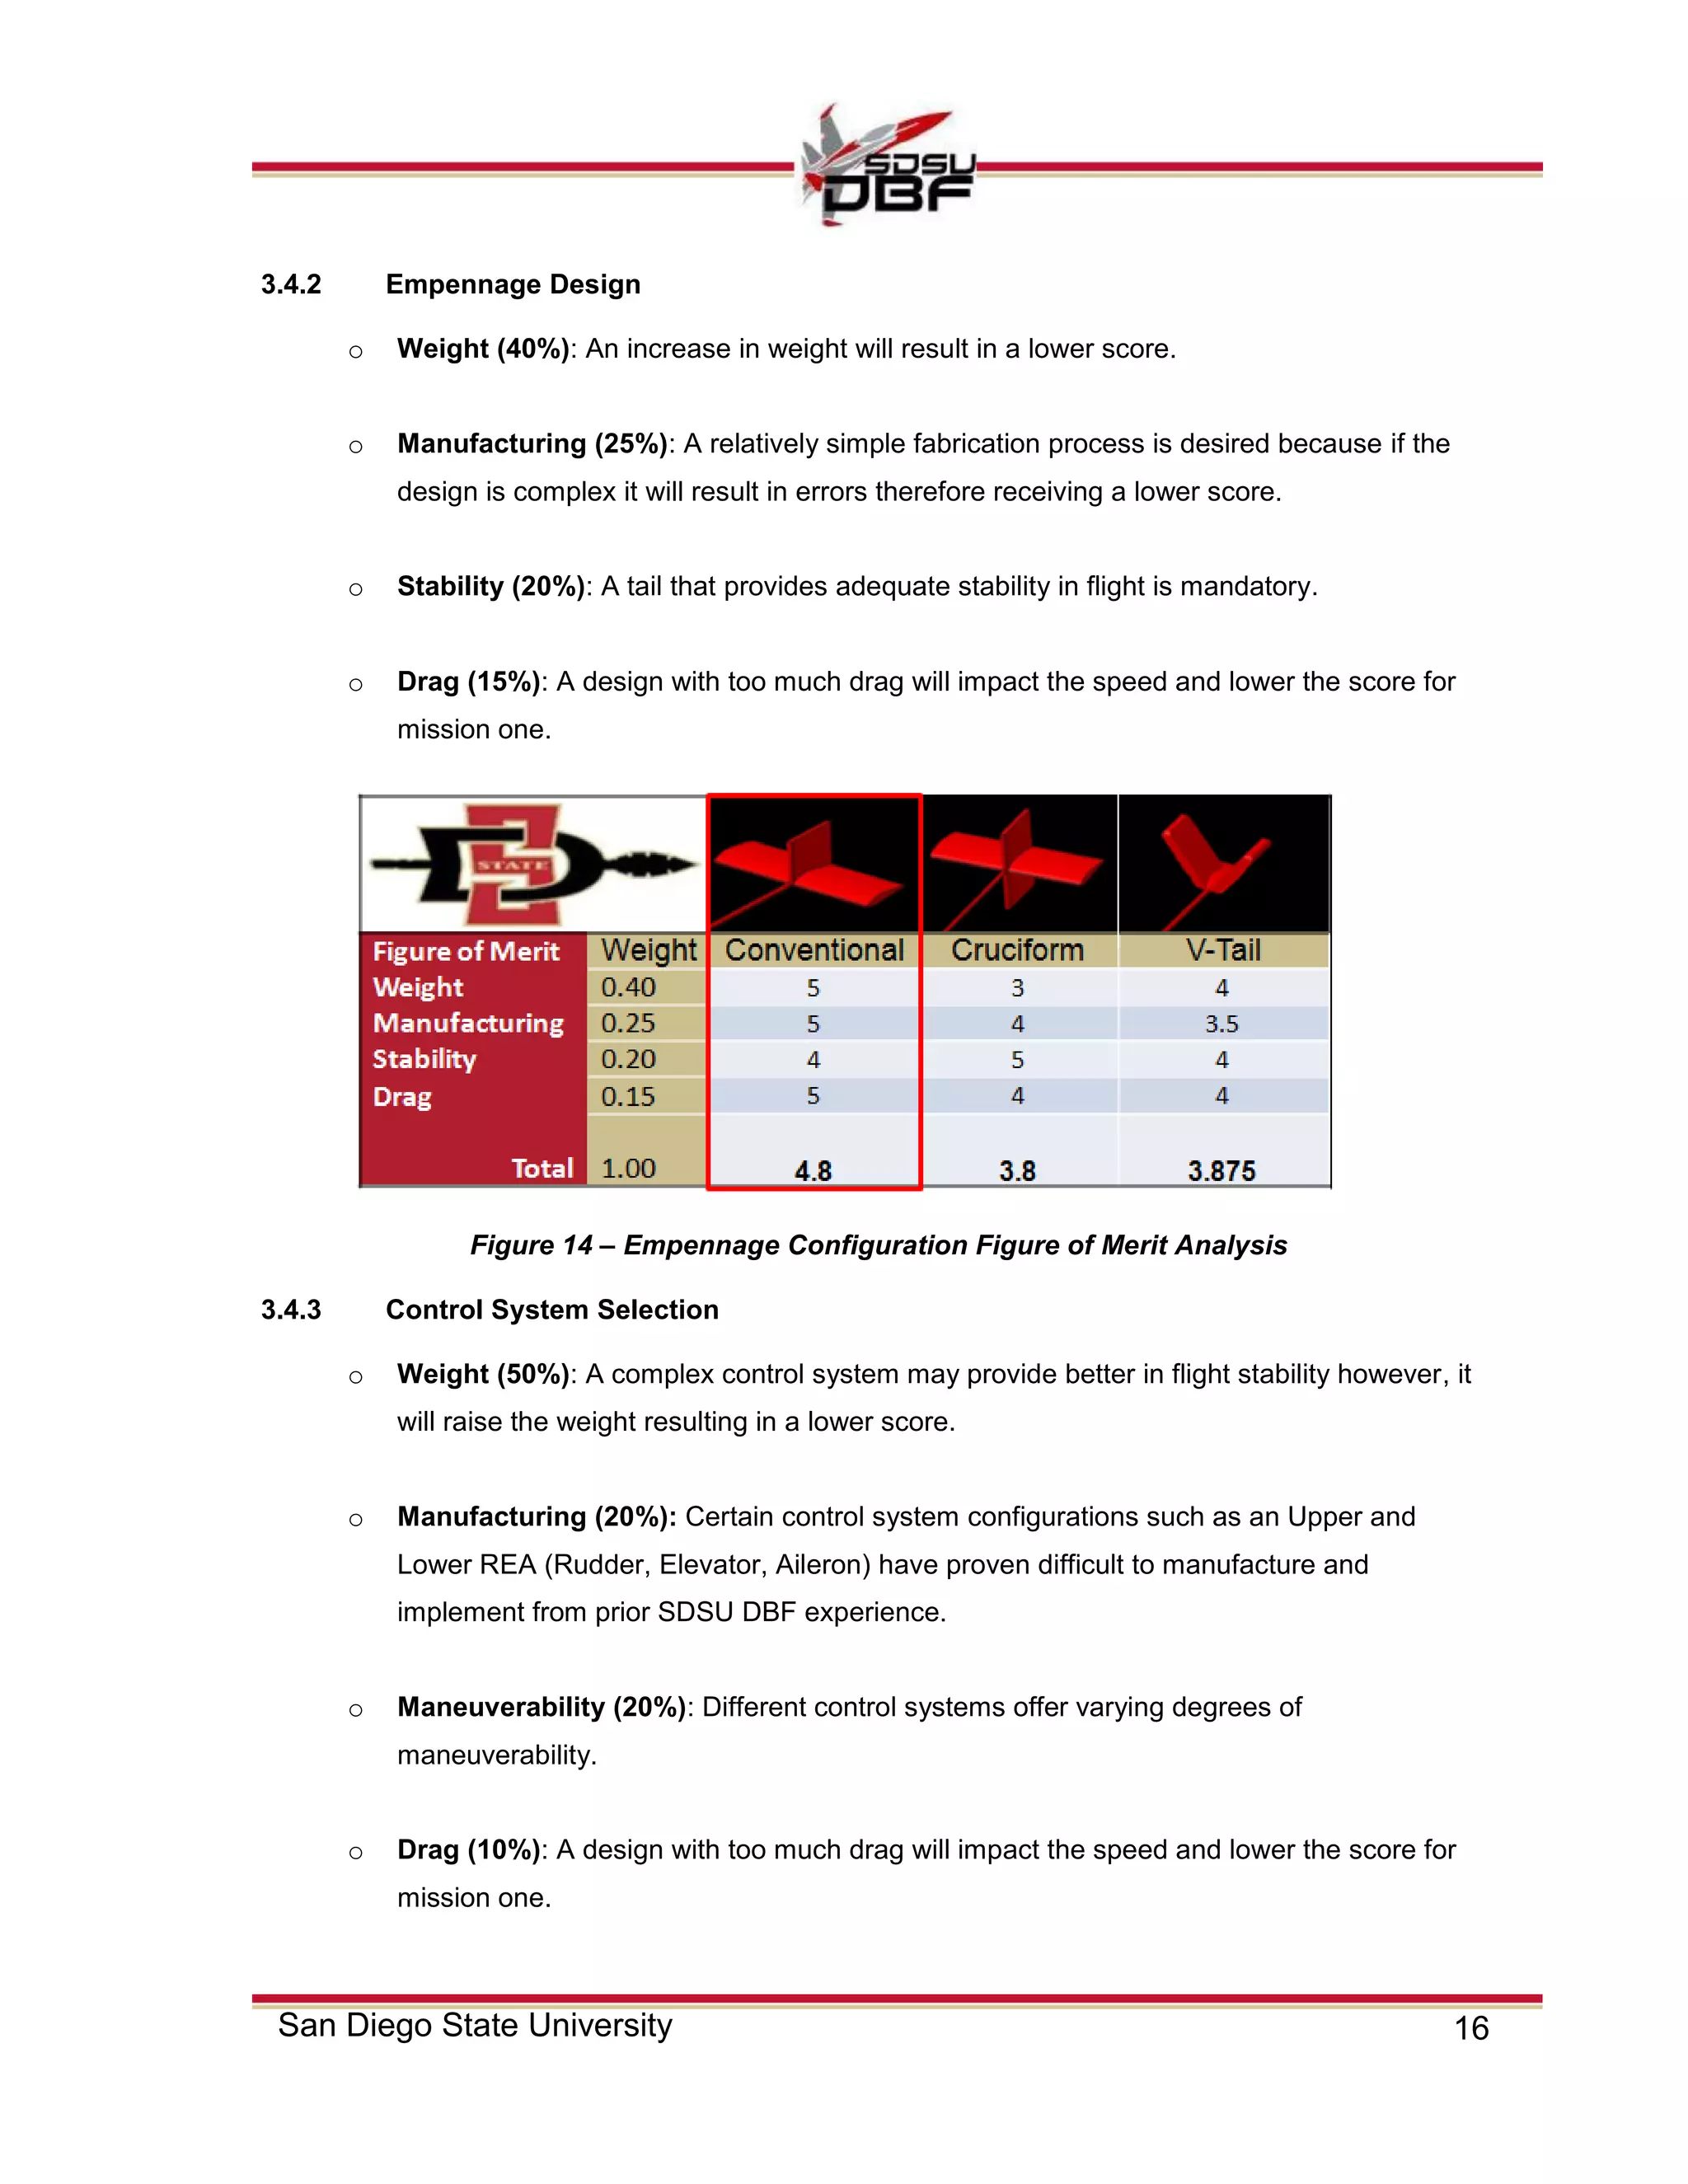
- Scoring different component layout options like propeller configuration, location, and empennage design based on criteria such as weight, power, efficiency,
![59San Diego State University
9.0 REFERENCES
1
AIAA. (2012 04-September). 2012/13 Rules and Vehicle Design. Retrieved 2012 04-Sept. from AIAA
DBF: [http://www.aiaadbf.org/2012_files/2012_rules.htm]
2
Abbott and A.E. Von Doenhoff. Theory of Wing Sections, New York: Dover 1959
3
Anderson, John D. Introduction to Flight. New York: McGraw-Hill, 1989
4
Anderson, John D. Fundamentals of Aerodynamics. New York: McGraw-Hill, 1991
5
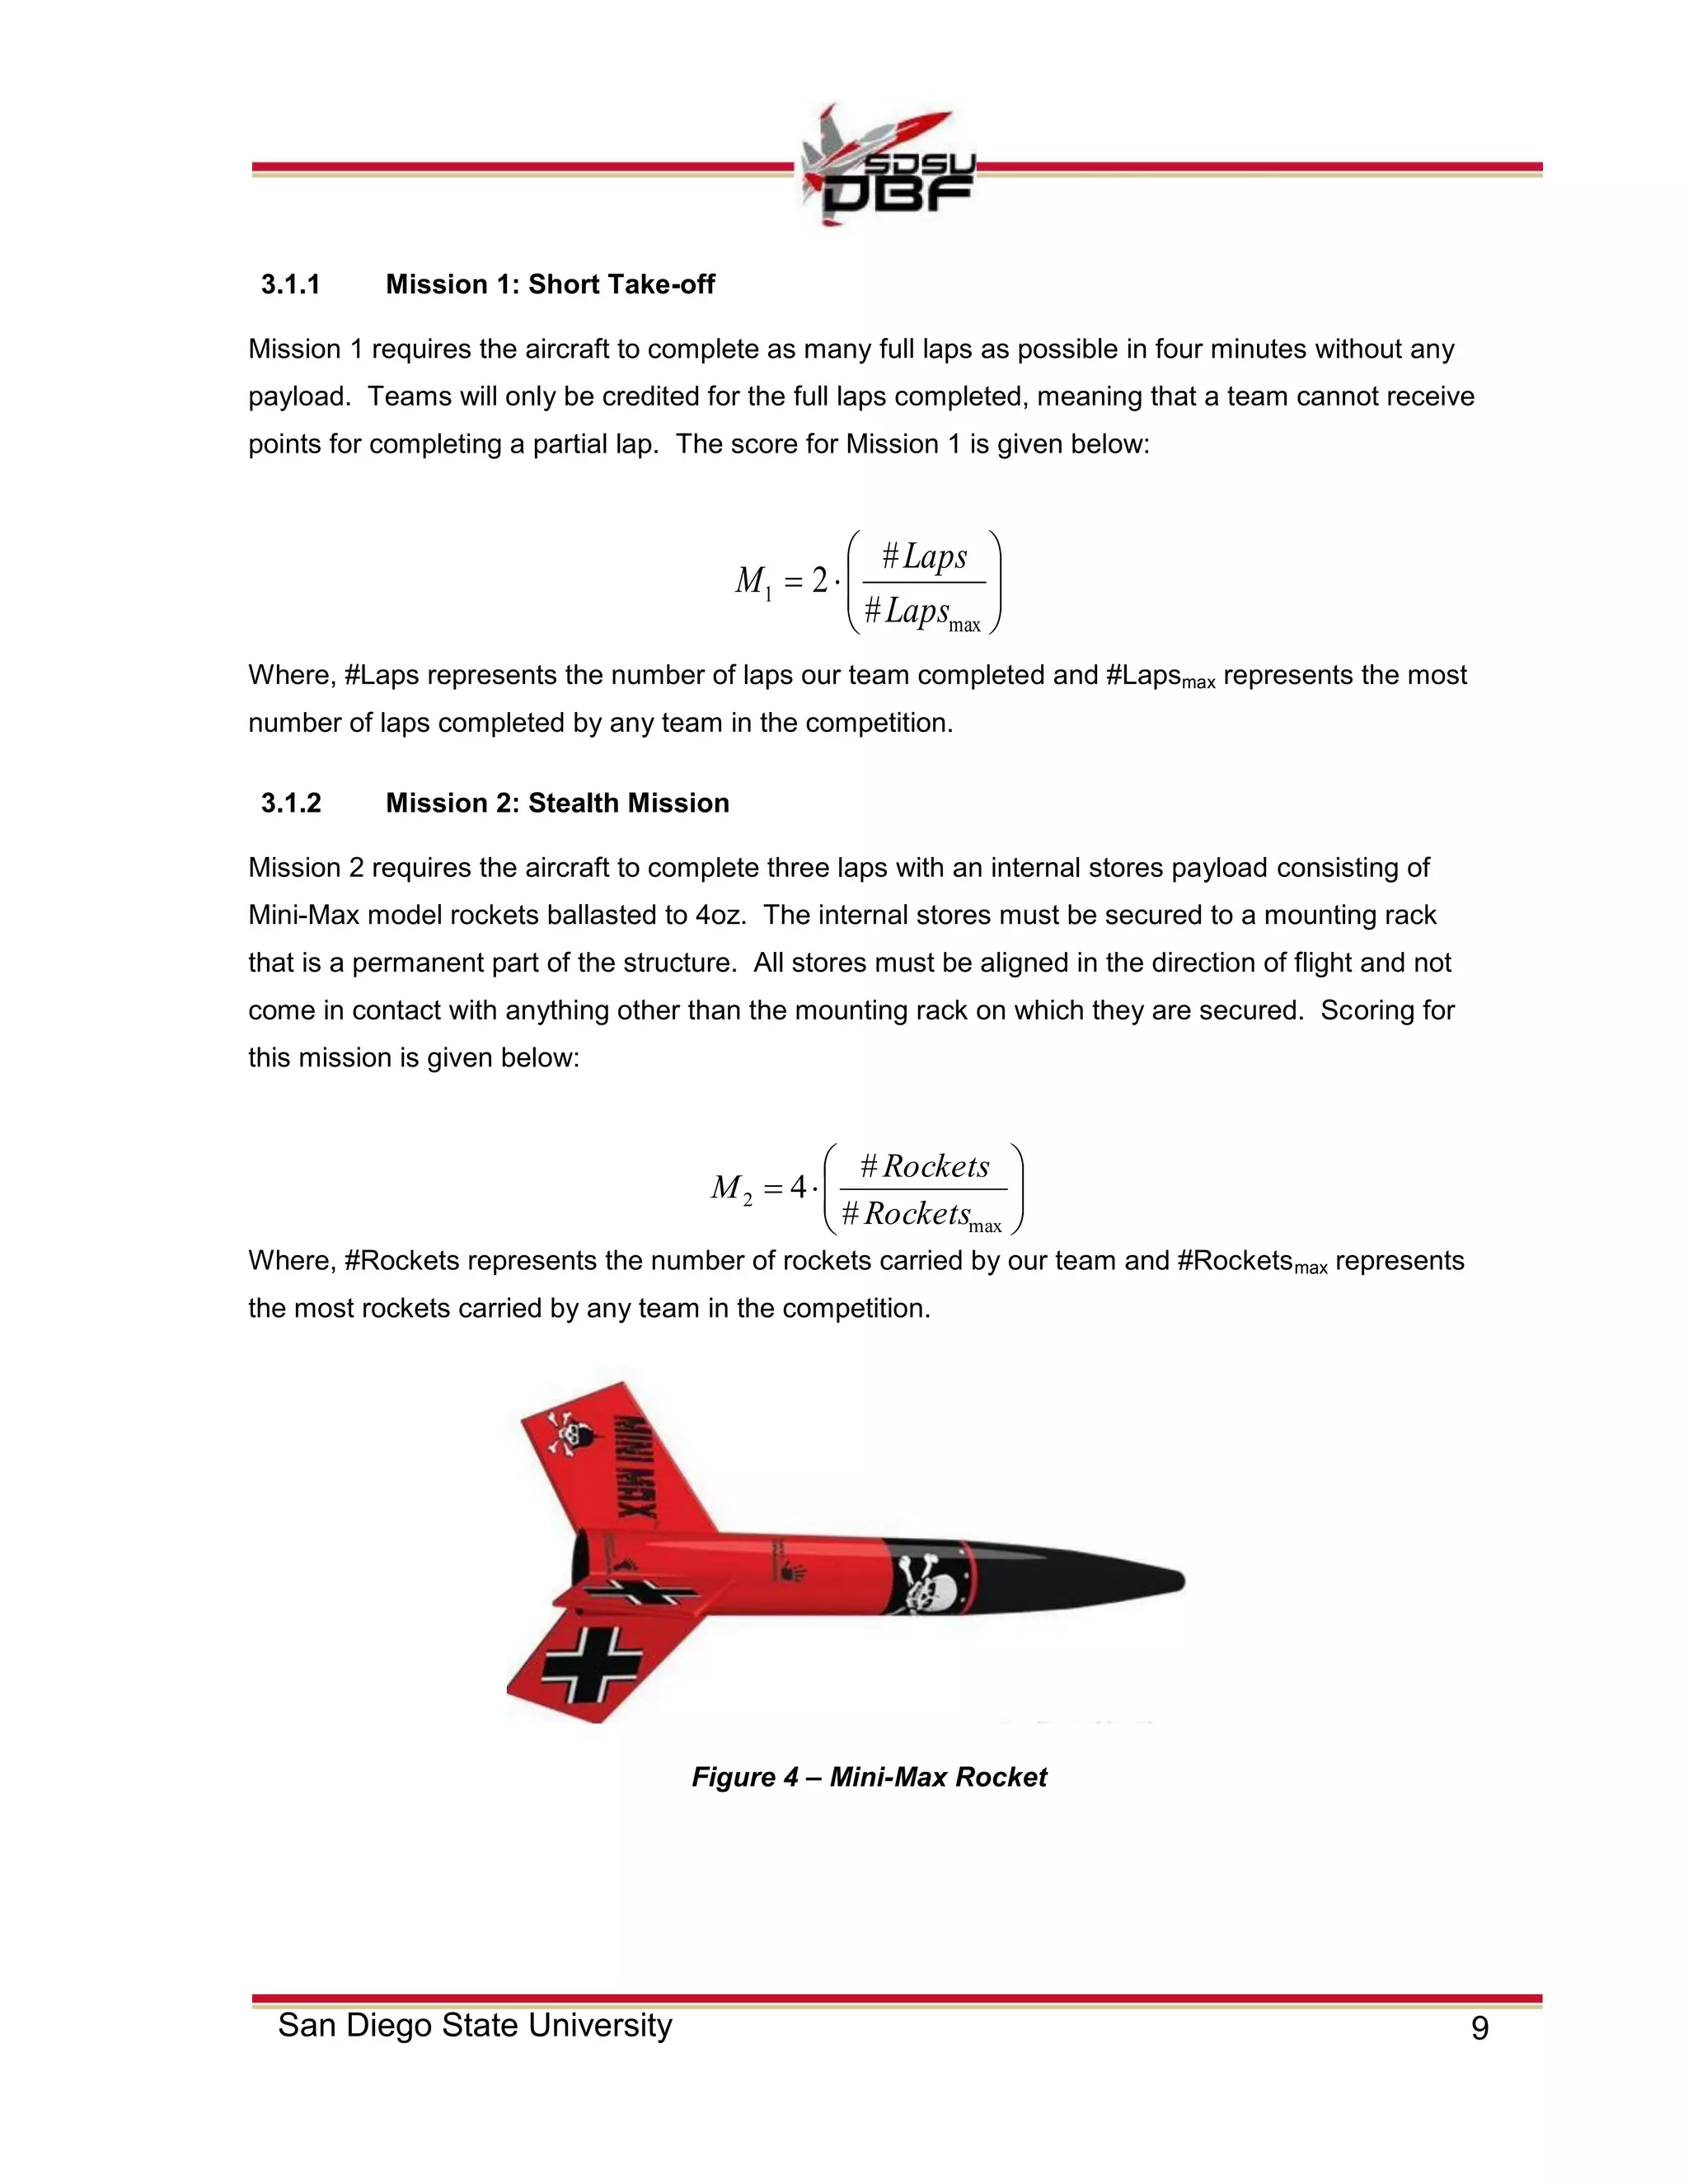
Bandu N. Pamadi, Performance, Stability, Dynamics and Control of Airplanes. AIAA Education
Series, 2004.
6
Drela, Mark. XFOIL 6.96 user Guide. Boston MIT, 1986
7
Etkin, Bernard. Dynamics of Flight. New York: John Wiley & Sons, 1996
8
Kroo, Ilan Aircraft Design: Synthesis and Analysis, Version 0.9.
http://adg.stanford.edu/aa241/AircraftDesign.html
9
Nicolai, Leland. Fundamentals of Aircraft Design. San Jose: Mets, 1984
10
Raymer, D. (2008). Aircraft Design: A Conceptual Approach. Reston, Virginia: American Institute of
Aeronautics and Astronautics.
11
Roskam, Jan. Airplane Design: Part VI. Lawrence: DARcorporation, 2000
12
Motocalc 8. s.l. :Capable Computing inc. http://www.motocalc.com/index.html
13
Muller, Markus. eCalc. http://wwww.ecalc.ch/motocalc_e.htm?ecalc
14
UGS Corp., ComponentOne, DriveWorks Ltd., Geometric Ltd., Microsoft Corporation, Spatial
Corp., Luxology, Inc., The University of Tennessee, Siemens industry Software Limited, and
Siemens Product Lifecycle Management Software inc. SolidWorks 2012. Vers. Student.
Waltham: Dassault Systemes, 1993. Computer Software.
15
Star-CCM+. By CD-adapco. http://www.cd-adapco.com/products/star_ccm_plus/
16
UGS Corp., ComponentOne, DriveWorks Ltd., Geometric Ltd., Microsoft Corporation, Spatial
Corp., Luxology, Inc., The University of Tennessee, Siemens industry Software Limited, and
Siemens Product Lifecycle Management Software inc. Abaqus 2010. Vers.
Waltham: Dassault Systemes, 1993. Computer Software.](https://image.slidesharecdn.com/d00c0998-efb3-4a64-b6a9-34a8d4492e1c-150116185927-conversion-gate01/75/2013DBF_SanDiegoStateUniversity-59-2048.jpg)


