This study analyzed clinical outcomes of treated and untreated patients with hepatitis C virus (HCV) infection in two cohorts. It found that HCV patients who did not respond to interferon-alpha based treatment had a significantly increased risk of developing cirrhosis compared to untreated patients, even after adjusting for factors like fibrosis stage and psychosocial risks. Specifically, treatment nonresponders had a 2.35 times higher hazard of cirrhosis in the Veterans Affairs cohort and a 5.9 times higher hazard in the University Hospital cohort compared to untreated patients. However, the overall survival of nonresponders was not significantly different than untreated patients. This suggests that while interferon-alpha treatment failure may accelerate liver fibrosis, it does not necessarily impact overall
![Nonresponse to Interferon-a Based Treatment for
Chronic Hepatitis C Infection Is Associated with
Increased Hazard of Cirrhosis
Myrna L. Cozen1
*.
, James C. Ryan1.
, Hui Shen1
, Robert Lerrigo1
, Russell M. Yee2
, Edward Sheen3
,
Richard Wu1
, Alexander Monto1
1 Department of Medicine, Veterans Affairs Medical Center and University of California San Francisco, San Francisco, California, United States of America, 2 Department of
Epidemiology, Mailman School of Public Health, Columbia University, New York, New York, United States of America, 3 Department of Medicine, Stanford University
School of Medicine, Stanford, California, United States of America
Abstract
Background: The long-term consequences of unsuccessful interferon-a based hepatitis C treatment on liver disease
progression and survival have not been fully explored.
Methods and Findings: We performed retrospective analyses to assess long-term clinical outcomes among treated and
untreated patients with hepatitis C virus in two independent cohorts from a United States Veterans Affairs Medical Center
and a University Teaching Hospital. Eligible patients underwent liver biopsy during consideration for interferon-a based
treatment between 1992 and 2007. They were assessed for the probability of developing cirrhosis and of dying during
follow-up using Cox proportional hazards models, stratified by pretreatment liver fibrosis stage and adjusted for known risk
factors for cirrhosis and characteristics affecting treatment selection. The major predictor was a time-dependent covariate
for treatment outcome among four patient groups: 1) patients with sustained virological response to treatment; 2)
treatment relapsers; 3) treatment nonresponders; and 4) never treated patients. Treatment nonresponders in both cohorts
had a statistically significantly increased hazard of cirrhosis compared to never treated patients, as stratified by pretreatment
liver fibrosis stage and adjusted for clinical and psychosocial risk factors that disproportionately affect patients who were
ineligible for treatment (Veterans Affairs HR = 2.35, CI 1.18–4.69, mean follow-up 10 years, and University Hospital HR = 5.90,
CI 1.50–23.24, mean follow-up 7.7 years). Despite their increased risk for liver disease progression, the overall survival of
nonresponders in both cohorts was not significantly different from that of never treated patients.
Conclusion: These unexpected findings suggest that patients who receive interferon-a based therapies but fail to clear the
hepatitis C virus may have an increased hazard of cirrhosis compared to untreated patients.
Citation: Cozen ML, Ryan JC, Shen H, Lerrigo R, Yee RM, et al. (2013) Nonresponse to Interferon-a Based Treatment for Chronic Hepatitis C Infection Is Associated
with Increased Hazard of Cirrhosis. PLoS ONE 8(4): e61568. doi:10.1371/journal.pone.0061568
Editor: Hans Tillmann, Duke University, United States of America
Received October 17, 2012; Accepted March 8, 2013; Published April 25, 2013
This is an open-access article, free of all copyright, and may be freely reproduced, distributed, transmitted, modified, built upon, or otherwise used by anyone for
any lawful purpose. The work is made available under the Creative Commons CC0 public domain dedication.
Funding: Funding provided by National Institutes of Health (NIH) RO1 AI 083113-01; NIH U19 AI 088790; NIH P30 DK026743 (University of California San
Francisco Liver Center); Veterans Affairs Merit Award Program and the Veterans Affairs Hepatitis C Resource Center. The funders had no role in study design, data
collection and analysis, decision to publish, or preparation of the manuscript.
Competing Interests: The authors have declared that no competing interests exist.
* E-mail: Myrna.Cozen@va.gov
. These authors contributed equally to this work.
Introduction
More than 3.2 million people in the United States (1% of the
population) are chronically infected with hepatitis C virus (HCV)
[1,2]. Until 2011, standard antiviral treatment consisted of
subcutaneous pegylated interferon-a (IFNa and oral ribavirin
(RBV), which failed to achieve a sustained virological response
(SVR, or cure) in approximately half of patients. The proportion
of treatment failures is greater among patients with HCV genotype
1, the most prevalent HCV subspecies in the U.S. [3,4,5,6]. The
recent addition of an oral protease inhibitor, either boceprevir or
telaprevir, to pegylated IFNa/RBV treatment for genotype 1
patients, has increased SVR rates to nearly 75% in treatment
naı¨ve patients [7,8,9]. SVR has been repeatedly associated with
reduced rates of cirrhosis, hepatic decompensation and hepato-
cellular carcinoma, but the long-term impact of treatment failure
on liver disease progression has not been fully explored [10,11,12].
Among treatment failures, it has been postulated that transient
reductions in viral load during treatment or anti-fibrotic effects of
IFNa may attenuate liver disease progression [13]. Alternatively,
immunostimulatory influences of IFNa could accelerate liver
injury in some patients by triggering hepatic inflammation and
scarring [14]. Early observational studies suggested altered short-
term progression of liver fibrosis in some treated patients who fail
to clear HCV [12,15,16,17,18]. Pockros, et al, pooled data from
eight IFNa-based clinical trials that analyzed paired liver biopsy
specimens taken immediately prior to treatment and up to 24
weeks post-treatment, but long-term outcomes were not examined
PLOS ONE | www.plosone.org 1 April 2013 | Volume 8 | Issue 4 | e61568](https://image.slidesharecdn.com/ceae5641-2220-49d5-91d1-c1bc632fa0e1-161117221936/85/tx-outcomes-POne-0061568-1-1-320.jpg)
![[15]. Short term histologic improvement was seen in some, but not
all, treatment failures, and fibrosis progressed in some patients
[5,12,15,16,17,18]. The evidence from these treatment and from
recent retreatment trials, such as HALT-C and EPIC3
, suggests
that failed IFNa-based therapy might have either beneficial, null,
or detrimental effects on liver related outcomes in HCV treatment
failures [19,20]. There have been no prospective studies, however,
comparing long-term clinical outcomes among chronic HCV
patients with IFNa-based treatment failure to that of never treated
patients. In the present study, we compared long-term clinical
outcomes in two independent cohorts of treated and untreated
patients with HCV. Our primary aims were to assess the long-term
hazards of cirrhosis and death among the following treatment
groups: those who achieved SVR, relapsers, nonresponders, and
those who were never treated.
Methods
Ethics Statement
This study was conducted in accordance with the ethical
principles stated in the Declaration of Helsinki and is consistent
with good clinical practice and applicable regulatory requirements
[21]. Specific approval was granted by the University of
California, San Francisco (UCSF) Institutional Review Board
and the SFVA Research and Development Committee for this
retrospective records review.
Study Design and Patient Recruitment
We conducted a medical records review of patients with chronic
HCV who were first seen at the San Francisco Veterans Affairs
(SFVA) Medical Center Liver Clinic between January, 1992 and
July 2007. Most patients had been prospectively consented at the
time of liver biopsy for inclusion in a longitudinal database.
Eligible patients were $18 years of age, had documented chronic
HCV, underwent a pre-treatment liver biopsy, received follow-up
care at the SFVA Liver Clinic for at least one year after the initial
visit, and had at least one follow-up liver imaging study, biopsy or
clinic visit. Patients were excluded if they were co-infected with
either HIV-1 or hepatitis B virus or if they had decompensated
cirrhosis, hepatocellular carcinoma, or liver transplantation prior
to their first clinic visit. The study was replicated using an
independent cohort of HCV patients from the UCSF Liver Clinic
to which the same selection criteria were applied. Each cohort is
comprised of all patients meeting study eligibility criteria who were
evaluated and followed in these two clinics during this time period.
Assessment of Clinical Parameters
The SFVA and UCSF electronic medical records were the
major sources of data for the study. Deaths were confirmed by
cross reference with the national Social Security Death Index
(SSDI). Data abstraction was performed by two teams, each
including one clinician and one research staff member, using a
standardized search algorithm. Two additional raters performed
data validation on a random sample of patient charts to confirm
the reliability of values for select variables.
Clinical parameters including body mass index (BMI), alanine
aminotransferase (ALT), and HCV viral load were collected from
the electronic medical record on the date closest to the initial liver
clinic visit. Follow-up ALT was obtained from the laboratory test
taken closest to 52 weeks following the end of treatment for treated
patients. To obtain a comparable ALT value for the never treated
patients, we used the ALT closest to 170.7 weeks following initial
liver clinic visit. This interval corresponds to the average time
between the first liver clinic visit and the completion of one year of
post therapy follow-up among treated patients.
Psychosocial, demographic, and behavioral risk factors were
assessed and recorded by clinic staff at the time of first liver clinic
visit. This assessment and subsequent progress notes were used to
determine the presence of risk factors affecting treatment eligibility
such as current injection drug use, other substance abuse, history
of depression and post-traumatic stress disorder (PTSD). Heavy
alcohol use was defined as five or more years of daily alcohol use
exceeding the equivalent of four to five drinks per day by patient
self-report [22,23]. Indicators of social instability included recent
or current homelessness, housing instability, familial dissolution,
social isolation or incarceration.
The Batts-Ludwig system was used to assess fibrosis stage and
inflammatory grade from liver biopsies [24,25]. These measures
were obtained from the biopsy taken closest to the first liver clinic
visit, although biopsies taken more than five years before or one
year following this visit were not considered. Cirrhosis was defined
as either (i) stage 4 fibrosis on biopsy or (ii) a nodular liver contour
plus at least one of three previously validated criteria: ascites,
evidence of venous collateral vessels, or splenomegaly as visualized
on CT scan, MRI, and/or ultrasound [26].
Patients were categorized into four HCV treatment-related
groups using previously described standard definitions: SVR,
relapsers, nonresponders, and never treated [6,27,28]. Relapsers
achieved undetectable viral load during treatment with detectable
virus found during a six month follow-up period. Nonresponders
were null and partial responders who were detectably viremic
throughout therapy. Those treated for ,12 weeks were designated
‘‘early treatment discontinuation’’ (ETD) patients. Patients who
were treated more than once were assigned the treatment category
corresponding to their last course of therapy.
Major Predictor and Outcome Measures
The primary outcome variables were time-to-cirrhosis and time-
to-all-cause-death during the follow-up period. Never treated
patients comprised the reference category. Time zero for all time-
to-event analyses was the date of first liver clinic visit. To overcome
the temporal bias associated with variations in treatment start
time, we constructed a time-dependent covariate, using standard
methods as previously described [29,30]. This covariate modifies
the major predictor (treatment outcome) by adjusting for
differences in waiting times between time zero and the beginning
of treatment. Time-to-cirrhosis was calculated from time zero to
the date cirrhosis was first diagnosed or to the date of last liver
clinic visit. Patients diagnosed with cirrhosis prior to time zero
were excluded from the time-to-cirrhosis analysis, but were
included in time-to-death analysis. For time-to-death analysis,
the study length extended from time zero to the date of either
death or liver transplantation. In surviving patients, the right
censoring time was the date of last medical service encounter or six
months before the date that the SSDI was searched, whichever
was later. As the SSDI only includes date but not cause of death,
all-cause death was used as the outcome variable. March 31, 2012
was the cut-off date for all observations.
Statistical Methods
All analyses were performed using SAS version 9.2 (SAS
Institute Inc., Cary, NC). Chi square tests were performed for
categorical data analysis, and the Student’s t test or Wilcoxon rank
sum test was used to evaluate the association of continuous
predictors on categorical dependent variables (such as patient
treatment group). Cox proportional hazards models were used to
analyze both univariate and multivariate effects on the outcomes
Cirrhosis in HCV Nonresponders
PLOS ONE | www.plosone.org 2 April 2013 | Volume 8 | Issue 4 | e61568](https://image.slidesharecdn.com/ceae5641-2220-49d5-91d1-c1bc632fa0e1-161117221936/85/tx-outcomes-POne-0061568-1-2-320.jpg)
![of interest. Since differences in baseline fibrosis stage likely have
nonlinear influences on long-term fibrosis progression, and
because the distribution of fibrosis stage violated the proportional
hazards assumption, all Cox proportional hazards models were
stratified by fibrosis stage groupings (0–1 and 2–3 in time-to-
cirrhosis analyses and 0–1, 2–3 and 4 in time-to-death analysis).
Time-to-cirrhosis analysis was repeated using an alternate fibrosis
stratification strategy to allow a closer examination of advanced
stage 3 compared to stages 0–2.
We used two strategies to adjust for the non-random
distribution of characteristics differentiating treated from untreat-
ed patients, including age at initial liver biopsy, race/ethnicity,
HCV genotype, history of heavy alcohol use, other substance use,
psychiatric comorbidities, and social stability. First, these factors
were assessed individually in univariate hazards models and
incorporated into the full multivariate model through backward
stepwise regression, as described in Statistical Methods S1.
Second, propensity scores were derived from non-collinear risk
factors and substituted into the final time-to-event models using
previously described methods to estimate a composite effect from
the factors related to treatment selection [31,32]. Adjusted hazard
ratios resulting from the two approaches were compared. After
stratification by fibrosis stage, age-adjusted proportional hazards
curves were generated to graph the hazard function for cirrhosis
and death or liver transplantation among the four treatment
outcome groups. These models assume proportional hazards for
age, but not for treatment group.
Results
Demographic and Clinical Characteristics
Among SFVA patients screened, 358 (99% male) met the study
inclusion criteria, and 159 patients (44.4%) received antiviral
treatment for HCV. Approximately 80% were between the ages of
45 and 65 at initial liver clinic visit, with a mean age of 51
(Table 1). This age distribution corresponds to the birth cohort of
Vietnam era veterans, a risk group known to have higher rates of
prior IDU and HCV seroprevalence than other groups of
veterans, which reflects likely exposure to HCV during and
shortly after their service years in the 1960s and 1970s [33] [34].
Approximately 55% of the cohort had little or no liver disease at
baseline, as measured by Batts-Ludwig fibrosis score, while 7.3%
were cirrhotic. Mean follow-up time was 10 years, and 22%
(n = 78) died during follow-up. One patient underwent liver
transplantation. Deaths occurred among 8.7% of patients achiev-
ing SVR, 18.2% of relapsers, 28.6% of nonresponders, and 23.8%
of the never treated patients (p,0.01).
Treated SFVA patients had higher liver fibrosis stage and
inflammation score at baseline, however when stratified by fibrosis
stage the influence of inflammation lost significance, suggesting
effect modification by fibrosis. Treated patients were followed for a
longer period than never treated patients (10.8 versus 9.4 years,
p,0.0001) and treatment nonresponders and relapsers had more
follow-up liver imaging (or liver biopsies) than never treated
patients (xx = 1.77, 2.77, 3.88 and 1.74 for SVR, relapsers,
nonresponders and never treated patients, respectively,
p,0.0001) (Table 1). Never treated patients were older (52 versus
50 years, p = 0.04), more likely to be African American and more
likely to be infected with ‘‘difficult to clear’’ genotypes HCV
genotypes 1 or 4 than 2 or 3 (Table 1). Treated patients had a
higher mean BMI at baseline than never treated patients (Table 1).
The most common reasons cited for the decision not to treat
during follow-up were minimal liver disease (21.6%), ongoing
alcohol and substance use (19.1%), active mental health problems
(11.1%), African American race (5.0%), advanced liver disease
(3.0%), and advanced age with or without other comorbidities
(8.5%). Compared with treated patients, never treated patients
were more likely to be active substance users and to have at least
one indicator of social instability (Table 2).
No statistically significant difference was found in mean baseline
ALT between treated and never treated groups (p = 0.15, data not
shown), although the SVR group had a marginally higher baseline
value as compared to the other treatment outcome groups
(Table 1). We compared the mean change in ALT before and
after treatment for nonresponders and relapsers (grouped together)
to that of never treated patients for a comparable time interval.
We found that nonresponders and relapsers had a mean decrease
in ALT of 15.0 U/L, while never treated patients had a mean
increase of ALT of 17.6 U/L (p = 0.05) (data not shown). In
further analysis we found that 69.2% of nonresponders and
relapsers had a decrease in ALT $25% following treatment as
compared to 45.2% of never treated patients, while 19.2% of
nonresponders and relapsers and 41.9% of never treated patients
had an increase in ALT of $25% (p = 0.03) (data not shown).
Predictors of treatment success. Among treated SFVA
patients, African Americans were less likely to achieve SVR than
other races/ethnic groups (p = 0.03) as were patients with HCV
genotypes 1 or 4 (p = 0.007) and those with higher pretreatment
fibrosis stage (p = 0.004). No significant difference was noted in
treatment success between the small number of SFVA patients
who received IFNa monotherapy and those treated with IFNa or
pegylated IFNa/RBV combination therapy (Table 1).
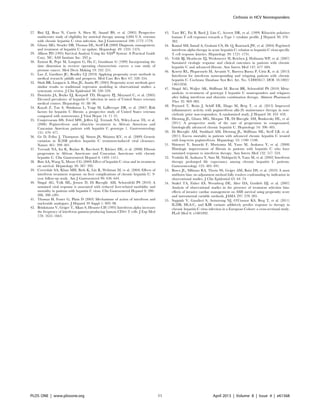
Cumulative incidence of cirrhosis. We examined the
cumulative incidence of cirrhosis among SFVA patients with
baseline fibrosis stages 2 and 3 using age adjusted proportional
hazards curves stratified by treatment group (Figure 1). A greater
proportion of treatment relapsers and nonresponders developed
cirrhosis than never treated patients. The overall incidence of
cirrhosis in the SFVA cohort was 25.8 cases per 1,000 person
years. While SVR and never treated patients had incidence rates
of 16.2 and 20.5 cases per 1,000 person years, respectively, these
rates rose to 28.9 and 58.9 cases per 1,000 person years among
relapsers and nonresponders. These differences, however, were
not statistically significant.
Time-to-cirrhosis analysis. In univariate proportional haz-
ards models stratified by baseline fibrosis stage (0–1 and 2–3) and
employing the time dependent covariate for SFVA treatment
group, nonresponders were twice as likely to develop cirrhosis
when compared to never treated patients (HR = 2.02, CI 1.11–
3.67, Table 3). Patients achieving SVR did not realize appreciable
protection from cirrhosis in these models, although their hazard
ratios trended in that direction. Histological inflammation score
was not predictive of cirrhosis once the cohort was stratified by
baseline fibrosis stage. As expected, age incrementally increased
the cirrhosis risk; for every additional year there was a 5% increase
in the hazard of developing cirrhosis (HR, 1.05 CI 1.01–1.09).
History of blood transfusion prior to 1992 was also associated with
an increased the hazard of cirrhosis (HR 2.04, CI 1.16–3.59).
African American patients were at considerably lower risk of
developing cirrhosis than were Caucasians (HR = 0.47, CI 0.20–
1.10), but this difference did not achieve statistical significance,
probably due to the low number of cirrhosis events among African
Americans. In contrast, Latinos were at greater risk of cirrhosis
compared to Caucasians, but again this increased hazard did not
attain statistical significance (HR = 1.82, CI 0.88–3.77). Neither
BMI, diabetes mellitus, history of heavy alcohol use or lack of
social stability were significantly associated with the hazard of
cirrhosis in univariate models. ALT was not entered into the
Cirrhosis in HCV Nonresponders
PLOS ONE | www.plosone.org 3 April 2013 | Volume 8 | Issue 4 | e61568](https://image.slidesharecdn.com/ceae5641-2220-49d5-91d1-c1bc632fa0e1-161117221936/85/tx-outcomes-POne-0061568-1-3-320.jpg)

![model as it was not a significant predictor of the hazard of
cirrhosis.
Results of multivariate proportional hazards analysis stratified
by pretreatment fibrosis stage in the SFVA cohort are presented in
Table 3. The increased hazard of progression to cirrhosis among
treatment nonresponders relative to never treated patients
remained significant in this model, after adjustment for demo-
graphic and clinical characteristics and the factors that differen-
tiated treated from never treated groups (HR = 2.35, CI 1.18–
4.69). Latino ethnicity now became significantly associated with
cirrhosis (HR = 2.50, CI 1.12–5.56), while African American race
was protective (HR = 0.30, CI 0.13–0.72). Age continued to have
an incremental effect as did BMI. Patients with HCV genotypes 1
or 4 were at increased risk of cirrhosis, even after correcting for the
interaction between genotype and treatment initiation. Restratify-
ing to compare more advanced baseline fibrosis stage 3 against
stages 0–2 and repeating these analyses, we found that treatment
nonresponders continued to exhibit an increased hazard of
cirrhosis compared to never treated patients (HR = 2.95, CI
1.34–6.52, in the multivariate model, data not shown).
Since fibrosis progression is thought to proceed more slowly in
African Americans compared to Caucasian patients with chronic
HCV, we attempted to reanalyze these data separately for African
American and non-African American patient groups [35,36,37].
There were too few cirrhosis events to develop a proportional
hazards model for cirrhosis development using the multivariate
modeling strategy described above, however when using a pre-
fitted model, we found that treatment non-response (HR = 2.05,
CI 0.99–4.26), age (HR = 1.07, CI 1.02–1.12) and BMI
(HR = 1.08, CI 1.02–1.15) were each significant predictors of an
increased hazard of cirrhosis among African Americans (data not
shown).
Finally, as an alternative strategy to account for the inherent
differences between treated and never treated groups, we
Table 2. Risk Factors Characterizing Treated and Untreated Patient Groups (SFVA Cohort).
Variable Total SVR NR Relapse
ETD/
Unknown No Treatment p-value
(N = 358) (N = 69) (N = 49) (N = 22) (N = 19) (N = 199)
History of Heavy Drinking 224 (62.6%) 35 (50.7%) 33 (67.3%) 13 (59.1%) 12 (63.2%) 131 (65.8%) 0.23
Active IDU 19 (5.3%) 1 (1.5%) 1 (2.0%) 0 (0.0%) 1 (5.3%) 16 (8.1%) 0.16*
Active Substance Use (non-IDU) 60 (17.2%) 6 (9.2%) 5 (10.9%) 4 (18.2%) 1 (5.3%) 44 (22.4%) 0.05*
Current Methadone 44 (12.4%) 5 (7.4%) 9 (18.4%) 1 (4.5%) 3 (15.8%) 26 (13.2%) 0.31*
History of Depression 133 (38.0%) 27 (39.7%) 24 (50.0%) 9 (42.9%) 8 (42.1%) 65 (33.5%) 0.45
PTSD 59 (16.9%) 14 (20.6%) 12 (24.5%) 4 (19.0%) 2 (10.5%) 27 (14.0%) 0.43
Social Stability 307 (86.5%) 67 (97.1%) 47 (97.9%) 20 (90.9%) 19 (100.0%) 154 (78.2%) ,0.0001
*P-values were calculated from Fisher’s Exact test.
doi:10.1371/journal.pone.0061568.t002
Figure 1. Cumulative incidence of cirrhosis among SFVA patients with baseline fibrosis stages 2 and 3. Age adjusted proportional
hazards curves indicate that treatment relapsers and nonresponders had a higher incidence of cirrhosis over the study period compared to never
treated patients, but these differences were not statistically significant unadjusted for other risk factors.
doi:10.1371/journal.pone.0061568.g001
Cirrhosis in HCV Nonresponders
PLOS ONE | www.plosone.org 5 April 2013 | Volume 8 | Issue 4 | e61568](https://image.slidesharecdn.com/ceae5641-2220-49d5-91d1-c1bc632fa0e1-161117221936/85/tx-outcomes-POne-0061568-1-5-320.jpg)

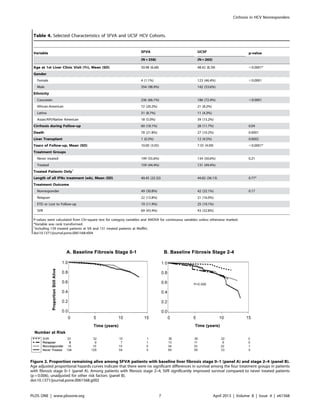
![and HR = 0.51, CI 0.26–0.98, respectively, Table 5). The hazard
ratio for treatment relapsers also tended toward protection, but did
not achieve significance. Older age at baseline liver biopsy, Latino
ethnicity, heavy alcohol use, and prior blood transfusion each
significantly increased the hazard of death during follow-up in
univariate models (Table 5). After adjusting for psychosocial and
clinical risk factors in multivariate proportional hazards analysis,
SVR patients and relapsers each had a significant survival
advantage (HR = 0.23, CI 0.07–0.75 and HR = 0.11, CI 0.01–
0.95, respectively) compared to never treated patients. While the
hazard ratio for nonresponders tended toward protection, it did
not achieve statistical significance. Substituting propensity scores
for individual psychosocial risk factors did not affect the
directionality or significance of the hazard ratios for the major
predictors in time-to-death analysis (data not shown).
Time-to-death or liver transplantation analyses were repeated
for the UCSF cohort. Proportionally fewer UCSF patients died
and more underwent liver transplantation than SFVA patients
(Table 4). We examined the proportion remaining alive among
UCSF patients with baseline liver fibrosis stage 0–1 and stage 2–4
in age adjusted proportional hazards curves (Figure S2, panels A
and B, respectively). There were no deaths among treated patients
with baseline fibrosis stage 0–1 (panel A). Among patients with
baseline fibrosis stage 2–4, a greater proportion of relapsers and
never treated patients died during follow-up compared with either
SVR or nonresponder patients, but these differences were not
statistically significant (panel B). In univariate proportional
hazards models, stratified by baseline fibrosis stage, patients
achieving SVR had a marginally significant reduction in death
compared to never treated patients (HR = 0.24, CI 0.05–1.06,
Table S4). This advantage did not extend to either nonresponders
or relapsers. Incremental increases in baseline age were also
contributory (HR = 1.07, CI 1.02–1.12, Table S4). In multivariate
survival analysis, however, no risk factors achieved statistical
significance.
Discussion
The present study measured long-term outcomes in patients
with chronic HCV in two independent cohorts followed over the
course of 7.7 to 10 years. Cohort patients were heterogeneous with
regard to demographic and psychosocial characteristics, repre-
senting typical clinical practice, and data collection methods were
optimized to maximize validity and measure known confounders.
Unlike previously published studies, SVR was not associated with
significant protection against cirrhosis in either cohort, even after
stratifying for baseline levels of liver fibrosis and adjusting for liver
inflammation [16,17,38,39,40]. Surprisingly, we found that the
hazard of cirrhosis among treatment nonresponders was more
than twice that of never treated patients in both cohorts. These
results persisted after adjustment for clinical and psychosocial risk
factors using two alternative adjustment strategies. Also, unlike
previous studies, neither baseline ALT level nor change in ALT
before and after completion of treatment was associated with
progression to cirrhosis.
Although our study is not intended to identify an explanatory
mechanism for this finding, it raises the question of whether
hepatic inflammation and fibrosis could be increased by
immunostimulatory IFNa-based antiviral therapies in cases where
HCV is not eradicated. IFNa/RBV can trigger broad and robust
antiviral T cell responses, which are beneficial when they result in
SVR, but might contribute to worsened inflammation and scarring
(cirrhosis) in the continued presence of viral antigens
[41,42,43,44]. Lower rates of both cirrhosis and SVR among
African Americans illustrate the point that lower inflammatory
responses may be favorable in certain circumstances [35,37].
Further research is needed to explore this possibility.
The long-term effects of IFNa-based anti-HCV treatment on
liver disease progression in noncirrhotic patients have been
difficult to quantify from previous studies. In a meta-analysis of
HCV cohort studies with greater than one year of follow-up,
Table 5. Predictors of Death or Liver Transplant Stratified by Fibrosis Stage (SFVA Cohort, N = 358)*.
Characteristics` Univariate Model Multivariate Model
HR{
(95% CI) HR{
(95% CI)
Treatment Outcome
SVR 0.24 (0.10–0.58) 0.23 (0.07–0.75)
Nonresponder 0.51 (0.26–0.98) 0.56 (0.24–1.32)
Relapser 0.48 (0.17–1.35) 0.11 (0.01–0.95)
ETD or Lost to Follow-up 1.32 (0.59–2.94) 1.44 (0.52–4.03)
Never Treated ref Ref
Age at 1st liver clinic visit-per year increase 1.08 (1.05–1.12) 1.1 (1.06–1.15)
Race
African American 1.07 (0.59–1.97) 0.43 (0.20–0.93)
Latino 1.89 (1.00–3.57) 1.73 (0.74–4.02)
Asian/API/Native American 0.25 (0.03–1.82) 0.5 (0.07–3.77)
Caucasian ref Ref
BMI–per unit increase 1.02 (0.97–1.06) 1.07 (1.02–1.12)
History of Active Alcohol Abuse 1.67 (1.01–2.75) 1.82 (0.99–3.35)
Transfusion before 1992 1.66 (0.97–2.82) 3.36 (1.20–9.44)
*Cox Proportional Hazards Models.
{
Hazard Ratio (HR) calculated using Cox Proportional Hazards Modeling.
`
Interaction terms not shown.
doi:10.1371/journal.pone.0061568.t005
Cirrhosis in HCV Nonresponders
PLOS ONE | www.plosone.org 8 April 2013 | Volume 8 | Issue 4 | e61568](https://image.slidesharecdn.com/ceae5641-2220-49d5-91d1-c1bc632fa0e1-161117221936/85/tx-outcomes-POne-0061568-1-8-320.jpg)
![nearly 70% tracked subjects for less than seven years, whereas the
mean duration of follow-up among patients in our SFVA cohort
was 10 years [40]. Few previous studies have specifically compared
the experience of treated patients to those who were never treated,
and none specifically explored the hypothesis that failed IFNa-
based treatment could increase the long-term risk of cirrhosis
[38,45].
In recent years, there has been an emphasis on studies of IFNa-
based retreatment in previous nonresponders and relapsers and
their outcomes compared to those achieving SVR [46,47]. The
most notable of these were the HALT-C and EPIC3
trials which
enrolled previously treated patients with advanced fibrosis. These
two prospective studies examined histologic effects of low dose
maintenance pegylated IFNa in prior HCV treatment failures
with METAVIR F2 and F3 fibrosis at study initiation [48].
Patients were randomized to low dose maintenance pegylated
IFNa therapy or observation and assessed for fibrosis response
using repeat liver biopsies after a mean interval of 3.7 years.
Results from the EPIC3
study showed no statistically significant
differences between METAVIR fibrosis scores of the treated and
observation groups at the end of the study period [48]. HALT-C
investigators extended the study for up to an 8 year period of
observation and found that the annual rate of initial liver-related
complications was higher among the pegylated IFNa group than
among the controls [49]. Moreover, histologic features on
sequential liver biopsies led the HALT-C investigators to speculate
that pegylated IFNa might be associated with a long-term
worsening of liver related morbidity in treatment nonresponders
and in excess mortality among those with advanced liver disease
[50].
In one of the few large-scale studies to compare outcomes
between IFNa treated and untreated patients, the Japanese IHIT
Study Group followed patients who had been previously treated
with IFNa monotherapy over a median period of 3.7 years, using
paired biopsies to compare liver fibrosis progression among SVR
patients, patients without SVR and untreated patients, stratified by
fibrosis stage at initial biopsy [51,52]. Among patients with initial
METAVIR F2 or F3 fibrosis, a post hoc analysis of primary data
presented in this report found no significant difference in cirrhosis
development among patients without SVR and untreated patients
[51]. None of the patients with initial F2 or F3 fibrosis who
achieved SVR developed cirrhosis. These data suggest that failed
therapy may not increase the risk of cirrhosis during intermediate
(3–5 year) follow-up.
Unlike the patients in the Japanese cohort, the majority of our
patients were treated with IFNa/RBV combination therapy,
rather than with IFNa monotherapy, and our follow-up period
was more than twice as long. Our study included few Asian
patients, who have a higher probability of achieving SVR, but also
are more likely to progress to cirrhosis [28]. Our finding that
treatment failures have an increased long-term hazard of cirrhosis
is thus neither directly supported nor contradicted by this or any
other published report.
Previously published studies also found that never treated HCV
patients had a greater mortality risk than patients who achieve
SVR, and in some cases, those who fail treatment [38,52]. In
another IHIT study, Yoshida et al. found that the overall risk of
death was reduced among IFNa treated patients, including
treatment nonresponders, as compared to patients not receiving
treatment [52]. Their multivariate Cox proportional hazards
models were adjusted by gender, age and IFNa therapy outcome.
When survival analysis was further stratified by cirrhotic and
noncirrhotic patients, IFNa therapy was associated with improved
survival among the noncirrhotic patients only [52]. A recent
Cochrane Review of seven trials, including the HALT-C and
EPIC3
studies, found a significant increase in all-cause mortality in
IFNa maintenance patients and concluded that patients with
severe fibrosis who failed previous IFNa treatment did not derive a
survival benefit from further therapy with pegylated IFNa [46].
These studies did not assess the effects of clinical and behavioral
risk factors on liver disease outcomes as comprehensively as ours
did. Our multivariate time-to-death analyses reveal that, even
though nonresponders had more than twice the hazard of
cirrhosis, their survival was not significantly different from that
of never treated patients. The effects of cirrhosis on survival in our
cohort may be offset by the relatively younger age and more
beneficial clinical and psychosocial risk factor profile of nonre-
sponders compared with never treated patients. Our findings
suggest that some previously reported benefits of therapy among
treatment failures might be attributable to the lower concomitant
risks associated with treatment candidacy, rather than to disease
modifying benefits of pharmacologic therapy [38,52].
As is the case in most nonrandomized studies, the presence of
bias by indication can be difficult to resolve [53,54]. We were
especially concerned about confounding from risk factors that
independently could promote the development of cirrhosis among
patients with HCV and also influence the decision whether or not
to initiate antiviral therapy. We carefully assessed an array of
clinical and psychosocial risk factors and, not unexpectedly, found
that never treated patients were older, more likely to engage in
ongoing alcohol or other substance abuse, and to experience social
instability compared with treatment nonresponders. We speculat-
ed that differing biobehavioral risk profiles were unlikely to
account for the reduced incidence of cirrhosis in untreated patients
since many of these would be predicted to increase, rather than
reduce fibrosis progression. We used two alternative strategies to
statistically adjust for these potential confounders in our Cox
proportional hazards models [27]. Using either adjustment
method, treatment nonresponders were found to have a signifi-
cantly greater hazard of developing cirrhosis than the never
treated group–a finding that was observed in the both the SFVA
and UCSF cohorts. Some differences between treated and never
treated patients were identified that could not be completely
corrected in our statistical models. Treated patients were followed
for approximately 1.5 years longer than never treated patients and
had, on average, one additional diagnostic procedure. Both the
duration of follow-up and the number of diagnostic procedures
were entered into predictive models, but were not found to be
confounders for either outcome (time-to-cirrhosis or time-to-
death). It is still possible that unmeasured confounding factors
linked to treatment failure may have biased the results, but
rigorous data collection, robust statistical methods, and the
stability of a significant hazard ratio for cirrhosis among
nonresponders in both cohorts make a compelling case for the
validity of these findings. Furthermore the congruence of the
findings from two diverse patient populations–the SFVA cohort
comprised of comparably aged veterans with similar risk behavior
histories and the more demographically diverse UCSF cohort–
suggest that these results may be generalizable.
Our results suggest the possibility that treatment with IFNa-
based regimens without viral clearance may be associated with
progressive liver disease. Although these data reflect the long-term
outcomes for two entire patient cohorts at independent institu-
tions, they should be interpreted with caution as they are derived
from retrospective chart reviews. If confirmed, these results make a
compelling case for the enhanced use of sensitive diagnostic and
predictive tools, including recently described genetic tests, to
identify patients most likely to benefit from IFNa-based treatment
Cirrhosis in HCV Nonresponders
PLOS ONE | www.plosone.org 9 April 2013 | Volume 8 | Issue 4 | e61568](https://image.slidesharecdn.com/ceae5641-2220-49d5-91d1-c1bc632fa0e1-161117221936/85/tx-outcomes-POne-0061568-1-9-320.jpg)
![[36,55]. Moreover, the potential for adverse outcomes should be
considered in current and future studies examining HCV
treatment using pegylated-IFNa/RBV in combination with newer
agents such as HCV protease inhibitors, as a substantial
proportion of null or partial responders with advanced fibrosis
will emerge from these treatment groups. In particular, it may be
advisable not to retreat these patients with IFNa, but to keep them
under observation until IFNa-free regimens are available.
Supporting Information
Figure S1 Cumulative incidence of cirrhosis among
UCSF patients with baseline fibrosis stages 2 and 3.
Age adjusted proportional hazards curves indicate that there were
no differences in the incidence of cirrhosis among treatment
groups, unadjusted for other risk factors.
(TIF)
Figure S2 Proportion remaining alive among UCSF patients
with baseline liver fibrosis stage 0–1 (panel A) and stage 2–4 (panel
B). Age adjusted proportional hazards curves indicate that there
were no deaths among treated patients with baseline fibrosis stage
0–1 (panel A). Amongst patients with baseline fibrosis stage 2–4,
relapsers and never treated a greater proportion died during
follow-up than among SVR and nonresponders patients, but these
differences were not statistically significant.
(TIF)
Table S1 Demographic and Clinical Characteristics of
the UCSF Cohort.
(DOC)
Table S2 Risk Factors of Treated and Untreated Patient
Groups (UCSF Cohort).
(DOC)
Table S3 Predictors of Development of Cirrhosis Strat-
ified by Fibrosis Stage (UCSF Cohort).
(DOC)
Table S4 Predictors of Death or Liver Transplant
Stratified by Fibrosis Stage (UCSF Cohort).
(DOC)
Statistical Methods S1 Details of Construction and
Reduction of Statistical Models.
(DOC)
Replication Cohort S1 UCSF Medical Center Liver
Clinic.
(DOC)
Acknowledgments
Sally George, RN, and Amit Arunkumar, BS, for assistance with data
collection. Teresa Wright, MD, for her expert care and treatment of
patients in this study. Peter Bacchetti, PhD, for consultation on
biostatistical methods, and Kenneth R. McQuaid, MD, for his encour-
agement and intellectual guidance.
Author Contributions
Conceived and designed the experiments: MLC JCR AM. Performed the
experiments: MLC JCR HS ES RMY RL RW AM. Analyzed the data: HS
MLC JCR RL AM. Contributed reagents/materials/analysis tools: HS
MLC. Wrote the paper: MLC JCR AM.
References
1. Armstrong GL, Wasley A, Simard EP, McQuillan GM, Kuhnert WL, et al.
(2006) The prevalence of hepatitis C virus infection in the United States, 1999
through 2002. Ann Intern Med 144: 705–714.
2. Bialek SR, Terrault NA (2006) The changing epidemiology and natural history
of hepatitis C virus infection. Clin Liver Dis 10: 697–715.
3. Hoofnagle JH, Seeff LB (2006) Peginterferon and ribavirin for chronic hepatitis
C. N Engl J Med 355: 2444–2451.
4. McHutchison JG, Gordon SC, Schiff ER, Shiffman ML, Lee WM, et al. (1998)
Interferon alfa-2b alone or in combination with ribavirin as initial treatment for
chronic hepatitis C. Hepatitis Interventional Therapy Group. N Engl J Med
339: 1485–1492.
5. McHutchison JG, Manns M, Patel K, Poynard T, Lindsay KL, et al. (2002)
Adherence to combination therapy enhances sustained response in genotype-1-
infected patients with chronic hepatitis C. Gastroenterology 123: 1061–1069.
6. Yee HS, Chang MF, Pocha C, Lim J, Ross D, et al. (2012) Update on the
management and treatment of hepatitis C virus infection: recommendations
from the Department of Veterans Affairs Hepatitis C Resource Center Program
and the National Hepatitis C Program Office. Am J Gastroenterol 107: 669–
689; quiz 690.
7. Jacobson IM, McHutchison JG, Dusheiko G, Di Bisceglie AM, Reddy KR, et al.
(2011) Telaprevir for previously untreated chronic hepatitis C virus infection.
N Engl J Med 364: 2405–2416.
8. Pawlotsky JM (2011) The results of Phase III clinical trials with telaprevir and
boceprevir presented at the Liver Meeting 2010: a new standard of care for
hepatitis C virus genotype 1 infection, but with issues still pending.
Gastroenterology 140: 746–754.
9. Poordad F, McCone J, Bacon BR, Bruno S, Manns MP, et al. (2011) Boceprevir
for untreated chronic HCV genotype 1 infection. N Engl J Med 364: 1195–
1206.
10. Heathcote EJ, Shiffman ML, Cooksley WG, Dusheiko GM, Lee SS, et al. (2000)
Peginterferon alfa-2a in patients with chronic hepatitis C and cirrhosis.
N Engl J Med 343: 1673–1680.
11. Poynard T, McHutchison J, Manns M, Trepo C, Lindsay K, et al. (2002) Impact
of pegylated interferon alfa-2b and ribavirin on liver fibrosis in patients with
chronic hepatitis C. Gastroenterology 122: 1303–1313.
12. Shiffman ML, Hofmann CM, Thompson EB, Ferreira-Gonzalez A, Contos MJ,
et al. (1997) Relationship between biochemical, virological, and histological
response during interferon treatment of chronic hepatitis C. Hepatology 26:
780–785.
13. Mallat A, Preaux AM, Blazejewski S, Rosenbaum J, Dhumeaux D, et al. (1995)
Interferon alfa and gamma inhibit proliferation and collagen synthesis of human
Ito cells in culture. Hepatology 21: 1003–1010.
14. Goodman ZD, Stoddard AM, Bonkovsky HL, Fontana RJ, Ghany MG, et al.
(2009) Fibrosis progression in chronic hepatitis C: morphometric image analysis
in the HALT-C trial. Hepatology 50: 1738–1749.
15. Pockros PJ, Hamzeh FM, Martin P, Lentz E, Zhou X, et al. (2010) Histologic
outcomes in hepatitis C-infected patients with varying degrees of virologic
response to interferon-based treatments. Hepatology 52: 1193–1200.
16. Shiffman ML, Hofmann CM, Contos MJ, Luketic VA, Sanyal AJ, et al. (1999) A
randomized, controlled trial of maintenance interferon therapy for patients with
chronic hepatitis C virus and persistent viremia. Gastroenterology 117: 1164–
1172.
17. Poynard T, McHutchison J, Davis GL, Esteban-Mur R, Goodman Z, et al.
(2000) Impact of interferon alfa-2b and ribavirin on progression of liver fibrosis
in patients with chronic hepatitis C. Hepatology 32: 1131–1137.
18. Shiratori Y, Ito Y, Yokosuka O, Imazeki F, Nakata R, et al. (2005) Antiviral
therapy for cirrhotic hepatitis C: association with reduced hepatocellular
carcinoma development and improved survival. Ann Intern Med 142: 105–114.
19. Poynard T, Bruix J, Schiff ER, Diago M, Berg T, et al. (2012) Improved
inflammatory activity with peginterferon alfa-2b maintenance therapy in non-
cirrhotic prior non-responders: A randomized study. J Hepatol.
20. Dienstag JL, Ghany MG, Morgan TR, Di Bisceglie AM, Bonkovsky HL, et al.
(2011) A prospective study of the rate of progression in compensated,
histologically advanced chronic hepatitis C. Hepatology 54: 396–405.
21. Bruce-Chwatt LJ (1965) Declaration of Helsinki. Recommendations Guiding
Doctors in Clinical Research. WHO Chron 19: 31–32.
22. Seeff LB (2002) Natural history of chronic hepatitis C. Hepatology 36: S35–46.
23. Harris DR, Gonin R, Alter HJ, Wright EC, Buskell ZJ, et al. (2001) The
relationship of acute transfusion-associated hepatitis to the development of
cirrhosis in the presence of alcohol abuse. Ann Intern Med 134: 120–124.
24. Batts KP, Ludwig J (1995) Chronic hepatitis. An update on terminology and
reporting. Am J Surg Pathol 19: 1409–1417.
25. Brunt EM (2000) Grading and staging the histopathological lesions of chronic
hepatitis: the Knodell histology activity index and beyond. Hepatology 31: 241–
246.
26. Sofair AN, Barry V, Manos MM, Thomas A, Zaman A, et al. (2009) The
epidemiology and clinical characteristics of patients with newly diagnosed
alcohol-related liver disease: results from population-based surveillance. J Clin
Gastroenterol 44: 301–307.
Cirrhosis in HCV Nonresponders
PLOS ONE | www.plosone.org 10 April 2013 | Volume 8 | Issue 4 | e61568](https://image.slidesharecdn.com/ceae5641-2220-49d5-91d1-c1bc632fa0e1-161117221936/85/tx-outcomes-POne-0061568-1-10-320.jpg)