THE
F-TEST
(Two-Way ANOVA withInteraction Effect)
Reporter : ASHLEY I. LINDONGAN
ED.702: STATISTICAL MODELLING & ANALYSIS FOR
DECISION-MAKING
Professor : DR. TARHATA S. GUIAMALON
2.
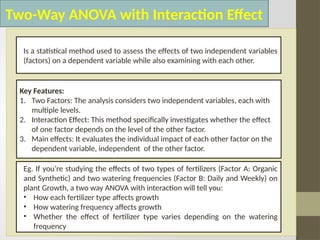
Two-Way ANOVA withInteraction Effect
Is a statistical method used to assess the effects of two independent variables
(factors) on a dependent variable while also examining with each other.
Key Features:
1. Two Factors: The analysis considers two independent variables, each with
multiple levels.
2. Interaction Effect: This method specifically investigates whether the effect
of one factor depends on the level of the other factor.
3. Main effects: It evaluates the individual impact of each other factor on the
dependent variable, independent of the other factor.
Eg. If you’re studying the effects of two types of fertilizers (Factor A: Organic
and Synthetic) and two watering frequencies (Factor B: Daily and Weekly) on
plant Growth, a two way ANOVA with interaction will tell you:
• How each fertilizer type affects growth
• How watering frequency affects growth
• Whether the effect of fertilizer type varies depending on the watering
frequency
3.
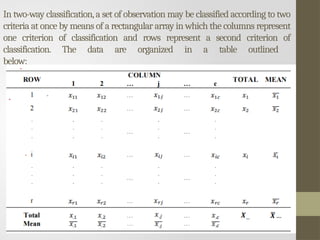
In two-way classification,aset of observation may be classified according to two
criteria at once by means of a rectangular array in which the columns represent
one criterion of classification and rows represent a second criterion of
classification. The data are organized in a table outlined
below:
4.
Two-Way ANOVA withinteraction Effect
Example 1. Forty five language students were
randomly assigned to one of three instructors
and to one of the three methods of teaching.
Achievement was measured on a test
administered at the end of the term. Use two
way ANOVA with interaction effect at .05 level of
significance to test the hypotheses.
5.
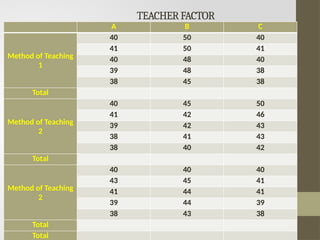
A B C
Methodof Teaching
1
40 50 40
41 50 41
40 48 40
39 48 38
38 45 38
Total
Method of Teaching
2
40 45 50
41 42 46
39 42 43
38 41 43
38 40 42
Total
Method of Teaching
2
40 40 40
43 45 41
41 44 41
39 44 39
38 43 38
Total
Total
TEACHERFACTOR
6.
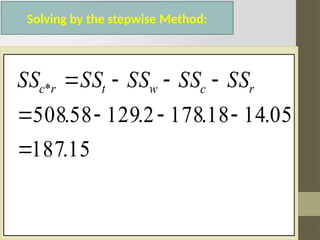
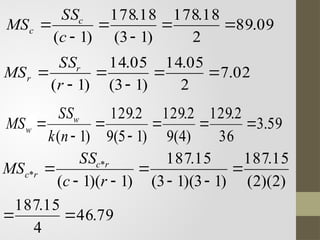
Solving by thestepwise Method:
I. Problem:
1. Is there a significant difference in the performance of
students under three different teachers?
2. Is there a significant difference in the performance of
students under the three different methods of teaching?
3.Is there an interaction effect between teachers and
method of teaching factors?
7.
Solving by thestepwise Method:
II. Hypotheses :
1. H0: There is no significant difference in the performance of the three
groups of students under three different instructors.
H1:There is a significant difference in the performance of the three
groups of students under three different instructors.
2. H0: There is no significant difference in the performance of the three
groups of students under three different methods of teaching.
H1: There is a significant difference in the performance of the three
groups of students under three different methods of teaching.
3. H0: Interaction effects are not present.
H1: Interaction effects are present.
8.
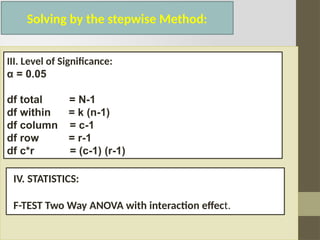
Solving by thestepwise Method:
III. Level of Significance:
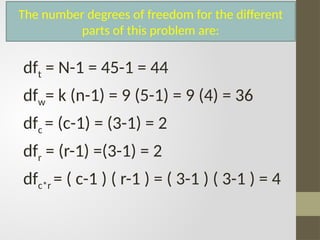
α = 0.05
df total = N-1
df within = k (n-1)
df column = c-1
df row = r-1
df c*r = (c-1) (r-1)
IV. STATISTICS:
F-TEST Two Way ANOVA with interaction effect.
9.
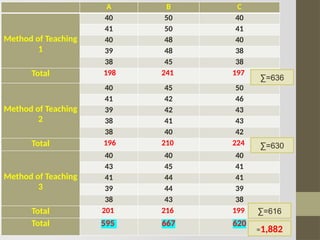
A B C
Methodof Teaching
1
40 50 40
41 50 41
40 48 40
39 48 38
38 45 38
Total 198 241 197
Method of Teaching
2
40 45 50
41 42 46
39 42 43
38 41 43
38 40 42
Total 196 210 224
Method of Teaching
3
40 40 40
43 45 41
41 44 41
39 44 39
38 43 38
Total 201 216 199
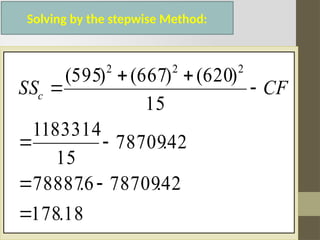
Total 595 667 620
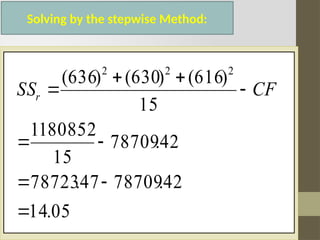
∑=636
∑=630
∑=616
=1,882
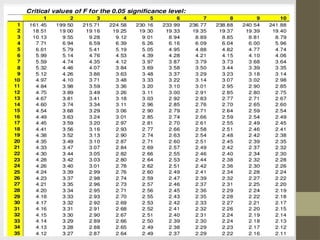
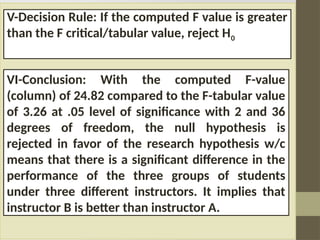
V-Decision Rule: Ifthe computed F value is greater
than the F critical/tabular value, reject H0
VI-Conclusion: With the computed F-value
(column) of 24.82 compared to the F-tabular value
of 3.26 at .05 level of significance with 2 and 36
degrees of freedom, the null hypothesis is
rejected in favor of the research hypothesis w/c
means that there is a significant difference in the
performance of the three groups of students
under three different instructors. It implies that
instructor B is better than instructor A.
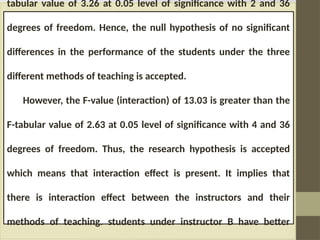
22.
tabular value of3.26 at 0.05 level of significance with 2 and 36
degrees of freedom. Hence, the null hypothesis of no significant
differences in the performance of the students under the three
different methods of teaching is accepted.
However, the F-value (interaction) of 13.03 is greater than the
F-tabular value of 2.63 at 0.05 level of significance with 4 and 36
degrees of freedom. Thus, the research hypothesis is accepted
which means that interaction effect is present. It implies that
there is interaction effect between the instructors and their
methods of teaching. students under instructor B have better