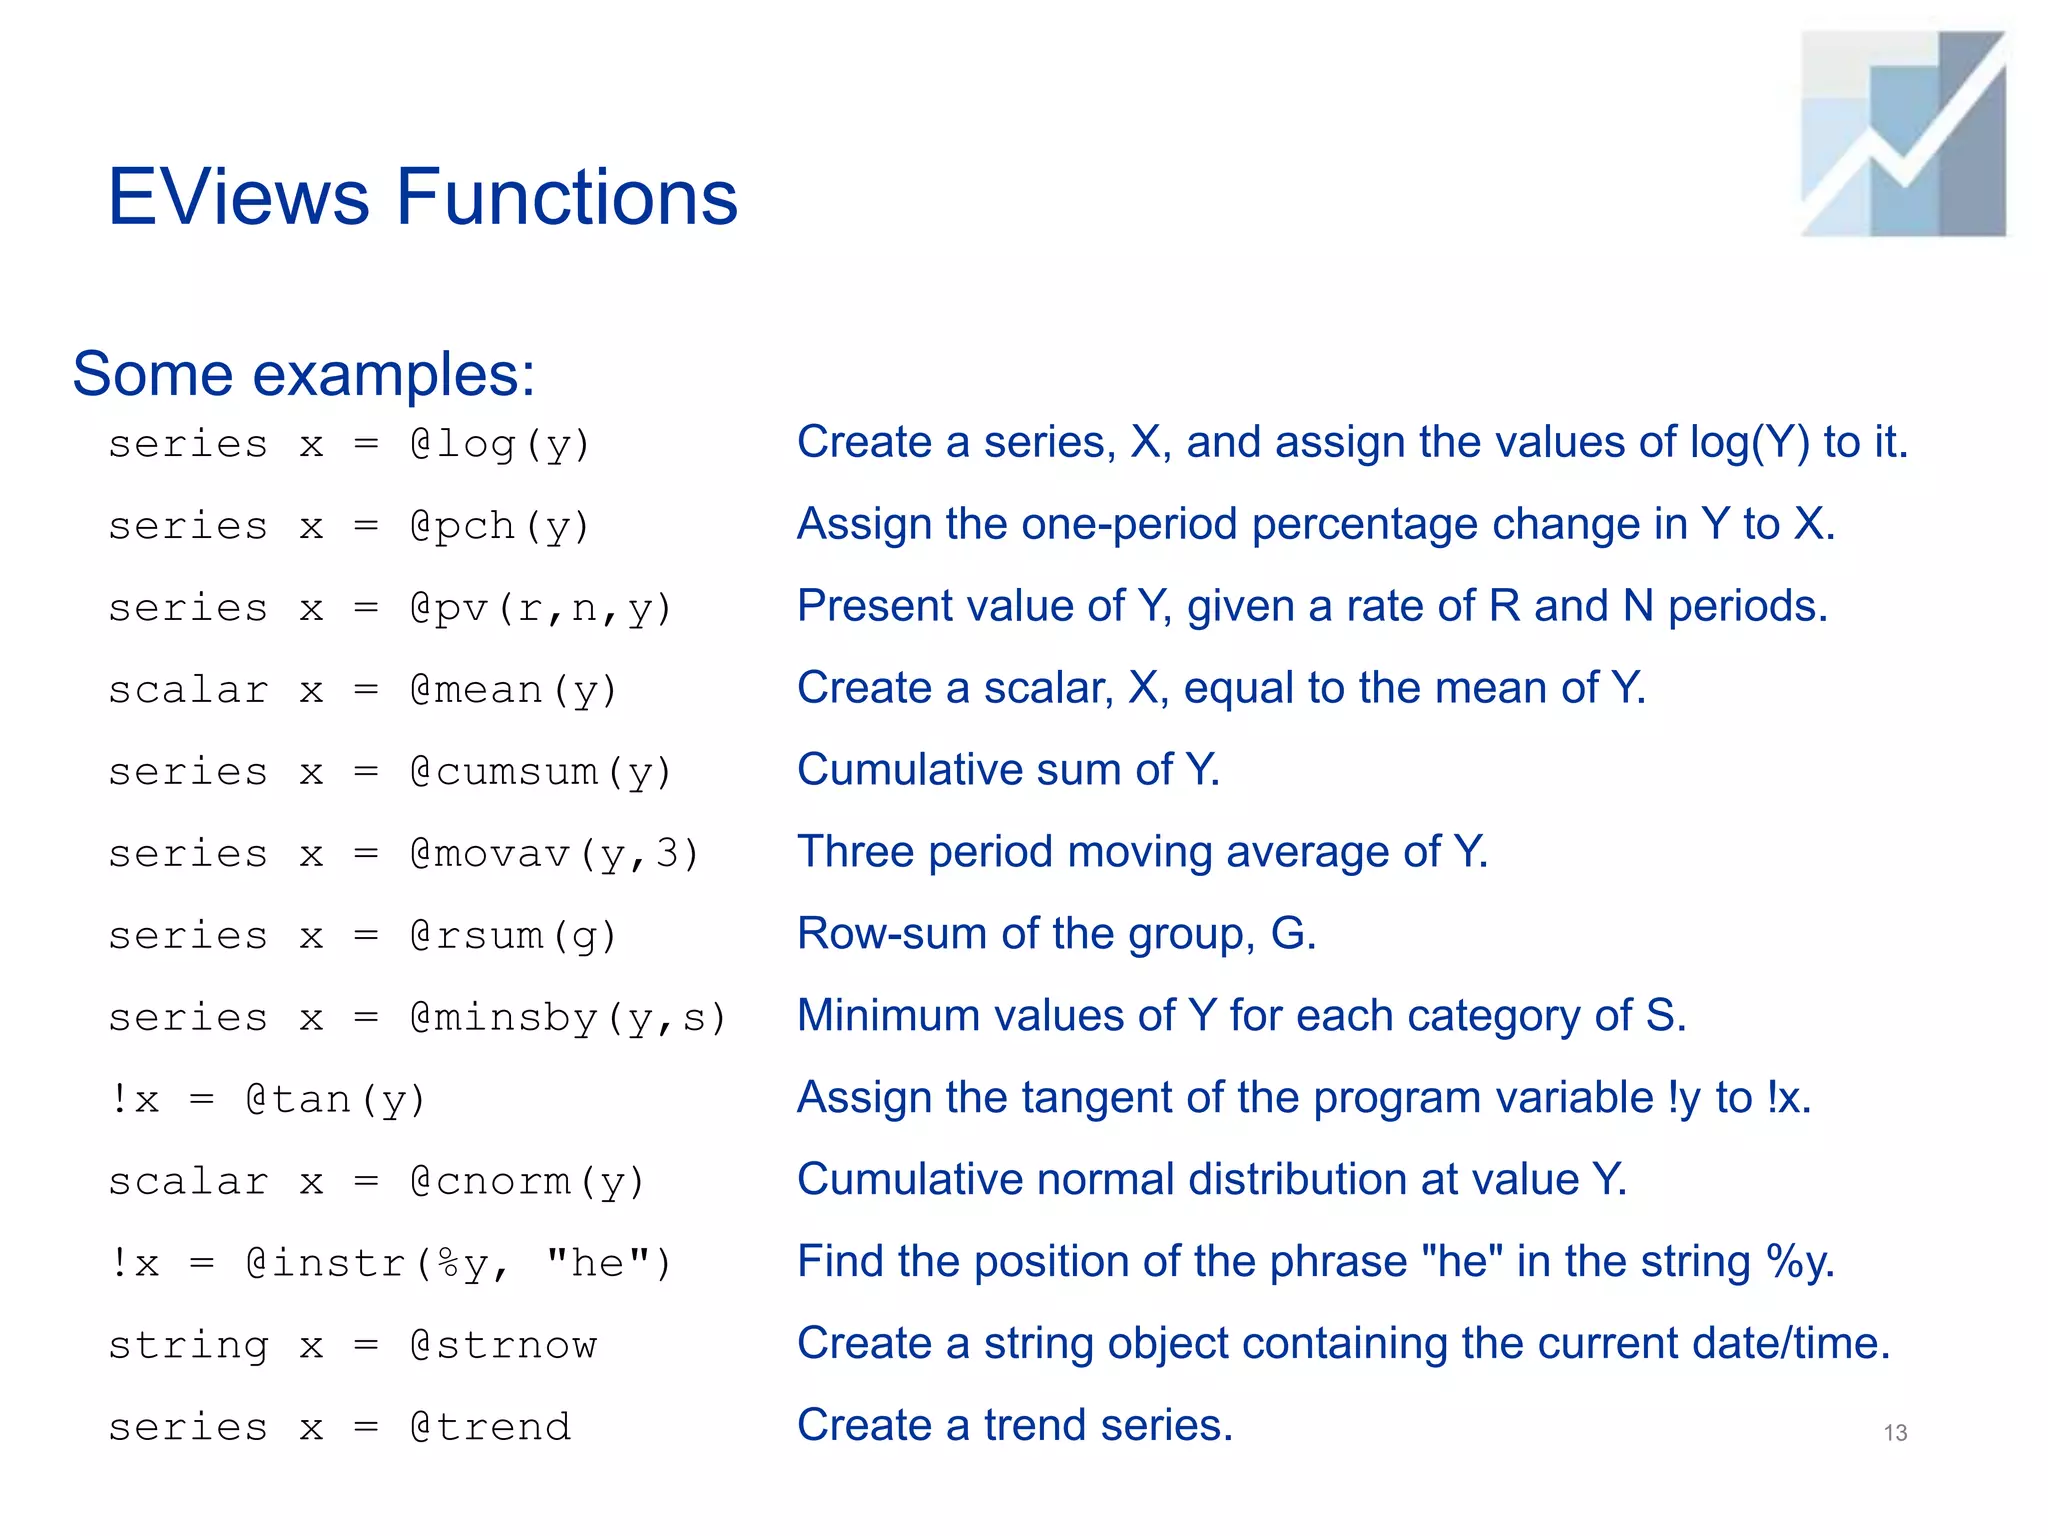
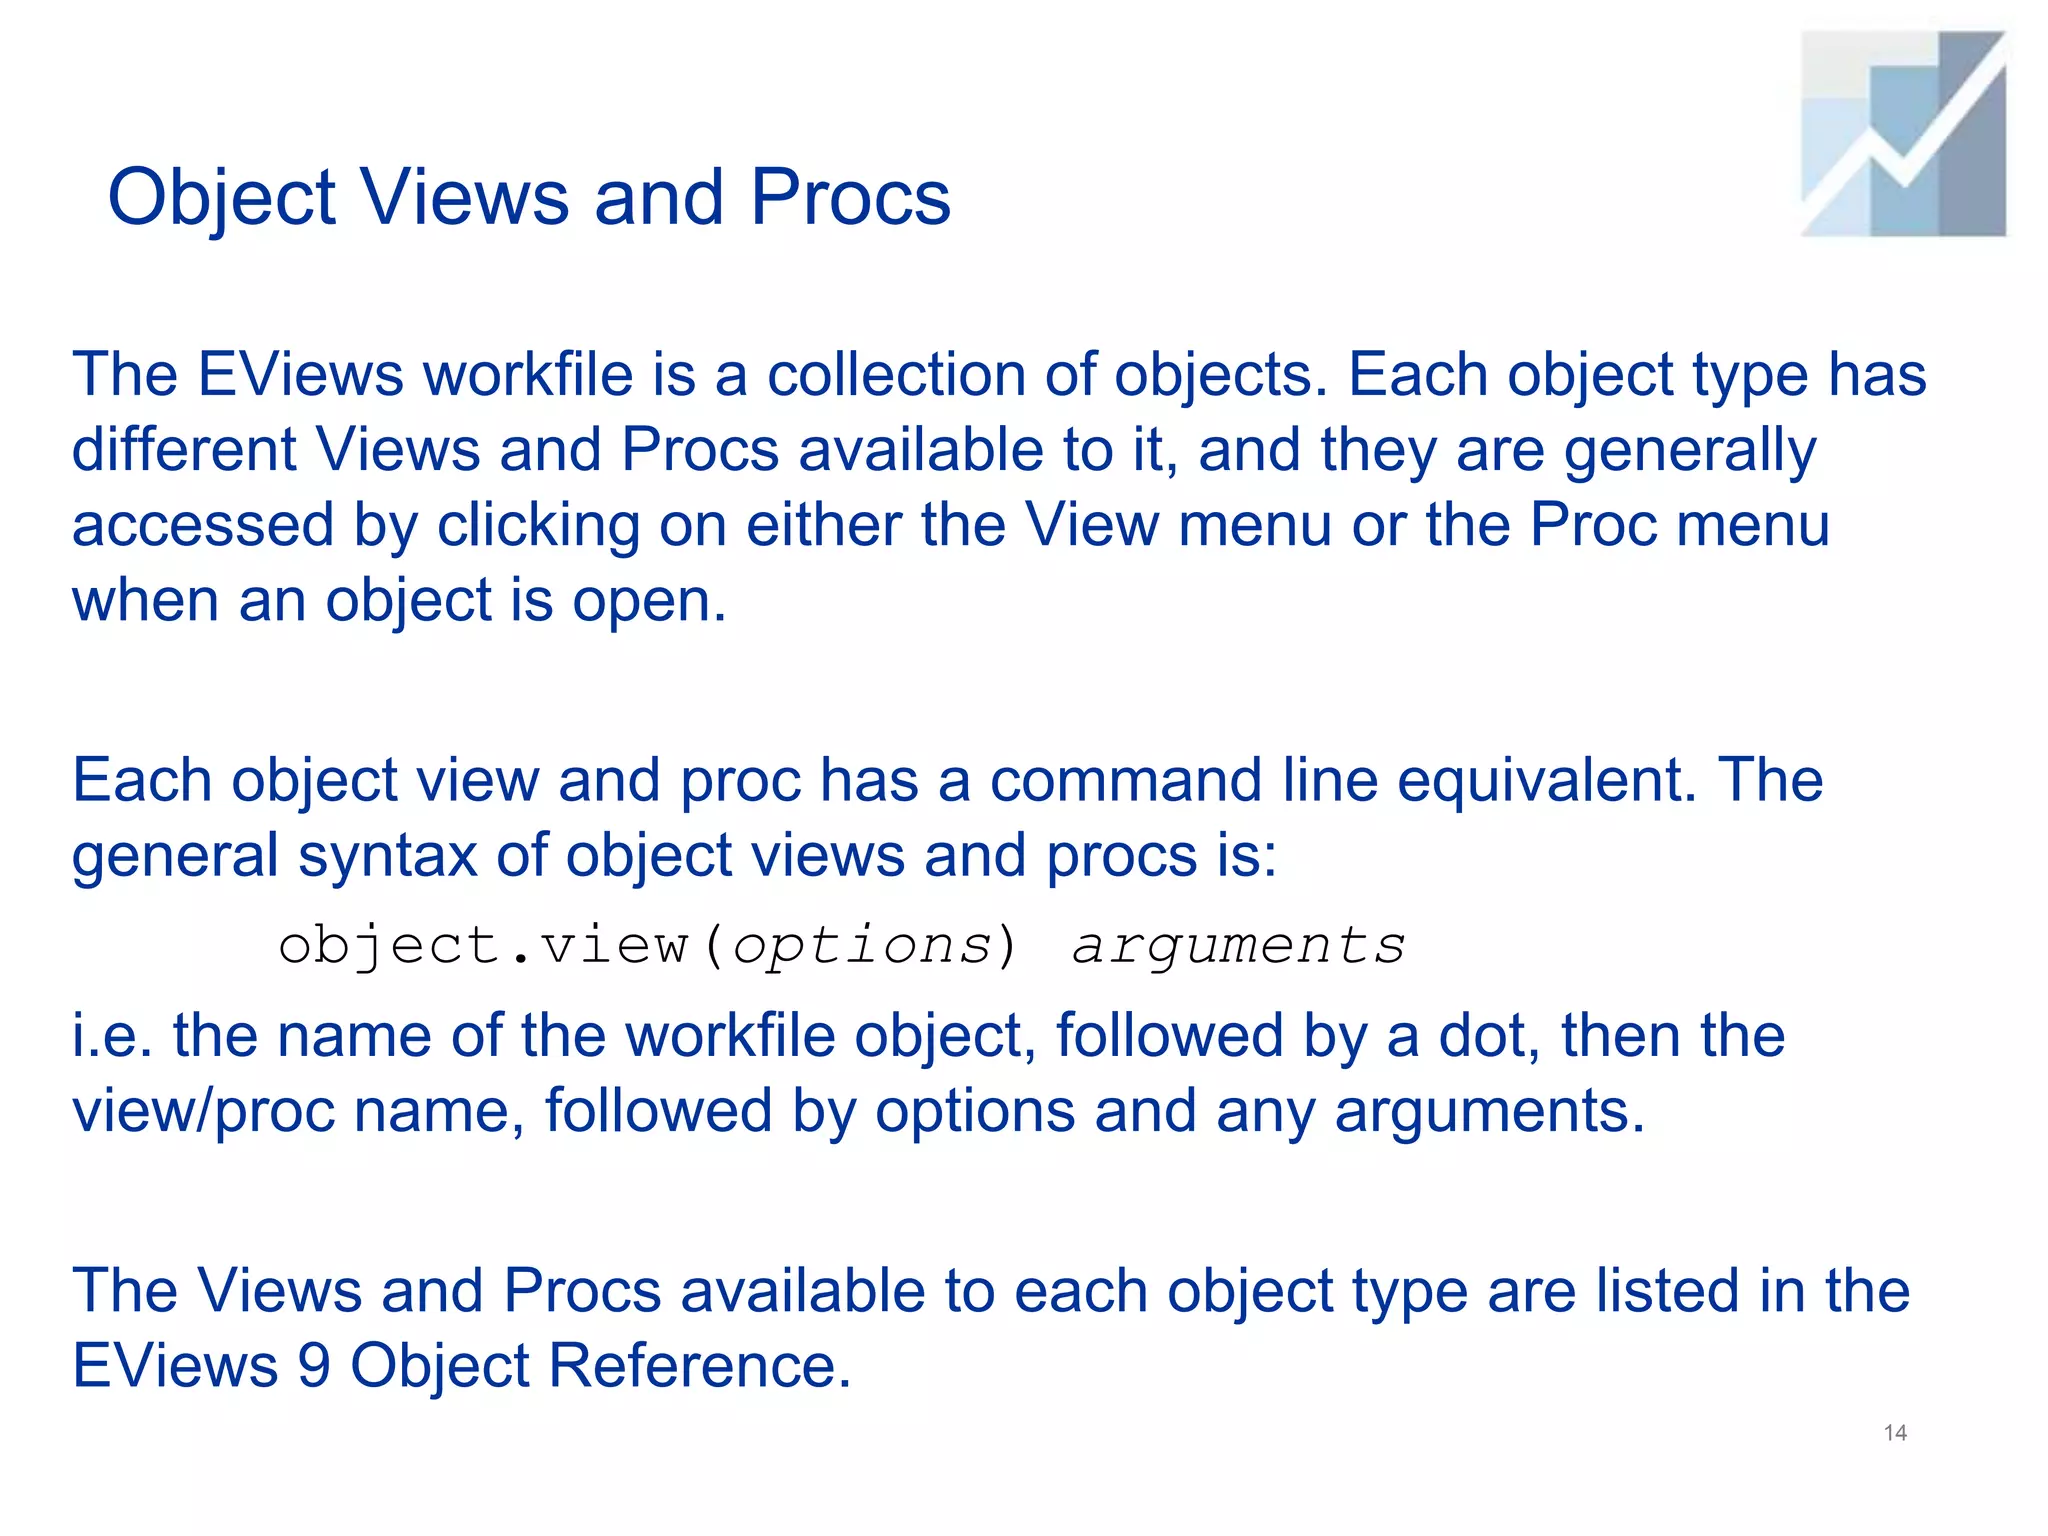
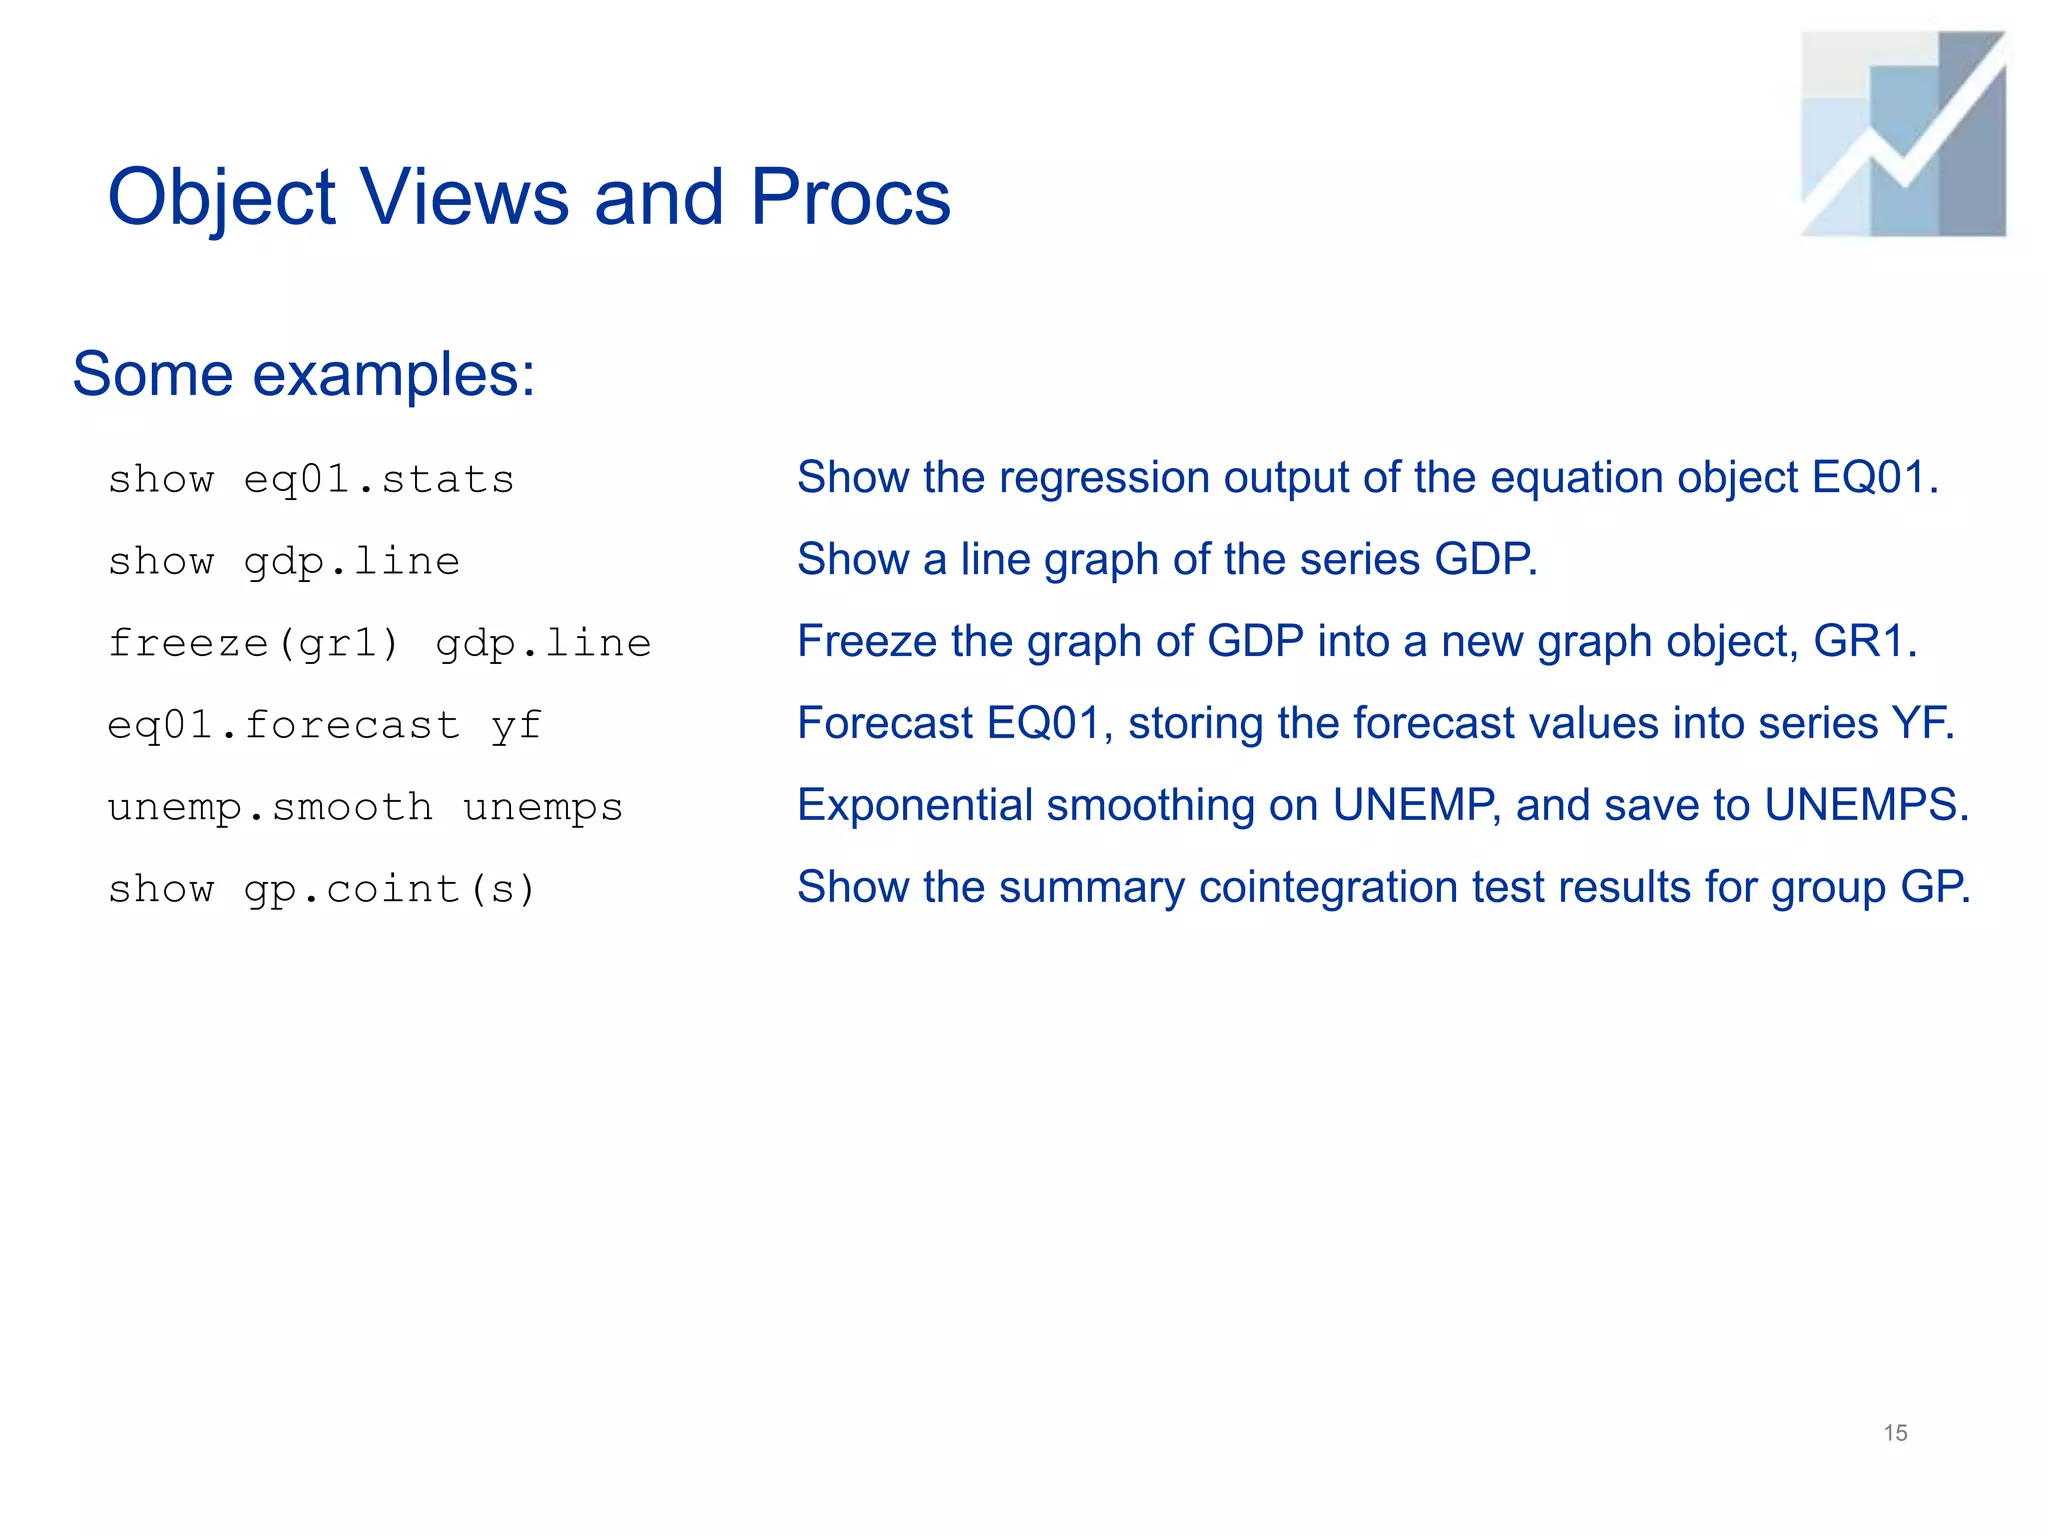
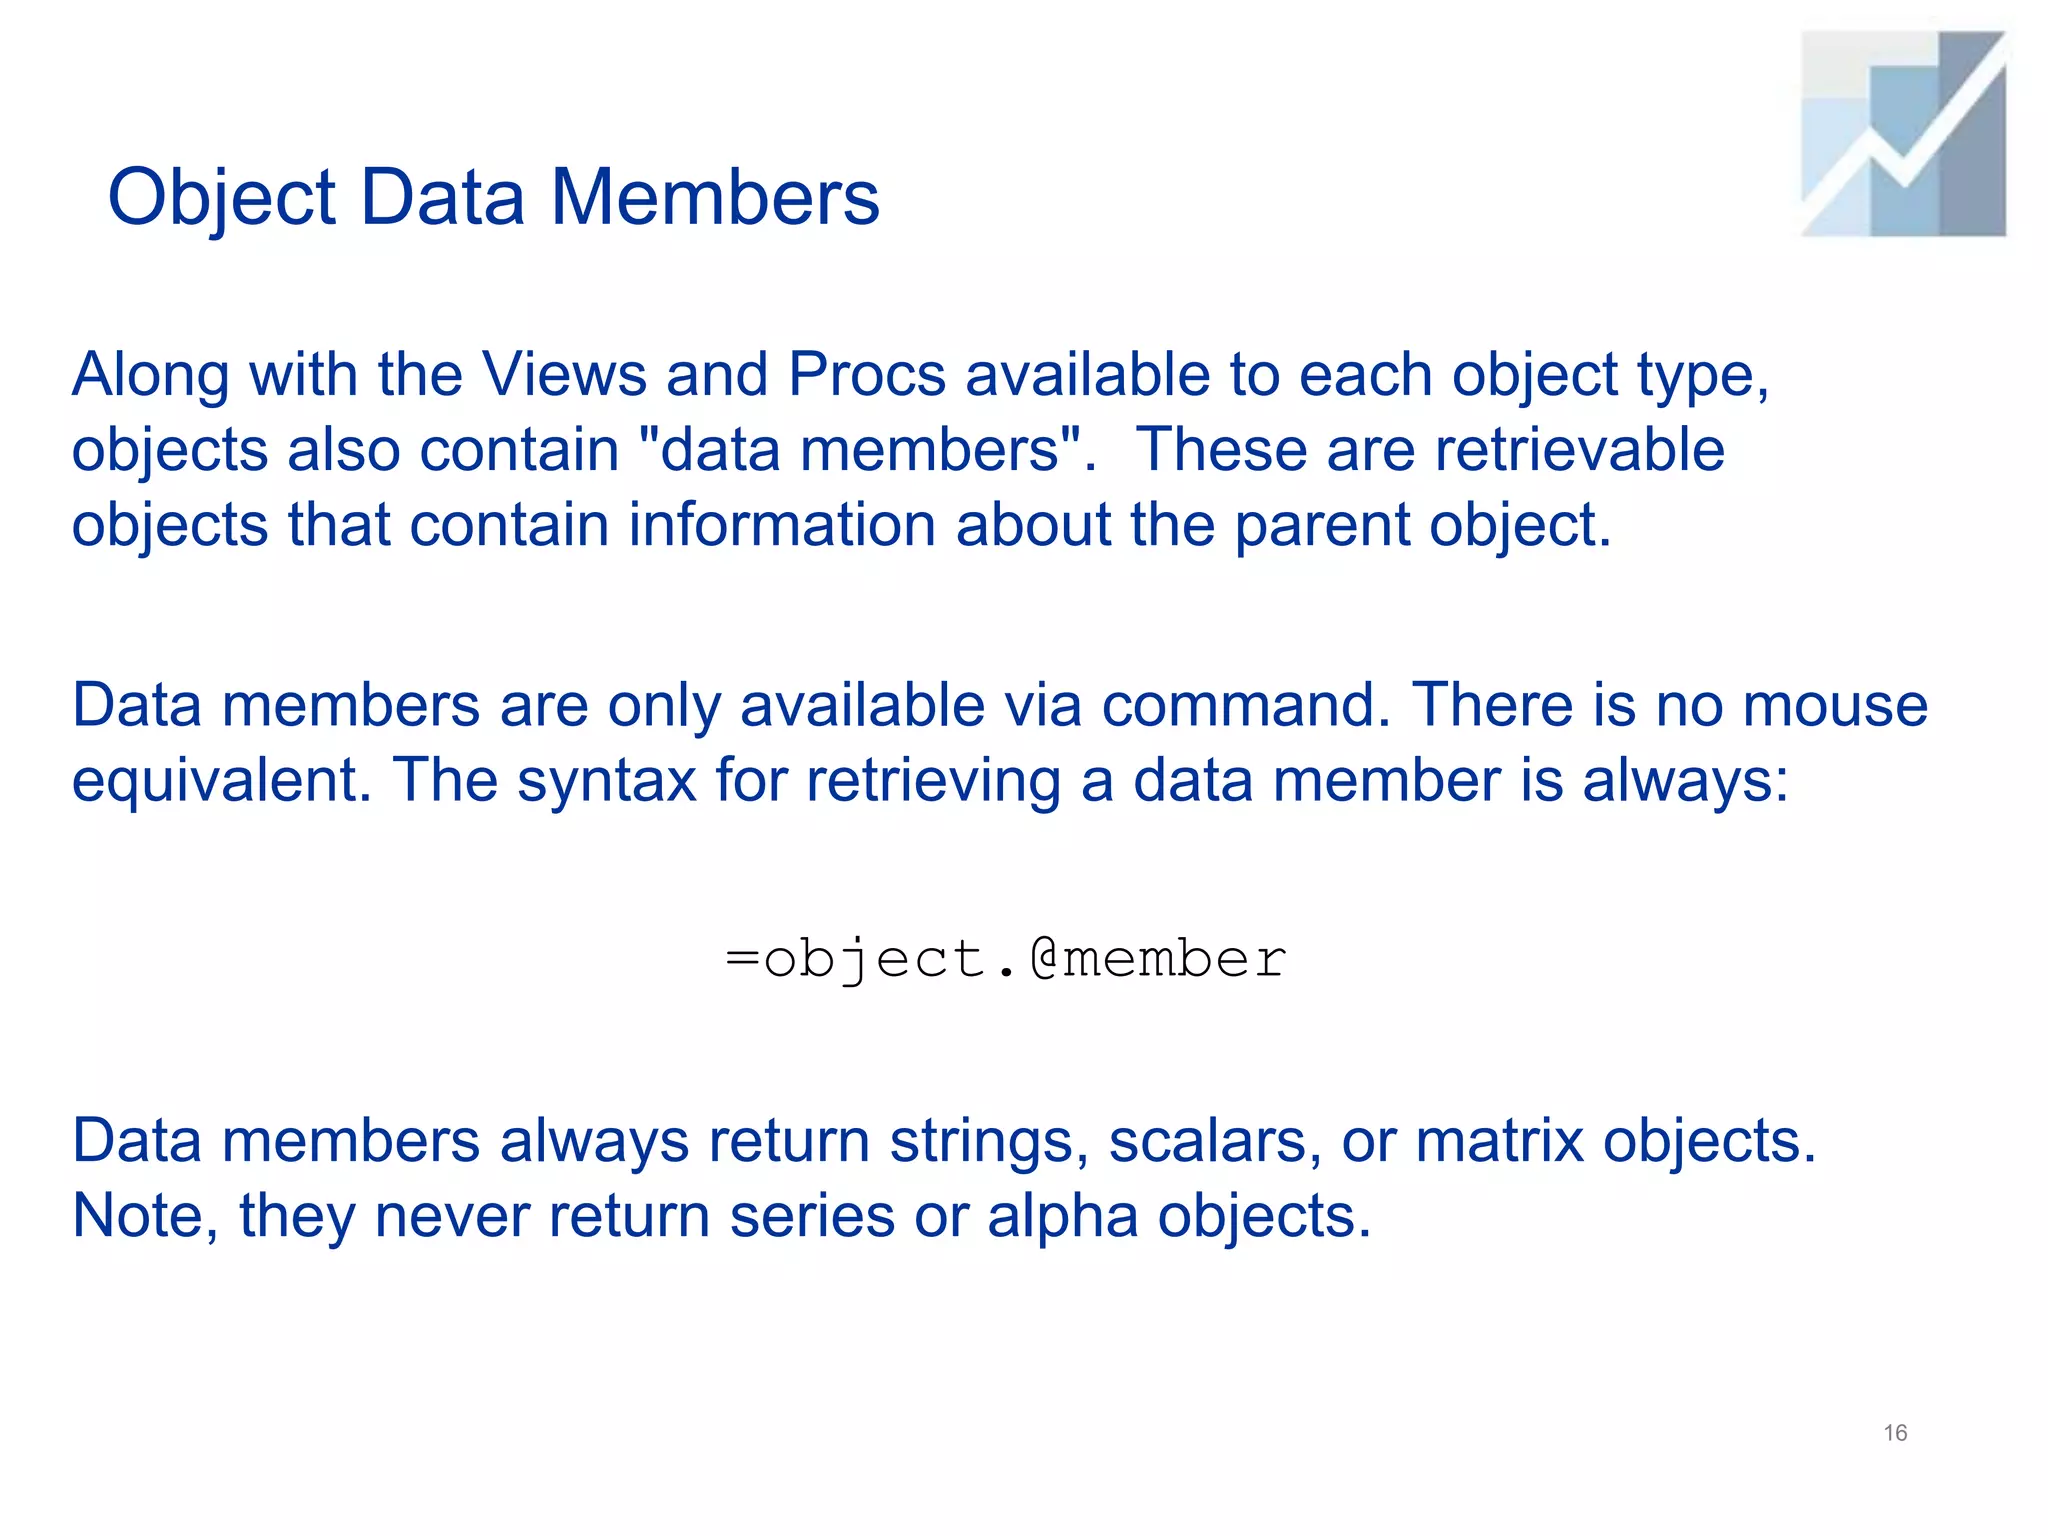
This document provides an overview of the EViews command language and programming. It describes the four main components of the EViews command language: commands, functions, object views and procs, and object data members. It provides examples of common commands like wfopen, series, and equation. It also discusses functions, object views and procs, data members, and basic programming concepts in EViews like variables, control structures like if/else and for loops, and program arguments.

![If/else/endif statements
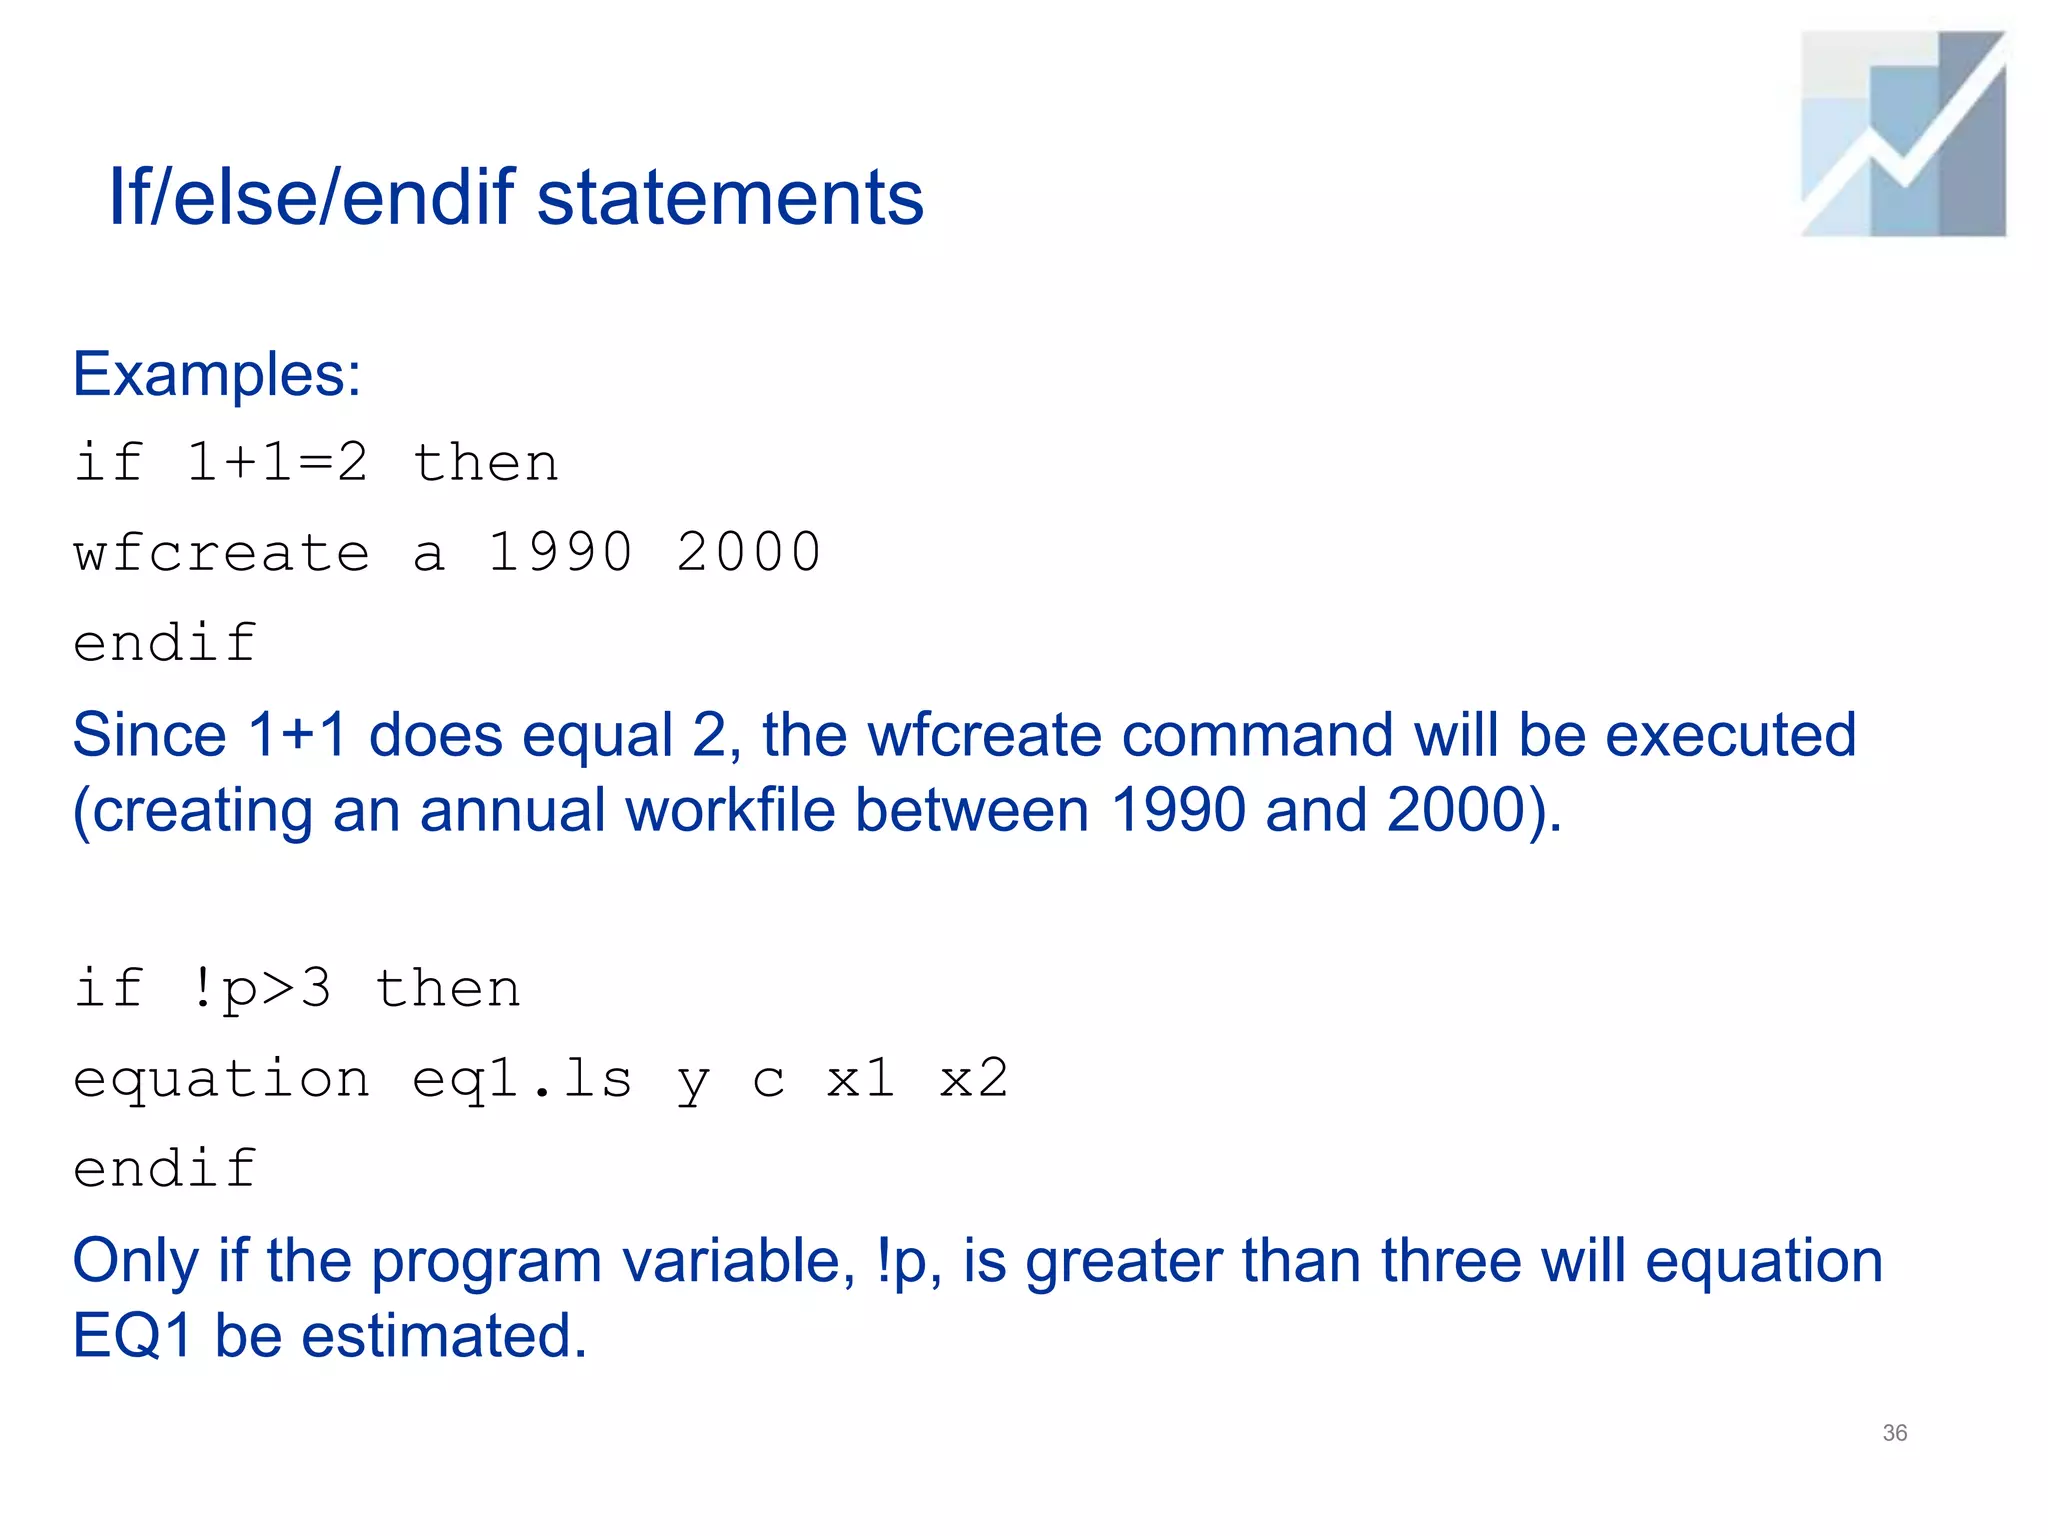
If statements are used when you wish to execute a line of code only
if a certain condition is met. The basic syntax is:
if [condition] then
'line of code to execute
endif
[condition] must be an expression that evaluates to a scalar value of
1 or 0, or a scalar true/false. Note this means you cannot, in
general, use a series expression as part of an if statement.
35](https://image.slidesharecdn.com/tutorial15programming-230112134734-f57977c7/75/Tutorial15_Programming-pptx-35-2048.jpg)
![If/else/endif statements
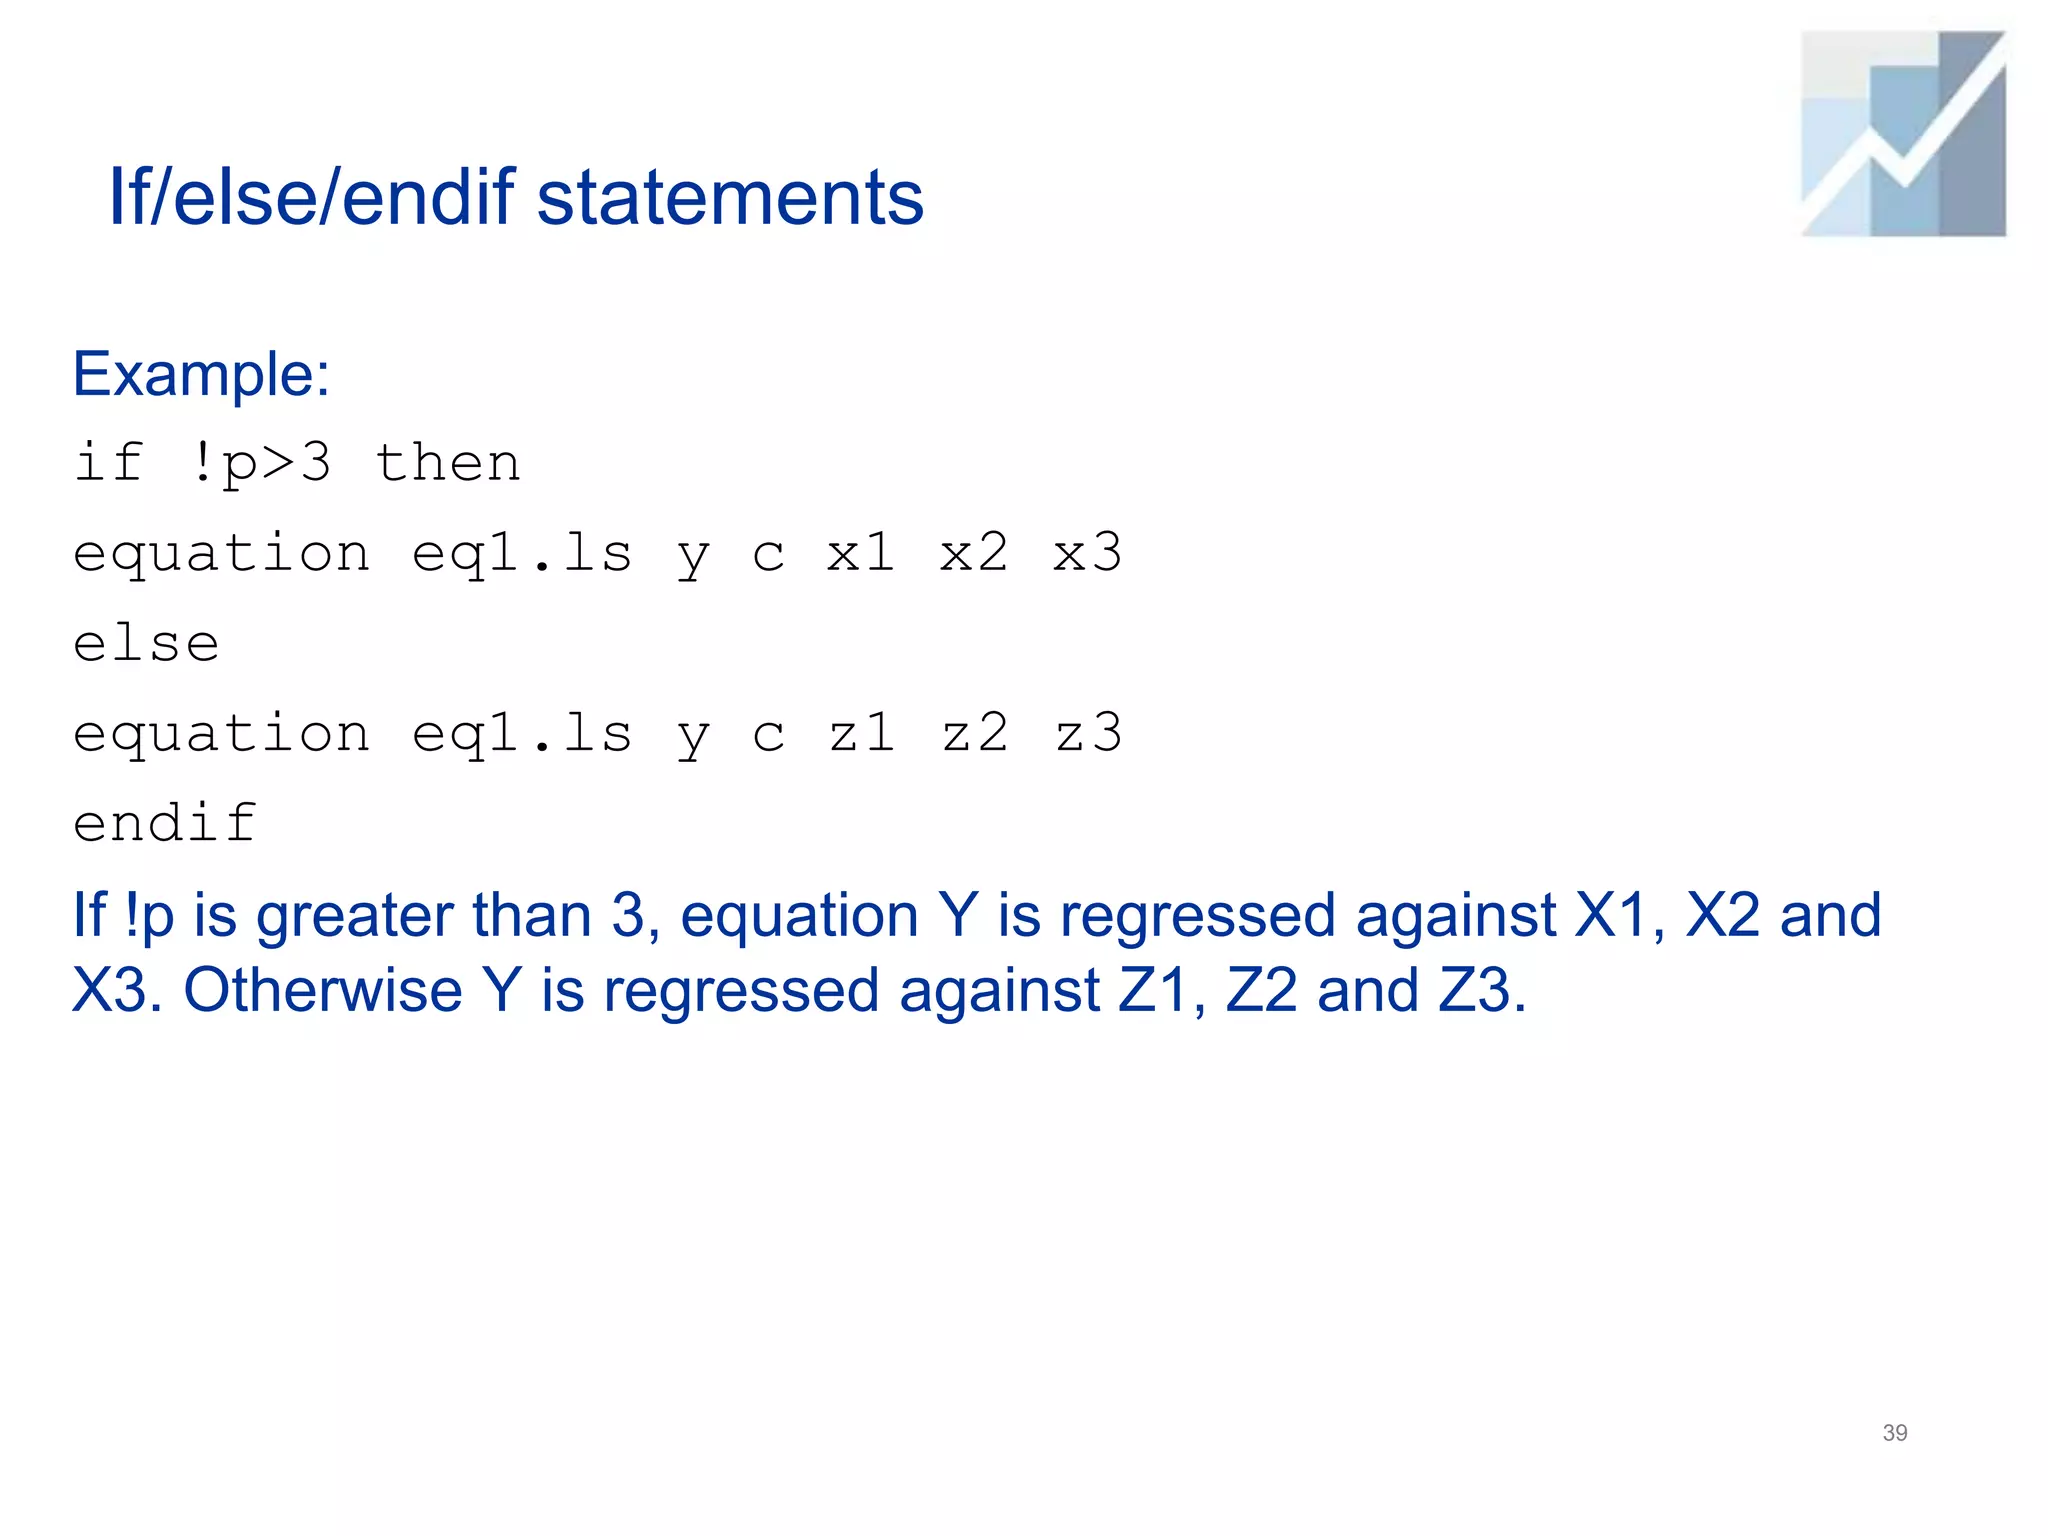
You may use an else statement to tell EViews what to do if the
condition is not met. The basic syntax is:
if [condition] then
'line of code to execute if true
else
'line of code to execute if not true
endif
38](https://image.slidesharecdn.com/tutorial15programming-230112134734-f57977c7/75/Tutorial15_Programming-pptx-38-2048.jpg)
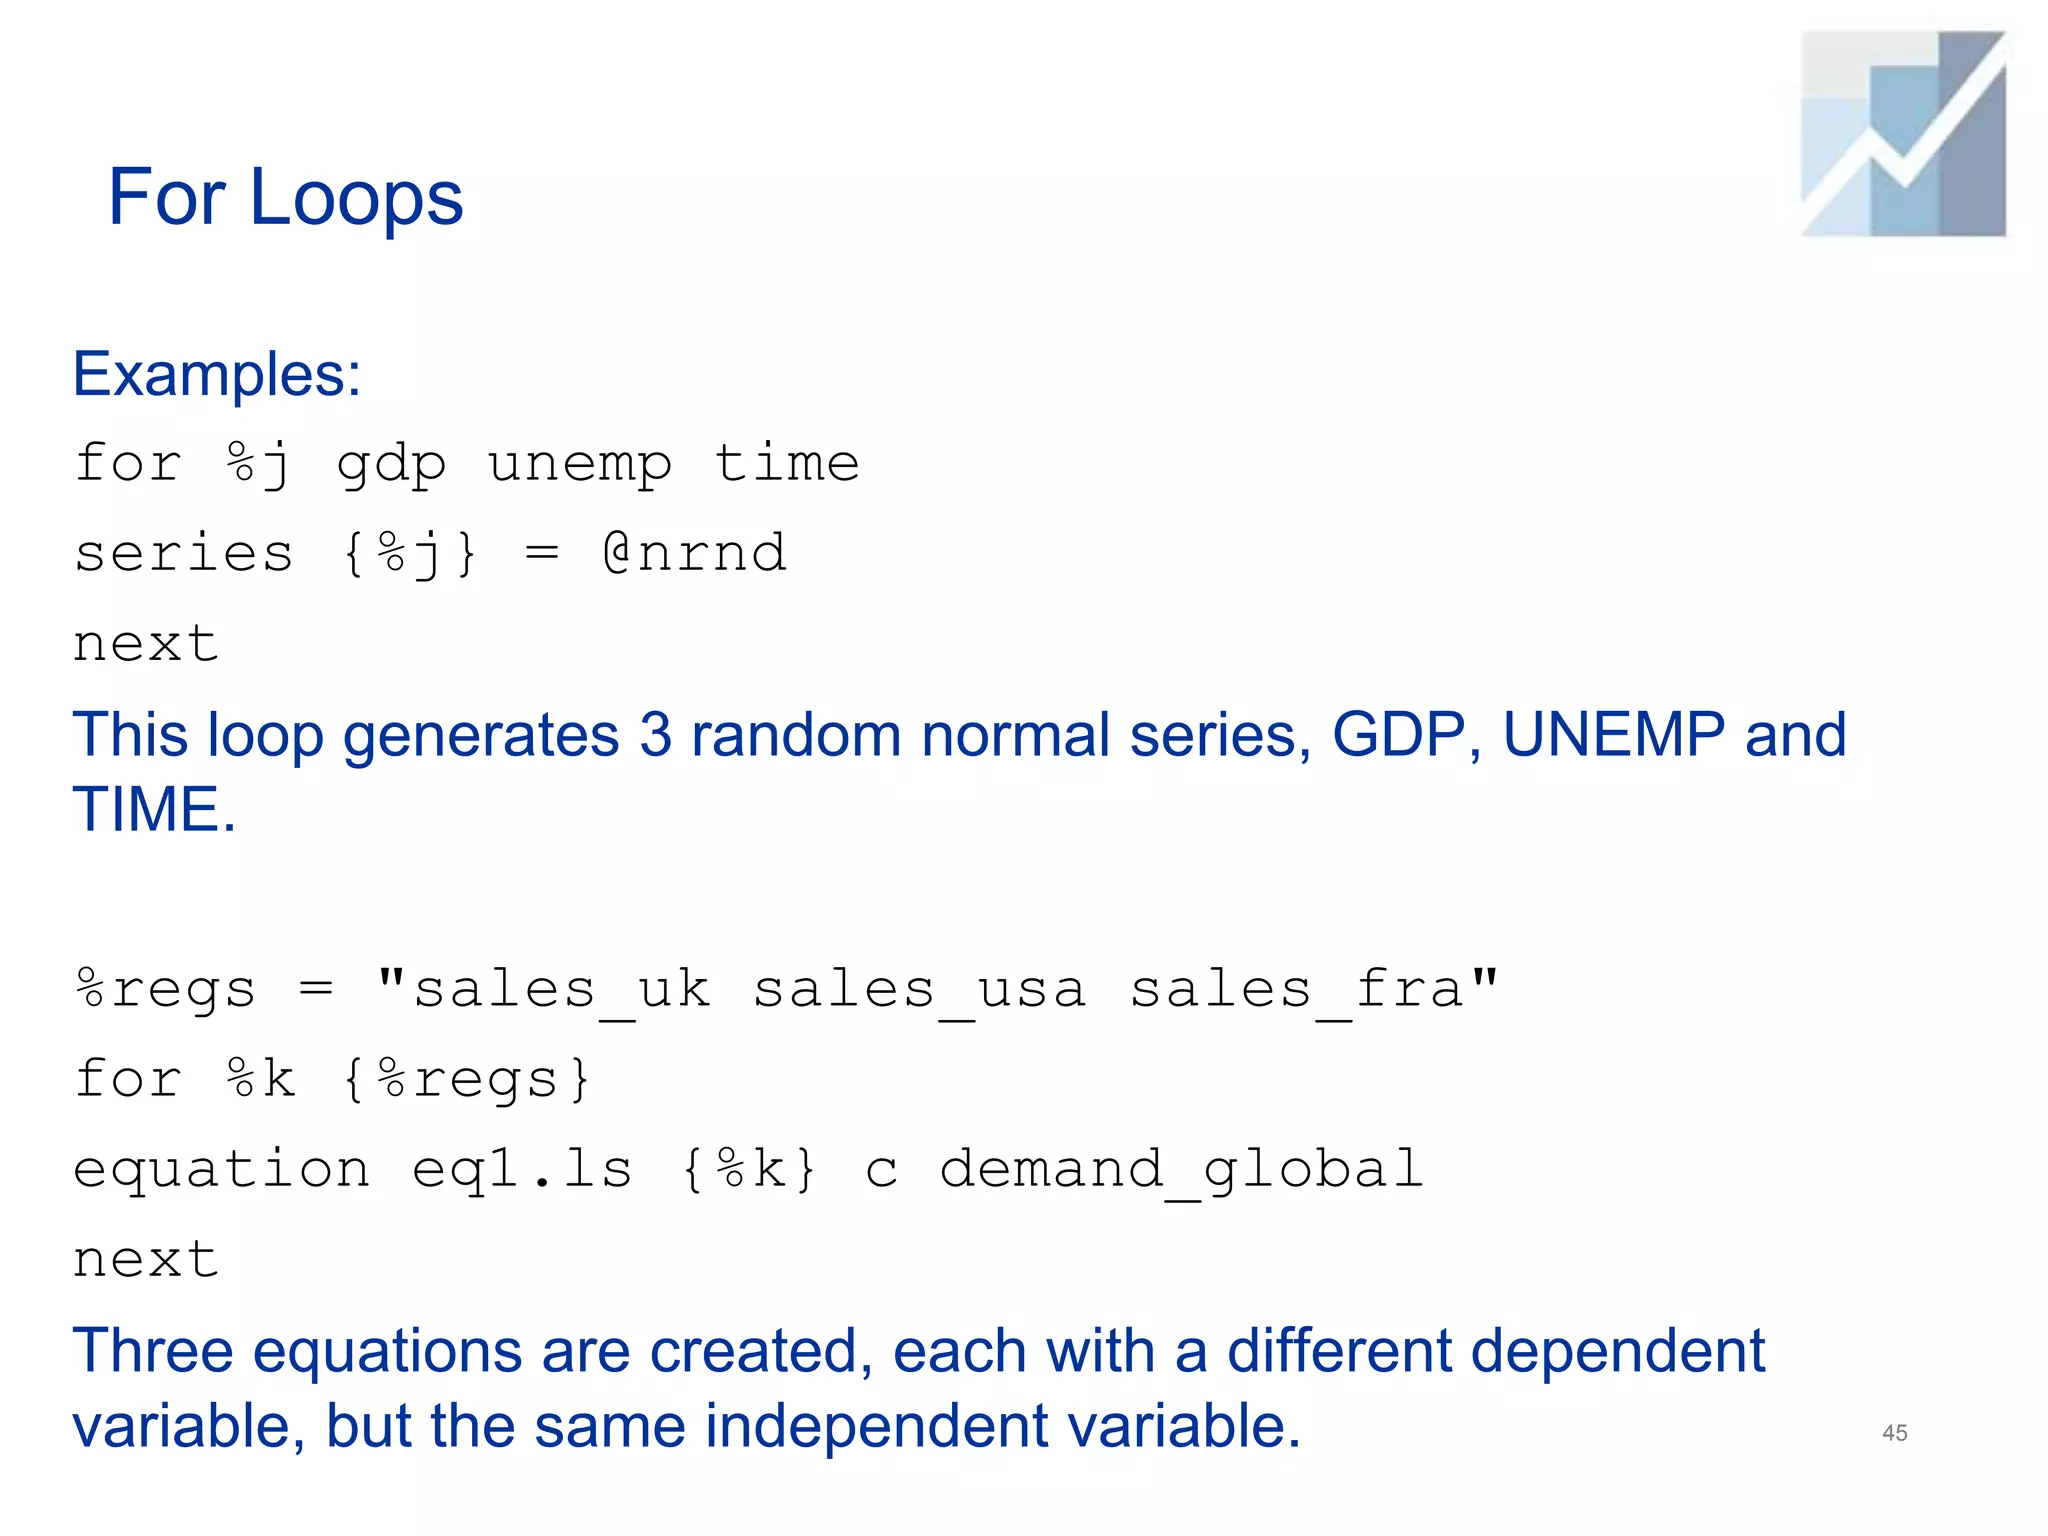
![For Loops
String for loops simply loop a string control variable over different
string values.
String for loops take the form:
for %j [space delimited list of values]
'lines to be repeatedly executed
next
A string variable (either a % variable, as shown here, or a string
object in the workfile) is used to control the loop. Each time through
the loop the control variable is set equal to the next value in the
given list.
44](https://image.slidesharecdn.com/tutorial15programming-230112134734-f57977c7/75/Tutorial15_Programming-pptx-44-2048.jpg)

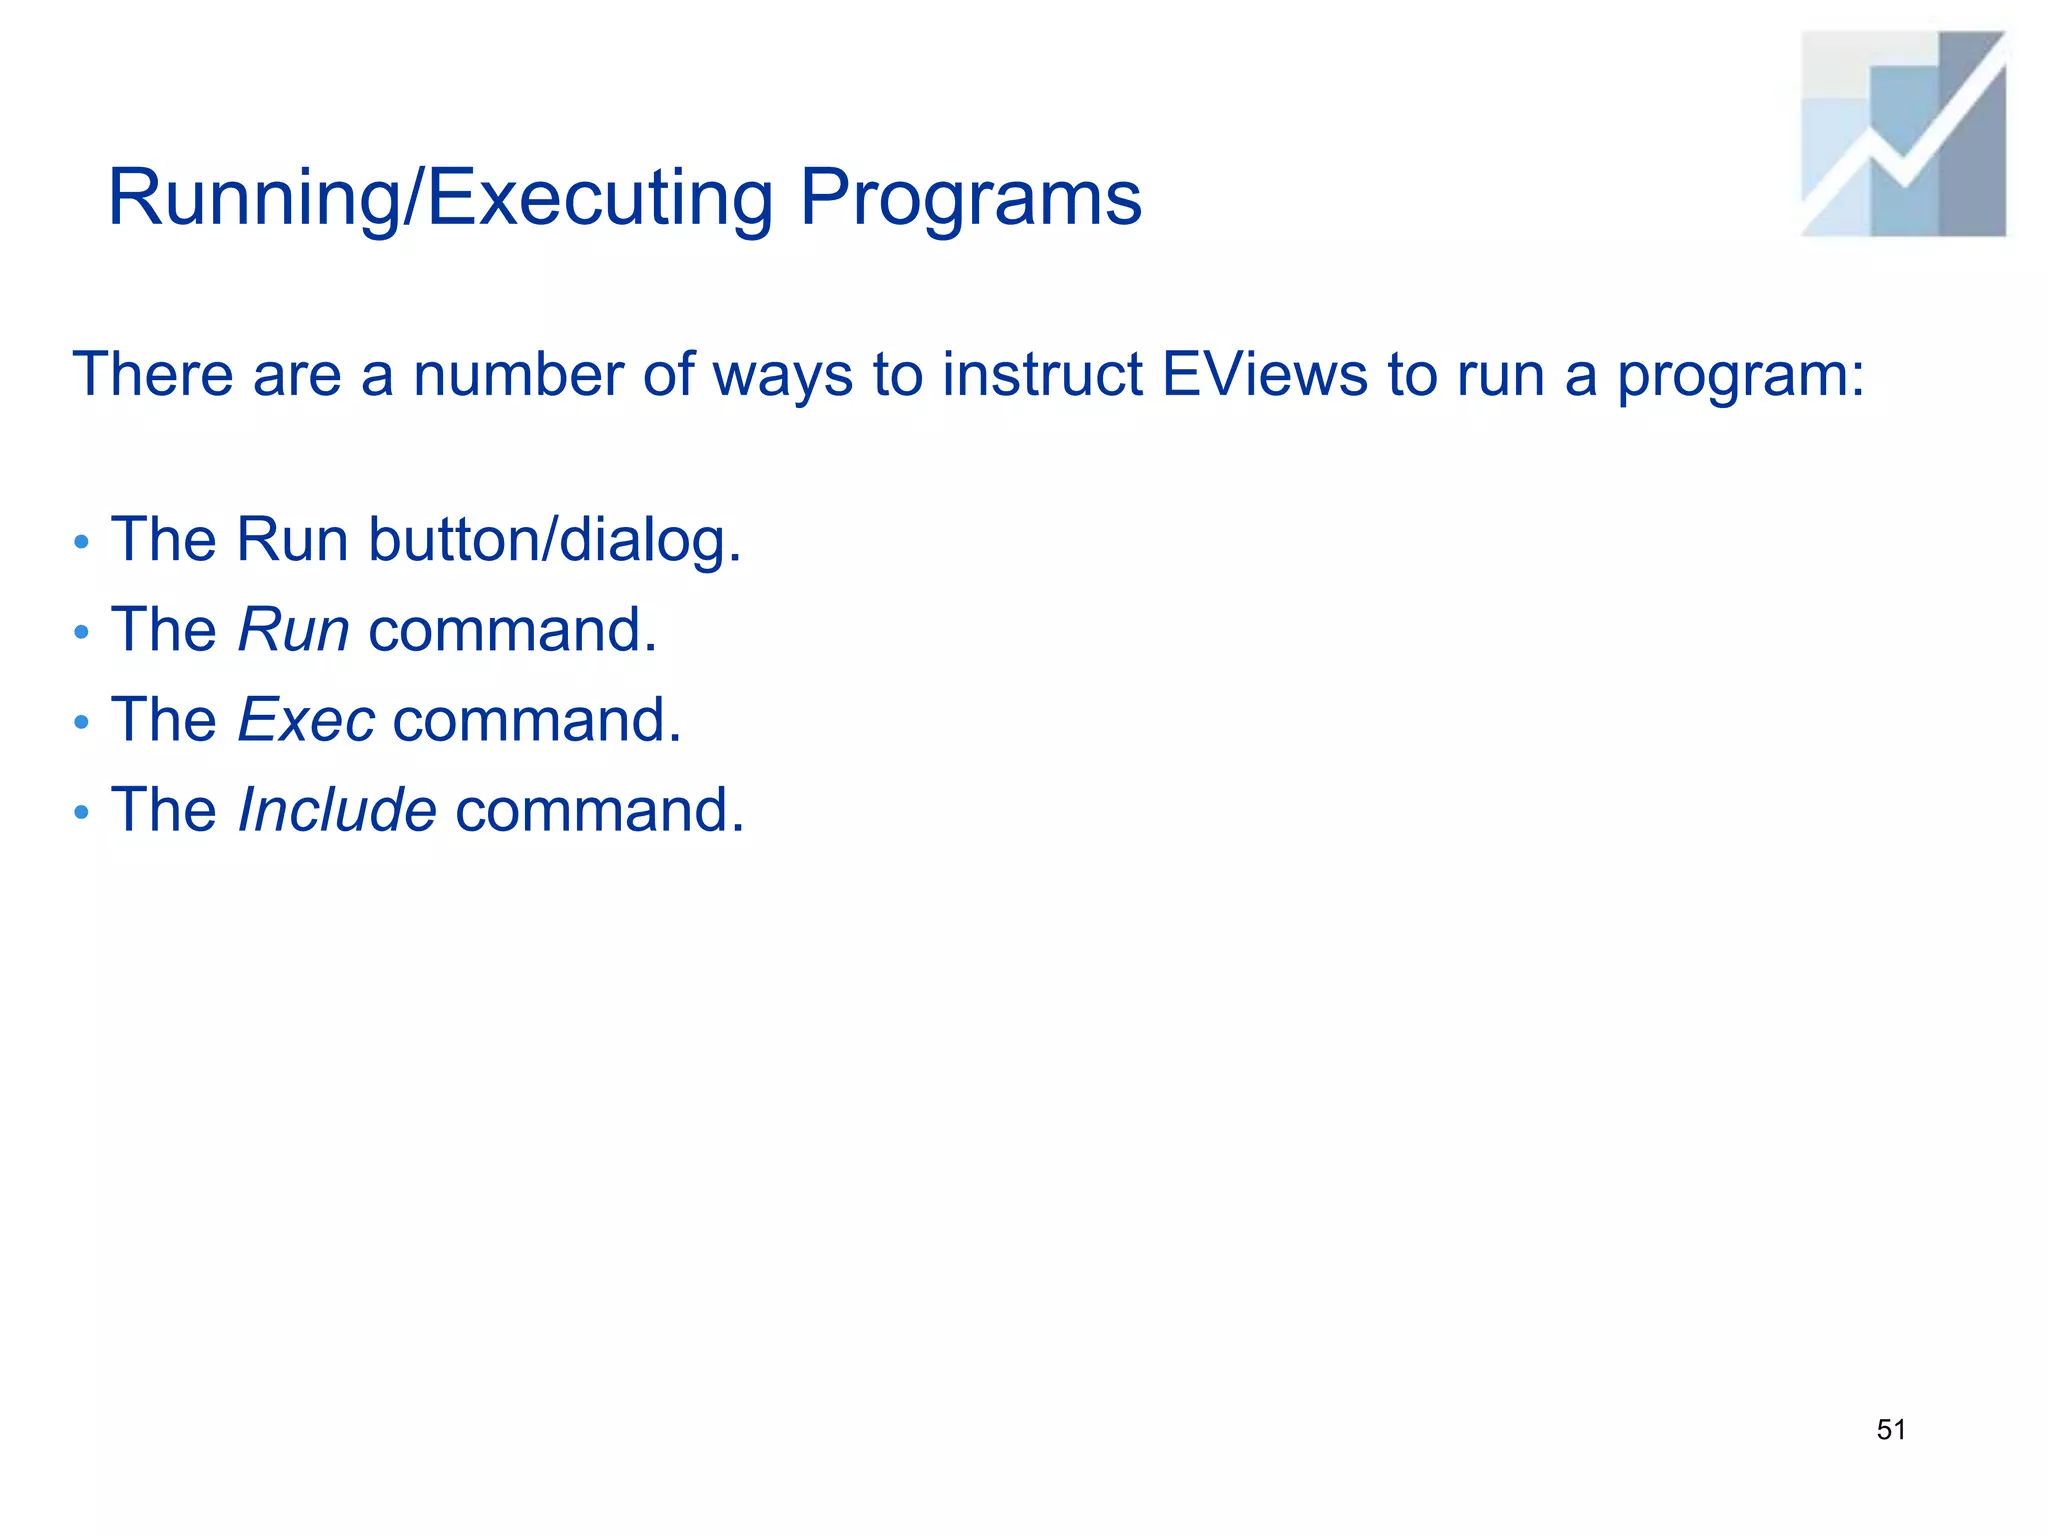
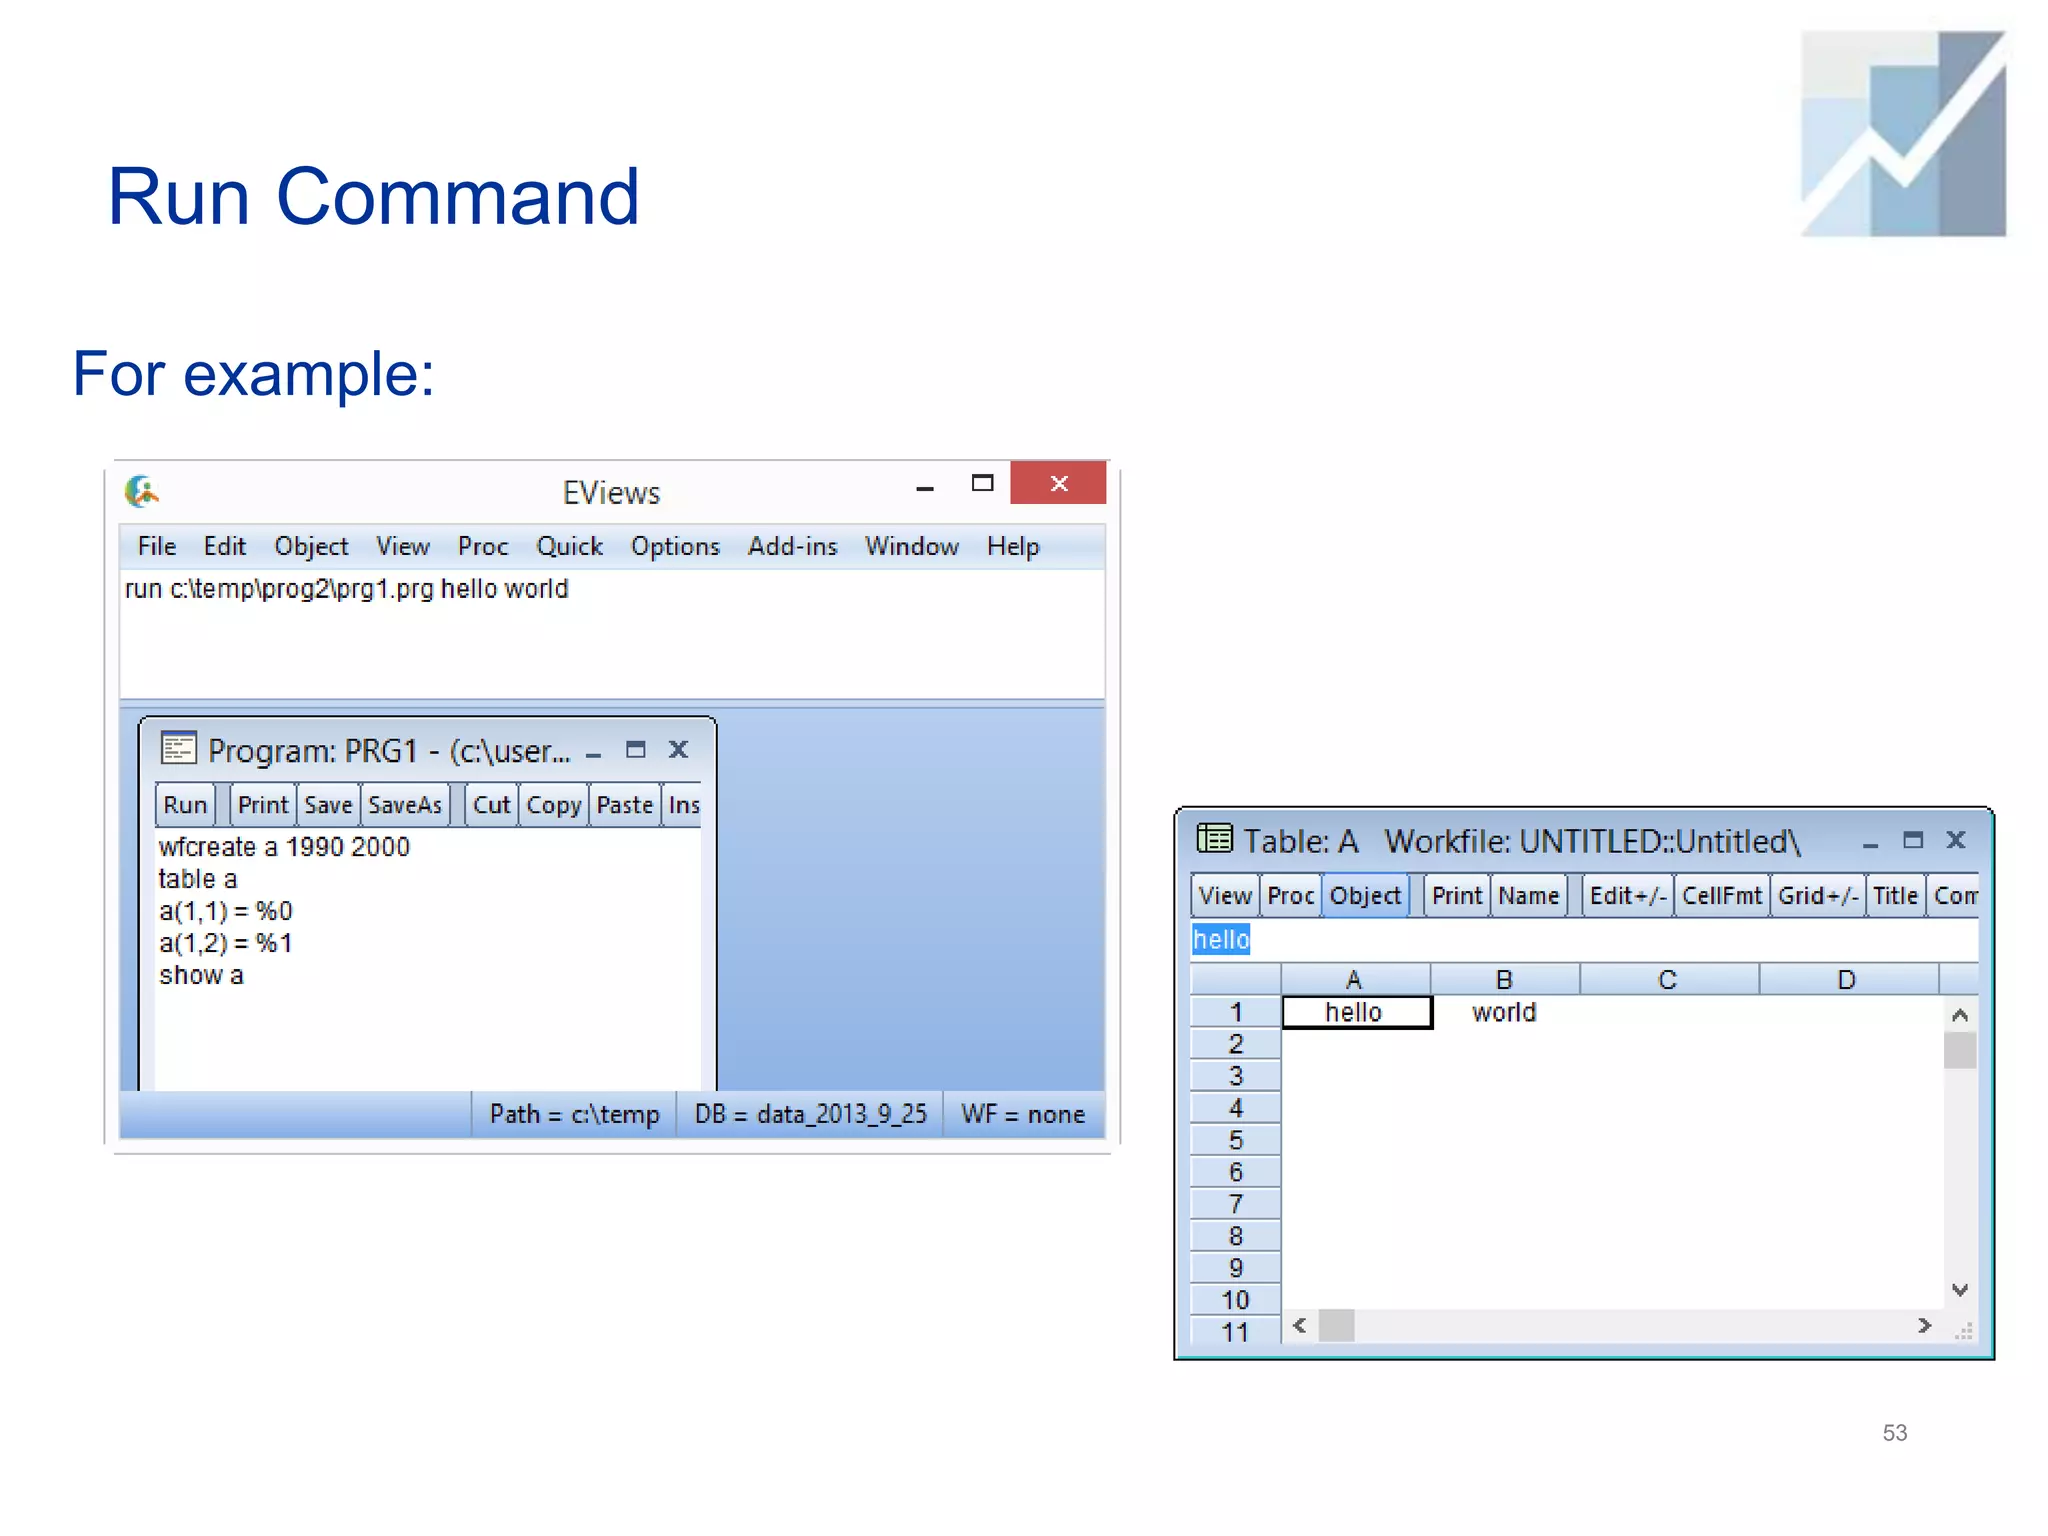
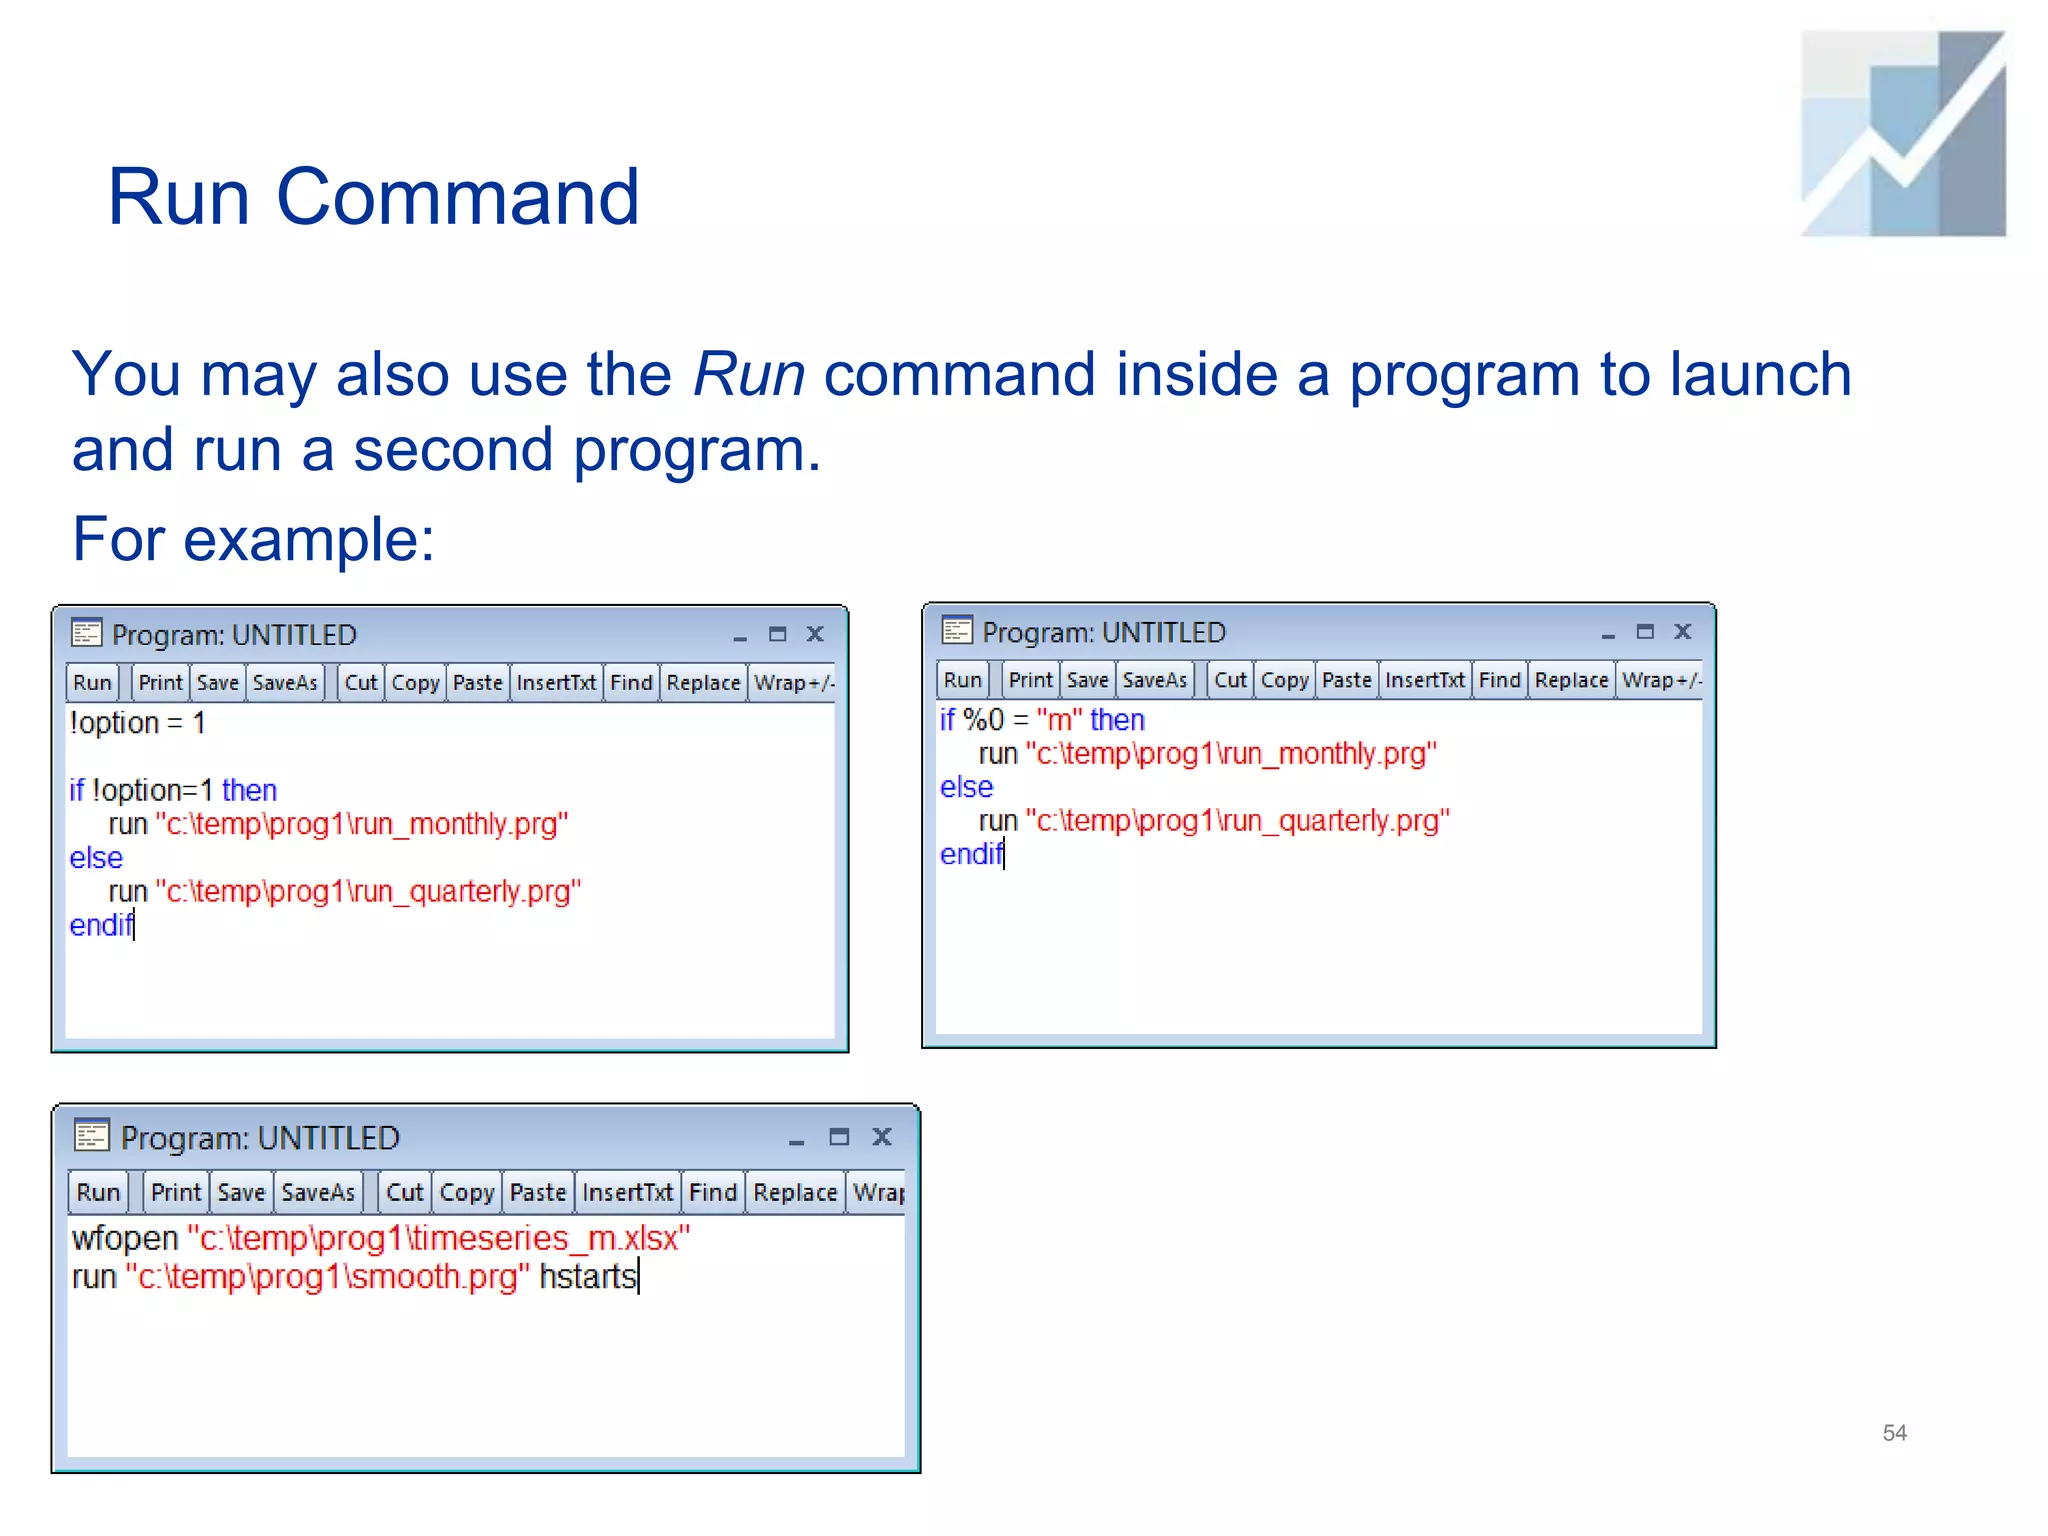
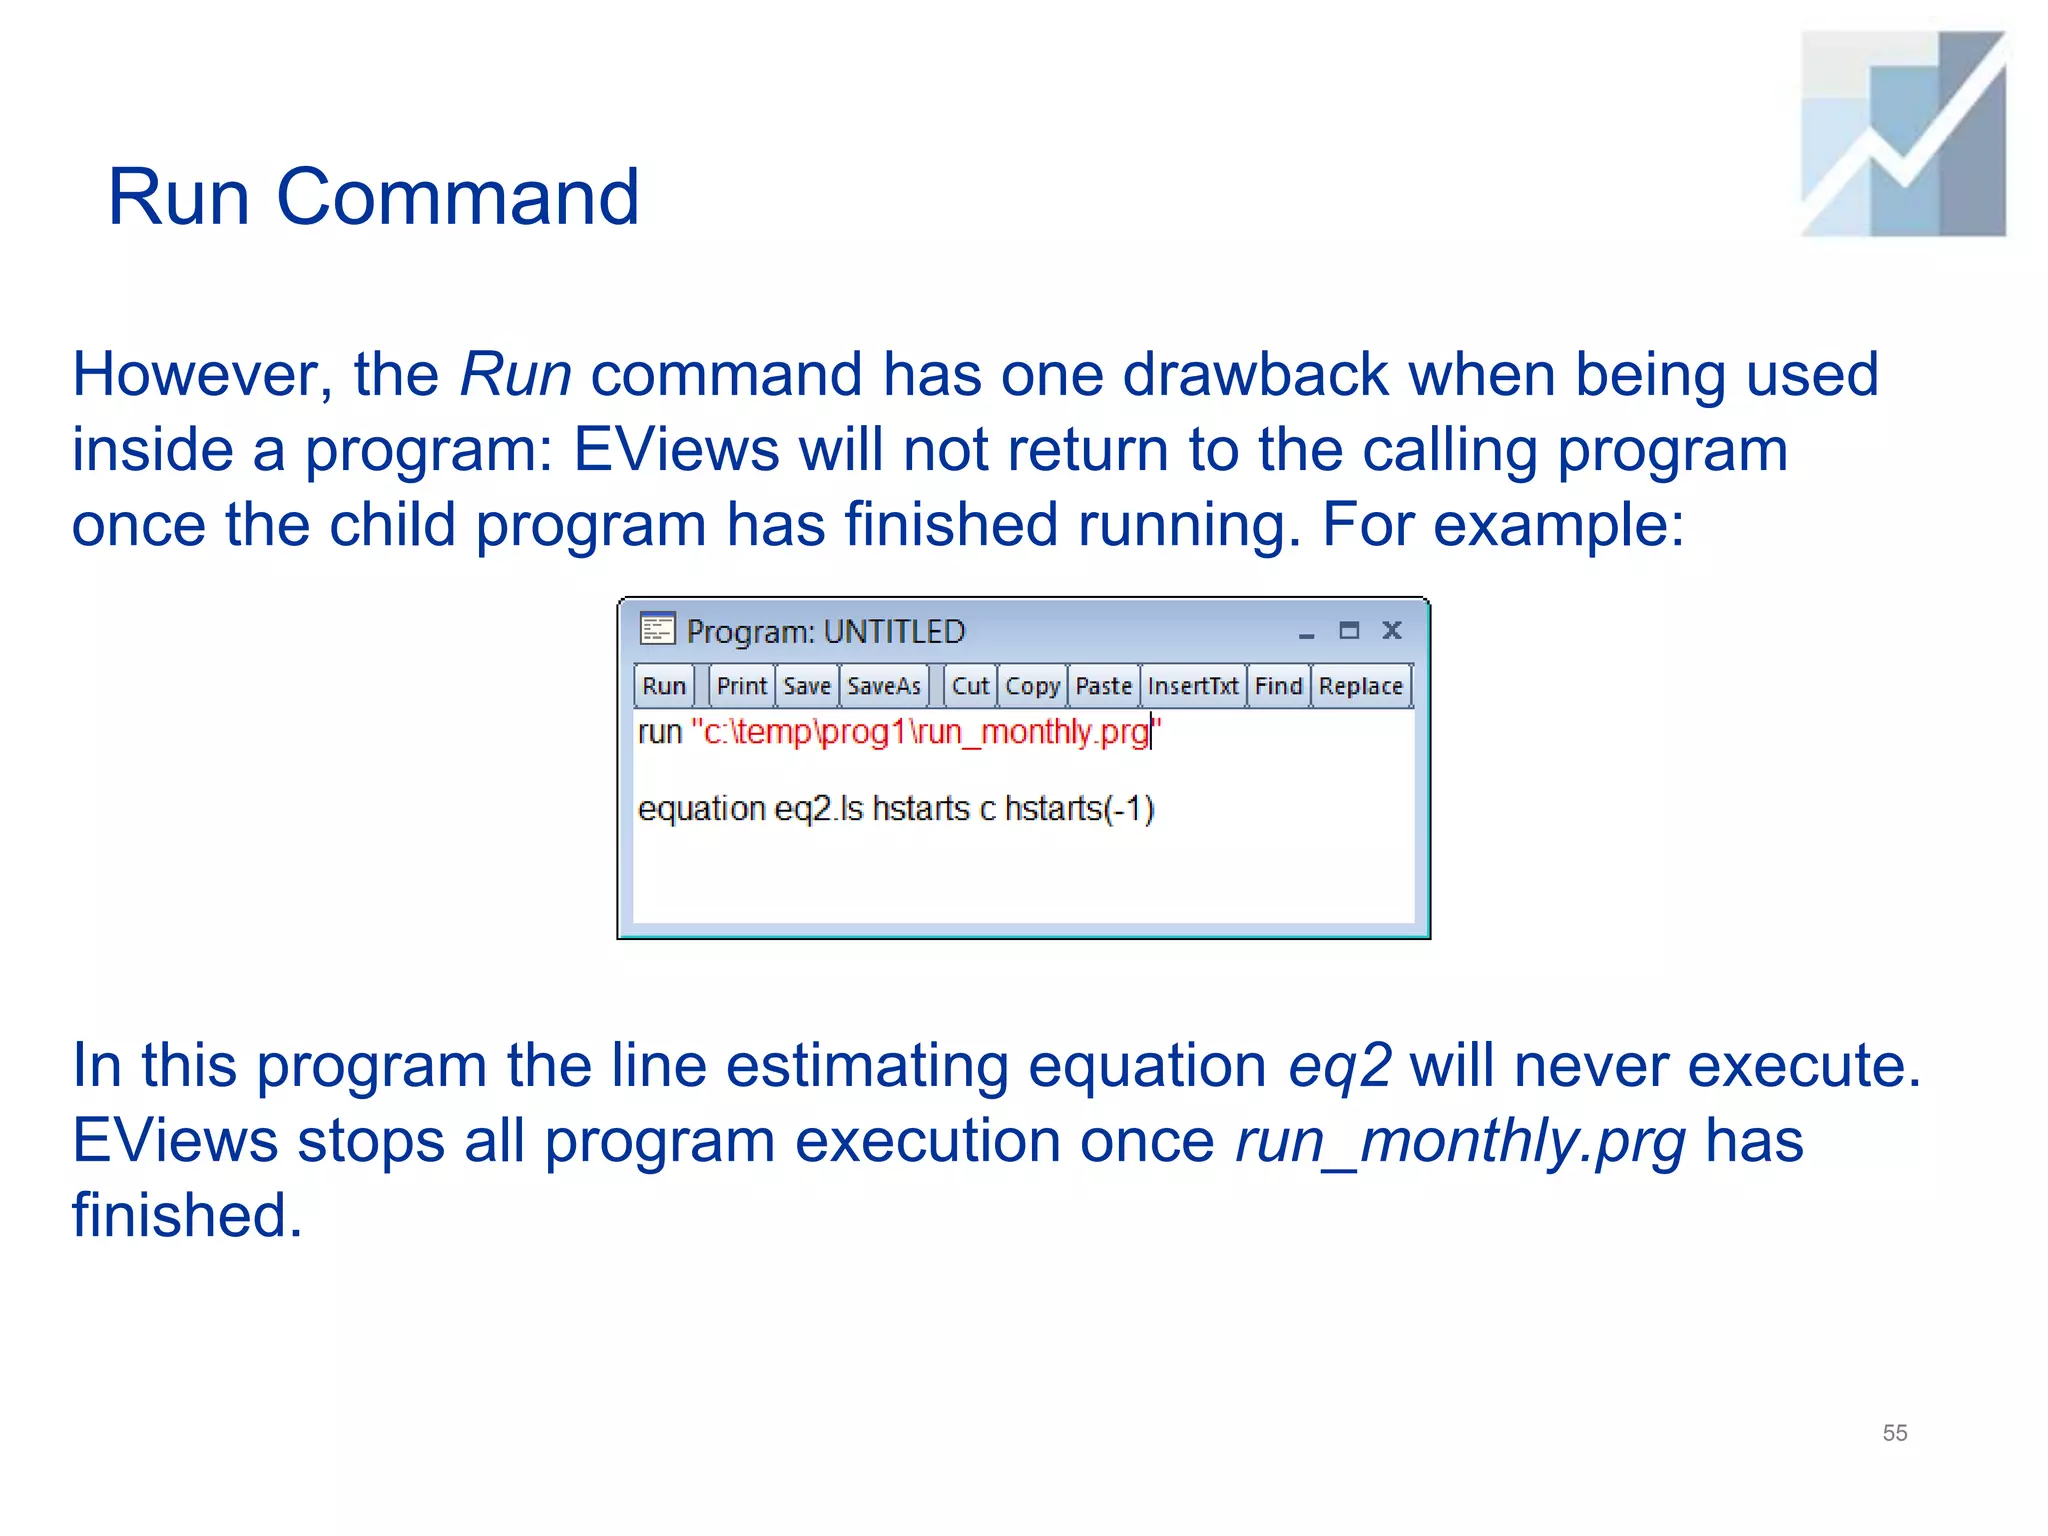
![Run Command
The Run command can be issued from the EViews command line
to instruct EViews to open and run a program. The syntax is:
run myprogram.prg [arguments]
Simply give the name of the program (with a path, if required)
following the Run command.
You may add arguments as a space delimited list following the
name of the program.
52](https://image.slidesharecdn.com/tutorial15programming-230112134734-f57977c7/75/Tutorial15_Programming-pptx-52-2048.jpg)


![[DSC Europe 25] Debmalya Biswas - Agentification: the art of transforming man...](https://cdn.slidesharecdn.com/ss_thumbnails/r5azlggvtqiaiiusrqdr-4-251212103249-5a12c89b-thumbnail.jpg?width=640&height=640&fit=bounds)
![[DSC Europe 25] Bassam Maharmeh - Artificial Intelligence: Opportunities and ...](https://cdn.slidesharecdn.com/ss_thumbnails/thhfmr2fqpawzj7hsjpg-5-251211083048-2c23204f-thumbnail.jpg?width=640&height=640&fit=bounds)


![[DSC Europe 25] Dragana Ilic - AI for Big Data in Astronomy.pptx](https://cdn.slidesharecdn.com/ss_thumbnails/8palya86qaatvjhva1ms-2-dragana-ilic-ai-ilic-251208151906-652b819c-thumbnail.jpg?width=640&height=640&fit=bounds)


![[DSC Europe 25] Marko Krstic - Understanding the AI Threat Landscape - Risks,...](https://cdn.slidesharecdn.com/ss_thumbnails/tiyim1ins5jvbrvzpzla-2-251209104645-c69d3553-thumbnail.jpg?width=640&height=640&fit=bounds)

![[DSC Europe 25] Goran Obradovic - The Rise of Sovereign AI: Building the Regi...](https://cdn.slidesharecdn.com/ss_thumbnails/7nw2xxixrxqdxvrb5wca-6-251205085714-ab09a2ac-thumbnail.jpg?width=640&height=640&fit=bounds)
![[DSC Europe 25] Andy Cotgreave - Nothing is new in analytics.pptx](https://cdn.slidesharecdn.com/ss_thumbnails/mba4vzcurvoh5lfrd5zw-6-251205194645-341bbbbe-thumbnail.jpg?width=640&height=640&fit=bounds)
![[DSC Europe 25] Dragan Vucic - Building the Learning Organization - How AI Tr...](https://cdn.slidesharecdn.com/ss_thumbnails/8brigo2sbu6qur6gxrra-7-251205085715-6ae07d24-thumbnail.jpg?width=640&height=640&fit=bounds)

![[DSC Europe 25] Sara Polak - The Ancient Operating System: What Archaeology T...](https://cdn.slidesharecdn.com/ss_thumbnails/3vch2p6tttdnwhsgazoz-3-sara-polak-smart-cities-251208152532-64404202-thumbnail.jpg?width=640&height=640&fit=bounds)
