Download to read offline


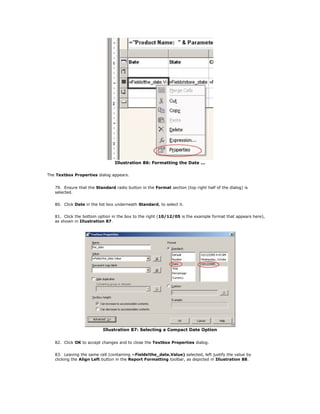
![Illustration 29: Deleting the ProductList Dataset
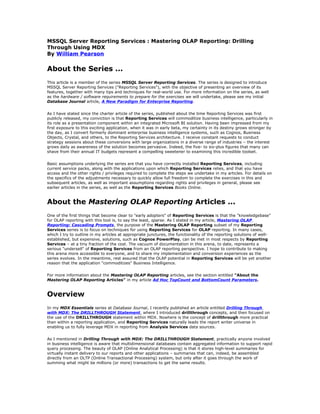
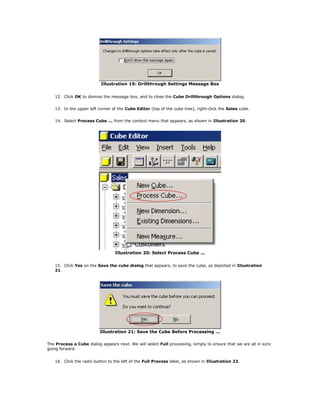
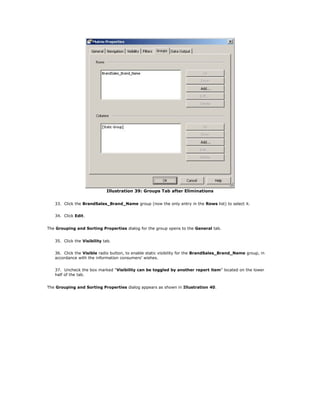
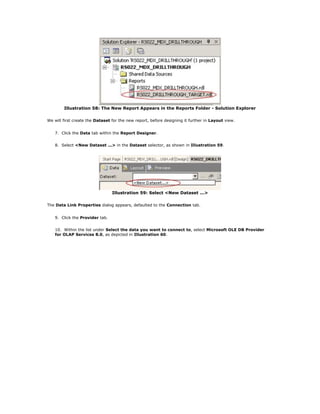
12. Click Yes on the warning dialog that appears next, as shown in Illustration 30.
Illustration 30: Click Yes to Confirm Intentions ...
The no longer useful Dataset is deleted, and we arrive at the remaining ProductData dataset, where we will
now modify the existing Dataset query, which appears as depicted in Illustration 31.
Illustration 31: The Data Tab with Existing Dataset Query
13. Replace the existing query with the following MDX syntax:
SELECT
{[Measures].[Store Sales]} ON COLUMNS,
{Descendants([Product].[All Products],[Product].[Product
Name],LEAVES)} ON ROWS
FROM
[SALES]
WHERE
([Time].[Year].[1997])
The new Dataset query appears as shown in Illustration 32.
Illustration 32: The Dataset Query Replacement on the Data Tab
14. Click the Run button on the toolbar to execute the query, as shown in Illustration 33.](https://image.slidesharecdn.com/tutorial22masteringolapreportingdrillingthroughusingmdx-151010114216-lva1-app6891/85/Tutorial-22-mastering-olap-reporting-drilling-through-using-mdx-20-320.jpg)


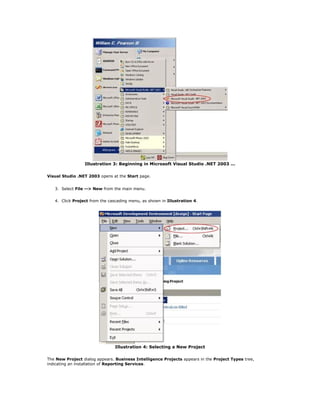
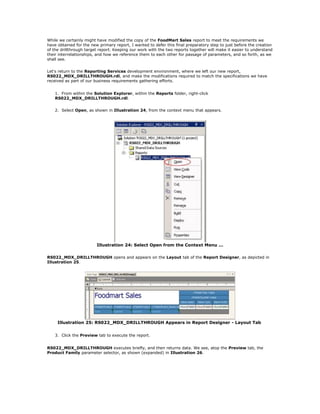
![SELECT
{[Measures].[Store Sales]} ON COLUMNS,
{Descendants([Product].[All Products],[Product].[Product
Name],LEAVES)} ON ROWS
FROM
[SALES]
WHERE
([Time].[Year].[1997])
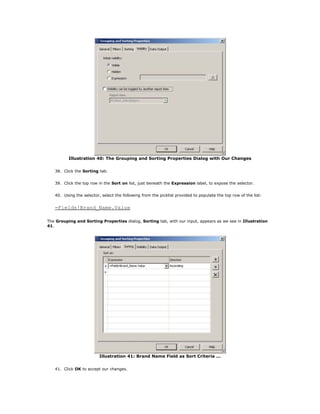
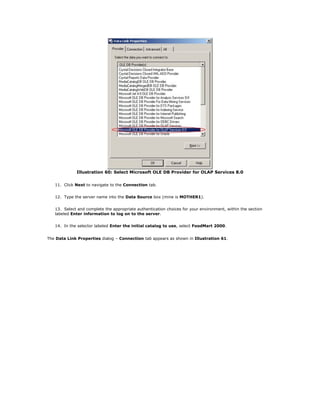
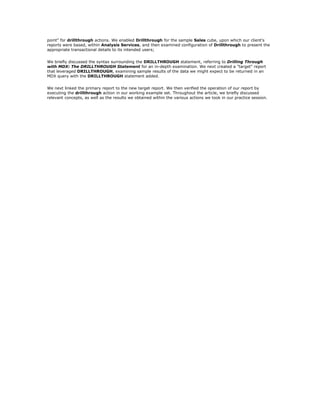
The new Dataset query appears as shown in Illustration 63.
Click for larger image
Illustration 63: The New Dataset Query
19. Click the Run (!) button on the toolbar to execute the query.
The new Dataset appears in the Results pane, below the query, as partially depicted in Illustration 64.
Illustration 64: Partial View of the Returned Dataset
20. Substitute the following for the third line (the ON ROWS specification) of the existing query.
{[Product].[Drink].[Alcoholic Beverages].[Beer and Wine].[Beer].
[Good].
[Good Light Beer]} ON ROWS
The Dataset query appears, with modifications enclosed in a red rectangle, as shown in Illustration 65.](https://image.slidesharecdn.com/tutorial22masteringolapreportingdrillingthroughusingmdx-151010114216-lva1-app6891/85/Tutorial-22-mastering-olap-reporting-drilling-through-using-mdx-38-320.jpg)

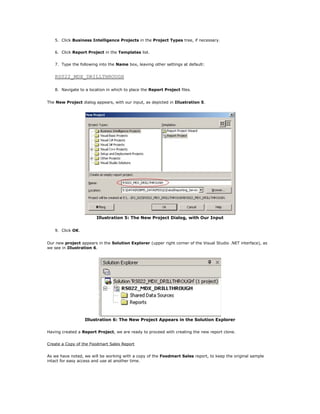
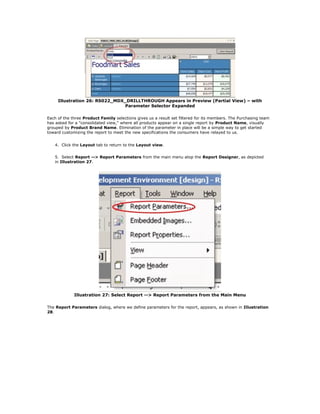
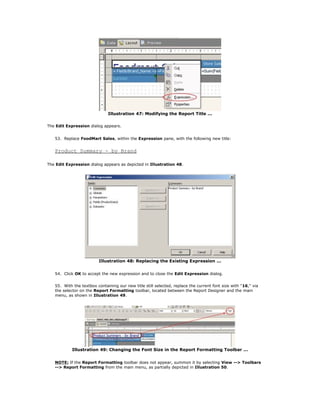
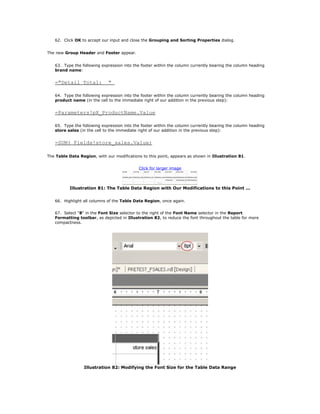
![We note that the fields that appear in the new Dataset are those that we requested in our Drillthrough
Options settings within the Cube Editor for the Sales cube earlier. (While order of columns is rigidly dictated by
Analysis Services, this does not present an arrangement obstacle within Reporting Services, as we shall see).
We have thus achieved the Drillthrough effect for a single Product Name, once again with the purpose of
populating the Fields list appropriately.
24. Click the Refresh Fields button atop the Data tab, to the immediate left of the Run (!) button, as
shown in Illustration 69.
Illustration 69: Refreshing the Data Fields ...
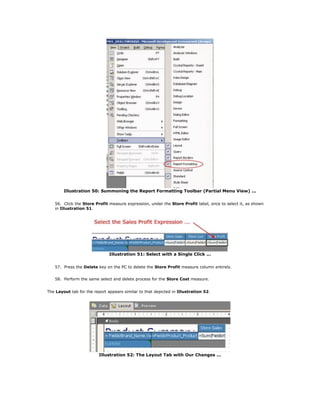
The FoodMart_2000 Dataset Fields list is populated to reflect the returned Dataset, and thus the fields
specified within the Sales cube Drillthrough Options, as depicted in Illustration 70.
Illustration 70: The Populated Fields List
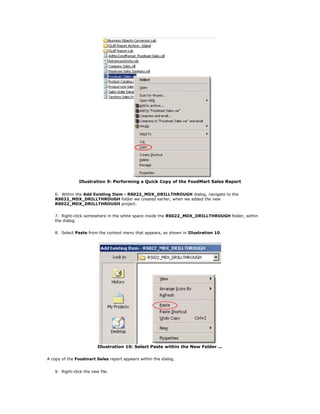
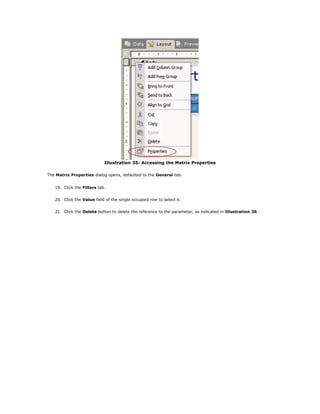
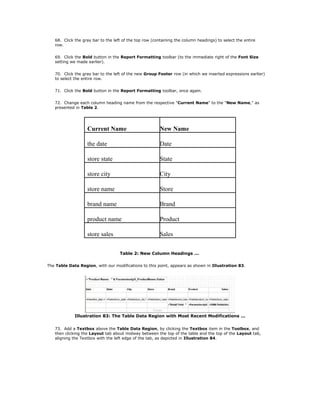
We have populated the Fields list, and can next fit the query into string format. This involves removing carriage
return breaks and making the query a single string. We are also ready to insert a parameterization "placeholder"
for the report parameter we will create next. Finally, also within the new string, we will include the
DRILLTHROUGH statement to leverage MDX to provide, as part of the newly returned Dataset, the data
underlying the initial query, within the columns that we specified in Drillthrough Options from the Cube Editor
earlier.
25. Replace the query with the following exact syntax:
="DRILLTHROUGH SELECT { [Measures].[Store Sales]} ON COLUMNS, {["
&
Parameters!pX_ProductName.value & "]} ON ROWS FROM [Sales]
WHERE
([Time].[Year].[1997]) "
NOTE: Do not insert carriage returns / "line breaks." The query must remain as a single string, preceded
by an equals ("=") sign and enclosed in quotation marks.](https://image.slidesharecdn.com/tutorial22masteringolapreportingdrillingthroughusingmdx-151010114216-lva1-app6891/85/Tutorial-22-mastering-olap-reporting-drilling-through-using-mdx-40-320.jpg)


This document discusses using drillthrough functionality in SQL Server Reporting Services to view underlying transaction details from aggregated OLAP data. It begins with an example business scenario where a report user wants to drill into product sales data to see the individual transactions. It then covers preparing the reporting environment, cloning an existing sample report, enabling drillthrough in the OLAP cube, and creating a target report with an MDX DRILLTHROUGH statement to retrieve the transaction details and link it to the primary report for drillthrough functionality. The document provides details on configuring both reports to meet the example requirements.