Tricumen / Canadian Commercial Banking 27-Feb-14
•
0 likes•301 views

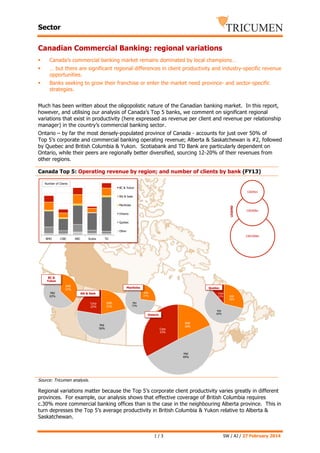
Canadian Commercial Banking: regional variations Canada’s commercial banking market remains dominated by local champions… … but there are significant regional differences in client productivity and industry-specific revenue opportunities. Banks seeking to grow their franchise or enter the market need province- and sector-specific strategies.

Recommended
Recommended
More Related Content
What's hot
What's hot (20)
Viewers also liked
Viewers also liked (9)
Similar to Tricumen / Canadian Commercial Banking 27-Feb-14
Similar to Tricumen / Canadian Commercial Banking 27-Feb-14 (20)
More from Tricumen Ltd
More from Tricumen Ltd (20)
Recently uploaded
Recently uploaded (20)
Tricumen / Canadian Commercial Banking 27-Feb-14
- 1. Sector Canadian Commercial Banking: regional variations § Canada’s commercial banking market remains dominated by local champions… § … but there are significant regional differences in client productivity and industry-specific revenue opportunities. § Banks seeking to grow their franchise or enter the market need province- and sector-specific strategies. Much has been written about the oligopolistic nature of the Canadian banking market. In this report, however, and utilising our analysis of Canada’s Top 5 banks, we comment on significant regional variations that exist in productivity (here expressed as revenue per client and revenue per relationship manager) in the country’s commercial banking sector. Ontario – by far the most densely-populated province of Canada - accounts for just over 50% of Top 5’s corporate and commercial banking operating revenue; Alberta & Saskatchewan is #2, followed by Quebec and British Columbia & Yukon. Scotiabank and TD Bank are particularly dependent on Ontario, while their peers are regionally better diversified, sourcing 12-20% of their revenues from other regions. Canada Top 5: Operating revenue by region; and number of clients by bank (FY13) Number of Clients BC & Yukon CAD5bn Alb & Sask LEGEND Manitoba Ontario CAD50bn Quebec Other BMO CIBC RBC Scotia CAD100bn TD BC & Yukon SME 37% Mid 63% Manitoba Quebec SME 27% Alb & Sask SME 22% Corp 22% Corp 11% Mid 60% Ontario Mid 56% SME 29% Mid 73% Corp 33% SME 18% Mid 49% Source: Tricumen analysis. Regional variations matter because the Top 5’s corporate client productivity varies greatly in different provinces. For example, our analysis shows that effective coverage of British Columbia requires c.30% more commercial banking offices than is the case in the neighbouring Alberta province. This in turn depresses the Top 5’s average productivity in British Columbia & Yukon relative to Alberta & Saskatchewan. 1/3 SW / AJ / 27 February 2014
- 2. Sector In the chart below, we show our analysis of the Top 5’s revenue per corporate client and per relationship manager, by province. The differences are significant. Manitoba, while having the smallest revenue opportunity of the five main regions, produces 30% more revenue per client than the country’s average. Quebec and Alberta excel in revenue per relationship manager, and are slightly ahead in revenue/client, probably due to less diversity in client types, which allows for more efficient coverage. Ontario, where the Top 5 produce an overwhelming proportion of their revenue, is below the national average on both counts, although this is partially due to large ‘nationwide’ clients being covered from Toronto. Revenue per RM and revenue per client by province (FY13) 30% 20% 10% 0% -10% -20% -30% BC & Yukon Alb & Sask Manitoba Ontario Revenue per client Quebec Other Rev per RM Source: Tricumen analysis. The revenue opportunity in different industries/sectors also varies from one province to another. Large segments - manufacturing, supply chain, transport and wholesale - together account for just over 50% of the Top 5’s commercial banking revenue opportunity in Canada; effective coverage of these sectors require a widespread network of relationship managers. ‘Tier 2’ sectors, however (franchise, professional services, real estate and retail) are more important to some provinces than to others, which is reflected in the Top 5’s more selective coverage. Revenue opportunity, by province (FY13) Agriculture Auto Energy Franchise Health Manufact. Prof Services Real Estate Retail Supply Chain TMT Transport Wholesale British Columbia & Yukon Alberta & Saskatchewan Manitoba Ontario Quebec Other Provinces Source: Tricumen. Notes: (1) Full/empty circles indicate strong/weak revenue opportunity in a province. (2) Columns shaded in orange/grey indicate Tier 1/2 industry sectors, by total revenue opportunity. This structure has important implications for market participants, as they need to tailor their client coverage to specific regions and industries. Existing players in the market may wish to look to specific client segments within provinces where they have potential to grow. Newer entrants, however, may see the best returns by targeting Alberta and Quebec where competition may be lighter and productivity greater. 2/3 SW / AJ / 27 February 2014
- 3. Sector About Tricumen Tricumen was founded in 2008. It quickly became a strong provider of diversified market intelligence across the capital markets and has since expanded into transaction and corporate banking coverage. Tricumen’s data has been used by many of the world’s leading investment banks as well as strategy consulting firms, investment managers and ‘blue chip’ corporations. Situated near Cambridge in the UK, Tricumen is almost exclusively staffed with senior individuals with an extensive track record of either working for or analysing banks; and boasts what we believe is the largest capital markets-focused research network of its peer group. Caveats This report and the information contained herein may not be reproduced or distributed in the whole or in part without the prior written consent of Tricumen Limited. Such consent is often given, provided that the information released is sourced to Tricumen and that it does not prejudice Tricumen Limited’s business or compromise the company’s ability to analyse the financial markets. Tricumen Limited has used all reasonable care in writing, editing and presenting the information found in this report. All reasonable effort has been made to ensure the information supplied is accurate and not misleading. For the purposes of cross- market comparison, all numerical data is normalised in accordance to Tricumen Limited’s proprietary product classification. Fully-researched dataset may contain margin of error of +/-10%; for modelled datasets, this margin may be wider. The information and commentary provided in this report has been compiled for informational purposes only. We recommend that independent advice and enquiries should be sought before acting upon it. Readers should not rely on this information for legal, accounting, investment, or similar purposes. No part of this report constitutes investment advice, any form of recommendation, or a solicitation to buy or sell any instrument or to engage in any trading or investment activity or strategy. Tricumen Limited does not provide investment advice or personal recommendation nor will it be deemed to have done so. Tricumen Limited makes no representation, guarantee or warranty as to the suitability, accuracy or completeness of the report or the information therein. Tricumen Limited assumes no responsibility for information contained in this report and disclaims all liability arising from negligence or otherwise in respect of such information. Tricumen Limited is not liable for any damages arising in contract, tort or otherwise from the use of or inability to use this report or any material contained in it, or from any action or decision taken as a result of using the report. 3/3 SW / AJ / 27 February 2014