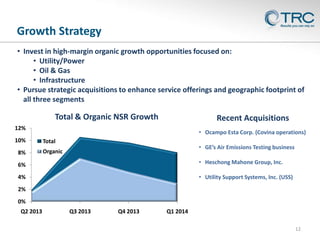
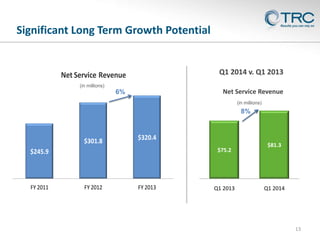
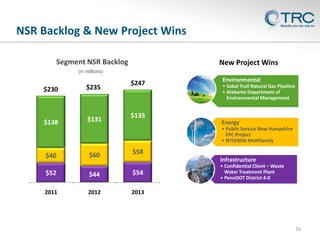
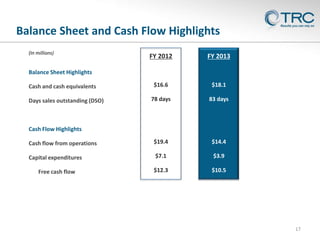
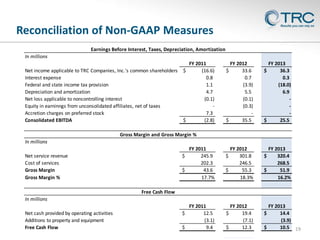
Investor Presentation
First Quarter Fiscal 2014
TRR
Safe Harbor Statement
Certain statements in this presentation may be forward-looking statements within the meaning of Section 27A of
the Securities Act of 1933 and Section 21E of the Securities Exchange Act of 1934. You can identify these
statements by forward-looking words such as "may," "expects," "plans," "anticipates," "believes," "estimates," or
other words of similar import. You should consider statements that contain these words carefully because they
discuss TRC’s future expectations, contain projections of the Company’s future results of operations or of its
financial condition, or state other "forward-looking" information. TRC believes that it is important to communicate
its future expectations to its investors. However, there may be events in the future that the Company is not able to
accurately predict or control and that may cause its actual results to differ materially from the expectations
described in its forward-looking statements. Investors are cautioned that all forward-looking statements involve
risks and uncertainties, and actual results may differ materially from those discussed as a result of various
factors, including, but not limited to, the uncertainty of TRC’s operational and growth strategies; circumstances
which could create large cash outflows, such as contract losses, litigation, uncollectible receivables and income tax
assessments; regulatory uncertainty; the availability of funding for government projects; the level of demand for
TRC’s services; product acceptance; industry-wide competitive factors; the ability to continue to attract and retain
highly skilled and qualified personnel; the availability and adequacy of insurance; and general political or economic
conditions. Furthermore, market trends are subject to changes, which could adversely affect future results. See the
risk factors and additional discussion in TRC’s Annual Report on Form 10-K for the fiscal year ended June
30, 2013, Quarterly Reports on Form 10-Q, and other factors detailed from time to time in the Company’s other
filings with the Securities and Exchange Commission.
This presentation contains references to non-GAAP metrics such as EBITDA, gross margin and free cash flow. A
reconciliation of GAAP to non-GAAP metrics can be found on slide 19.
2
Company Profile
A pioneer in groundbreaking scientific and engineering developments since 1969,
TRC is a national engineering, consulting and construction management firm that
provides integrated services to three primary markets:

Energy | Environmental | Infrastructure




100 + U.S. offices
London office



2,900+ employees



www.trcsolutions.com

Expert problem solvers

NYSE: TRR
3
Investment Highlights
 Well positioned in markets with solid medium- to long-term
growth opportunities

 Executing a focused profitable growth strategy
 Large addressable market opportunity
 Diversified revenue stream with attractive customer base

 Strong balance sheet and cash position
 Stable but growing backlog

4
TRC’s Diversified Business Model
Net Service Revenue by Segment
Environmental 51%

Estimated Client Distribution
by Industry(1)
Power / Utility

Other

$163M
3% YOY Growth

30%
50%

$44M
2% YOY Growth

$110M
14% YOY Growth

10%
10%

Infrastructure
14%

(1) Estimates as of June 2013.

Transportation
Energy 35%

Fiscal Year 2013
Total NSR: $320.4 Million
6% YOY Growth

Oil & Gas

5
51% of Total NSR
Environmental Services

Environmental
Segment

 Permitting and resource management
 Remediation and hazardous waste
management
 Air quality and air measurements
 Building sciences, industrial hygiene,
and compliance
 Solid waste

Segment Drivers

 Increasing permitting and power plant
decommissioning activities
 Greenhouse gas rules – CO2
 Continued development of upstream,
midstream and downstream oil & gas
markets
 Re-emergence of industrials and
related capital spend

Net Service Revenue (in millions)
$163.2

$159.0

+3%

FY 2012

FY 2013

Segment Profit (in millions)
$32.0

$30.8

-4%

FY 2012

FY 2013
6
Energy
Segment

35% of Total NSR
Energy Services

 Electrical transmission, distribution &
substation engineering
 Energy efficiency
 Communications engineering

Segment Drivers

 Greenhouse gas rule – CO2
 Expanding utility capital spend
programs on aging transmission
and distribution infrastructure
 Dynamic revolution in domestic fuel
supplies driving shifts in use of
utility assets (e.g. Coal ↓, Natural
Gas ↑, Renewables ↑, Efficiency
↑)

Net Service Revenue (in millions)
$109.8
$96.0

+14%

FY 2012

FY 2013

Segment Profit (in millions)
$23.5

$23.3

-1%

FY 2012

FY 2013
7
Infrastructure
Segment

14% of Total NSR
Infrastructure Services

 Transportation design services
 Civil engineering services
 Security consulting & engineering
services
 Geotechnical engineering & materials
inspection
 Construction engineering, inspection &
management

Net Service Revenue (in millions)
$44.2

$43.5

+2%

FY 2012

FY 2013

Segment Profit (in millions)

Segment Drivers

 Need to upgrade and repair aging
infrastructure, especially bridges and
roadways
 Additional state funds for capital
projects
 Expansion of transportation services

$8.7
$7.7

+12%

FY 2012

FY 2013
8
Why Clients Choose TRC
 Multi-disciplinary teams implement complex projects
 Nationwide network is a crucial asset that
can be integral to project success
 TRC helps clients:
 realize a higher return on investment
 manage risks
 align project solutions with
operational priorities
 integrate multiple areas of
expertise to arrive at a better solution

Concept

Delivery &
Operations

Permitting, Engi
neering, &
Construction

9
High-Profile Private Sector Clients

10
Working With All Levels of Government
State and Local

Federal

11
Growth Strategy
• Invest in high-margin organic growth opportunities focused on:
• Utility/Power
• Oil & Gas
• Infrastructure
• Pursue strategic acquisitions to enhance service offerings and geographic footprint of
all three segments

Total & Organic NSR Growth

Recent Acquisitions

12%
10%
8%

• Ocampo Esta Corp. (Covina operations)
Total

• GE’s Air Emissions Testing business

Organic

6%

• Heschong Mahone Group, Inc.

4%

• Utility Support Systems, Inc. (USS)

2%
0%
Q2 2013

Q3 2013

Q4 2013

Q1 2014
12
Significant Long Term Growth Potential

Q1 2014 v. Q1 2013

Net Service Revenue
(in millions)

Net Service Revenue

6%

(in millions)

8%

$301.8

$320.4
$75.2

$245.9

FY 2011

FY 2012

FY 2013

Q1 2013

$81.3

Q1 2014

13
Full Year Income Statement Highlights
FY 2012

FY 2013

Net service revenue

$301.8

Cost of services

$246.5

$268.5

Gross margin

18.3%

16.2%

General and administrative expenses

$31.0

$30.7

$(11.1)

-

Operating income

$30.0

$18.6

EBITDA

$24.4

$25.5

EBITDA as a % of NSR

8.1%

Cost of Services as % of NSR

$320.4

7.9%

(In millions, except per share data)

Arena Towers litigation reversal

Federal and state income tax benefit

$3.9

$18.0

Net income applicable to TRC Companies, Inc.

$33.6

$36.3

Diluted earnings per common share

$1.16

$320.4

$301.8

81.7%
FY 2012

83.8%

FY 2013

G&A Expenses as % of NSR
$320.4

$301.8

10.3%

9.6%

$1.23
FY 2012

FY 2013
14
EBITDA Reflects Leverage in Business Model
Consolidated EBITDA
(in thousands)

$24,403

$25,464

8.1%

7.9%

FY 2012

FY 2013

$14,435

5.9%

FY 2011

Consolidated EBITDA

EBITDA Margin

15
NSR Backlog & New Project Wins
Segment NSR Backlog

New Project Wins

(in millions)

$230

$235

$138

$131

$247

Environmental
• Sabal Trail Natural Gas Pipeline
• Alabama Department of
Environmental Management

$135
Energy
• Public Service New Hampshire
EPC Project
• NYSERDA Multifamily

$40

$60

$58
Infrastructure

$52

$44

$54

2011

2012

• Confidential Client – Waste
Water Treatment Plant
• PennDOT District 4-0

2013

16
Balance Sheet and Cash Flow Highlights
(In millions)

FY 2012

FY 2013

$16.6

$18.1

78 days

83 days

Cash flow from operations

$19.4

$14.4

Capital expenditures

$7.1

$3.9

Free cash flow

$12.3

$10.5

Balance Sheet Highlights
Cash and cash equivalents
Days sales outstanding (DSO)

Cash Flow Highlights

17
Investment Highlights
 Well positioned in markets with solid medium- to long-term
growth opportunities

 Executing a focused profitable growth strategy
 Large addressable market opportunity
 Diversified revenue stream with attractive customer base

 Strong balance sheet and cash position
 Stable but growing backlog

18
Reconciliation of Non-GAAP Measures
Earnings Before Interest, Taxes, Depreciation, Amortization
In millions
FY 2012
$
33.6
0.7
(3.9)
5.5
(0.1)
(0.3)
$
35.5

FY 2013
$
36.3
0.3
(18.0)
6.9
$
25.5

FY 2011
$
245.9
202.3
$
43.6
17.7%

Net income applicable to TRC Companies, Inc.'s common shareholders
Interest expense
Federal and state income tax provision
Depreciation and amortization
Net loss applicable to noncontrolling interest
Equity in earninngs from unconsolidated affiliates, net of taxes
Accretion charges on preferred stock
Consolidated EBITDA

FY 2011
$
(16.6)
0.8
1.1
4.7
(0.1)
7.3
$
(2.8)

FY 2012
$
301.8
246.5
$
55.3
18.3%

FY 2013
$
320.4
268.5
$
51.9
16.2%

FY 2011
$
12.5
(3.1)
$
9.4

FY 2012
$
19.4
(7.1)
$
12.3

FY 2013
$
14.4
(3.9)
$
10.5 19

Gross Margin and Gross Margin %
In millions
Net service revenue
Cost of services
Gross Margin
Gross Margin %
Free Cash Flow
In millions
Net cash provided by operating activities
Additions to property and equipment
Free Cash Flow

TRC Investor Presentations Q1 2014

  • 1.
  • 2.
    Safe Harbor Statement Certainstatements in this presentation may be forward-looking statements within the meaning of Section 27A of the Securities Act of 1933 and Section 21E of the Securities Exchange Act of 1934. You can identify these statements by forward-looking words such as "may," "expects," "plans," "anticipates," "believes," "estimates," or other words of similar import. You should consider statements that contain these words carefully because they discuss TRC’s future expectations, contain projections of the Company’s future results of operations or of its financial condition, or state other "forward-looking" information. TRC believes that it is important to communicate its future expectations to its investors. However, there may be events in the future that the Company is not able to accurately predict or control and that may cause its actual results to differ materially from the expectations described in its forward-looking statements. Investors are cautioned that all forward-looking statements involve risks and uncertainties, and actual results may differ materially from those discussed as a result of various factors, including, but not limited to, the uncertainty of TRC’s operational and growth strategies; circumstances which could create large cash outflows, such as contract losses, litigation, uncollectible receivables and income tax assessments; regulatory uncertainty; the availability of funding for government projects; the level of demand for TRC’s services; product acceptance; industry-wide competitive factors; the ability to continue to attract and retain highly skilled and qualified personnel; the availability and adequacy of insurance; and general political or economic conditions. Furthermore, market trends are subject to changes, which could adversely affect future results. See the risk factors and additional discussion in TRC’s Annual Report on Form 10-K for the fiscal year ended June 30, 2013, Quarterly Reports on Form 10-Q, and other factors detailed from time to time in the Company’s other filings with the Securities and Exchange Commission. This presentation contains references to non-GAAP metrics such as EBITDA, gross margin and free cash flow. A reconciliation of GAAP to non-GAAP metrics can be found on slide 19. 2
  • 3.
    Company Profile A pioneerin groundbreaking scientific and engineering developments since 1969, TRC is a national engineering, consulting and construction management firm that provides integrated services to three primary markets: Energy | Environmental | Infrastructure   100 + U.S. offices London office  2,900+ employees  www.trcsolutions.com Expert problem solvers NYSE: TRR 3
  • 4.
    Investment Highlights  Wellpositioned in markets with solid medium- to long-term growth opportunities  Executing a focused profitable growth strategy  Large addressable market opportunity  Diversified revenue stream with attractive customer base  Strong balance sheet and cash position  Stable but growing backlog 4
  • 5.
    TRC’s Diversified BusinessModel Net Service Revenue by Segment Environmental 51% Estimated Client Distribution by Industry(1) Power / Utility Other $163M 3% YOY Growth 30% 50% $44M 2% YOY Growth $110M 14% YOY Growth 10% 10% Infrastructure 14% (1) Estimates as of June 2013. Transportation Energy 35% Fiscal Year 2013 Total NSR: $320.4 Million 6% YOY Growth Oil & Gas 5
  • 6.
    51% of TotalNSR Environmental Services Environmental Segment  Permitting and resource management  Remediation and hazardous waste management  Air quality and air measurements  Building sciences, industrial hygiene, and compliance  Solid waste Segment Drivers  Increasing permitting and power plant decommissioning activities  Greenhouse gas rules – CO2  Continued development of upstream, midstream and downstream oil & gas markets  Re-emergence of industrials and related capital spend Net Service Revenue (in millions) $163.2 $159.0 +3% FY 2012 FY 2013 Segment Profit (in millions) $32.0 $30.8 -4% FY 2012 FY 2013 6
  • 7.
    Energy Segment 35% of TotalNSR Energy Services  Electrical transmission, distribution & substation engineering  Energy efficiency  Communications engineering Segment Drivers  Greenhouse gas rule – CO2  Expanding utility capital spend programs on aging transmission and distribution infrastructure  Dynamic revolution in domestic fuel supplies driving shifts in use of utility assets (e.g. Coal ↓, Natural Gas ↑, Renewables ↑, Efficiency ↑) Net Service Revenue (in millions) $109.8 $96.0 +14% FY 2012 FY 2013 Segment Profit (in millions) $23.5 $23.3 -1% FY 2012 FY 2013 7
  • 8.
    Infrastructure Segment 14% of TotalNSR Infrastructure Services  Transportation design services  Civil engineering services  Security consulting & engineering services  Geotechnical engineering & materials inspection  Construction engineering, inspection & management Net Service Revenue (in millions) $44.2 $43.5 +2% FY 2012 FY 2013 Segment Profit (in millions) Segment Drivers  Need to upgrade and repair aging infrastructure, especially bridges and roadways  Additional state funds for capital projects  Expansion of transportation services $8.7 $7.7 +12% FY 2012 FY 2013 8
  • 9.
    Why Clients ChooseTRC  Multi-disciplinary teams implement complex projects  Nationwide network is a crucial asset that can be integral to project success  TRC helps clients:  realize a higher return on investment  manage risks  align project solutions with operational priorities  integrate multiple areas of expertise to arrive at a better solution Concept Delivery & Operations Permitting, Engi neering, & Construction 9
  • 10.
  • 11.
    Working With AllLevels of Government State and Local Federal 11
  • 12.
    Growth Strategy • Investin high-margin organic growth opportunities focused on: • Utility/Power • Oil & Gas • Infrastructure • Pursue strategic acquisitions to enhance service offerings and geographic footprint of all three segments Total & Organic NSR Growth Recent Acquisitions 12% 10% 8% • Ocampo Esta Corp. (Covina operations) Total • GE’s Air Emissions Testing business Organic 6% • Heschong Mahone Group, Inc. 4% • Utility Support Systems, Inc. (USS) 2% 0% Q2 2013 Q3 2013 Q4 2013 Q1 2014 12
  • 13.
    Significant Long TermGrowth Potential Q1 2014 v. Q1 2013 Net Service Revenue (in millions) Net Service Revenue 6% (in millions) 8% $301.8 $320.4 $75.2 $245.9 FY 2011 FY 2012 FY 2013 Q1 2013 $81.3 Q1 2014 13
  • 14.
    Full Year IncomeStatement Highlights FY 2012 FY 2013 Net service revenue $301.8 Cost of services $246.5 $268.5 Gross margin 18.3% 16.2% General and administrative expenses $31.0 $30.7 $(11.1) - Operating income $30.0 $18.6 EBITDA $24.4 $25.5 EBITDA as a % of NSR 8.1% Cost of Services as % of NSR $320.4 7.9% (In millions, except per share data) Arena Towers litigation reversal Federal and state income tax benefit $3.9 $18.0 Net income applicable to TRC Companies, Inc. $33.6 $36.3 Diluted earnings per common share $1.16 $320.4 $301.8 81.7% FY 2012 83.8% FY 2013 G&A Expenses as % of NSR $320.4 $301.8 10.3% 9.6% $1.23 FY 2012 FY 2013 14
  • 15.
    EBITDA Reflects Leveragein Business Model Consolidated EBITDA (in thousands) $24,403 $25,464 8.1% 7.9% FY 2012 FY 2013 $14,435 5.9% FY 2011 Consolidated EBITDA EBITDA Margin 15
  • 16.
    NSR Backlog &New Project Wins Segment NSR Backlog New Project Wins (in millions) $230 $235 $138 $131 $247 Environmental • Sabal Trail Natural Gas Pipeline • Alabama Department of Environmental Management $135 Energy • Public Service New Hampshire EPC Project • NYSERDA Multifamily $40 $60 $58 Infrastructure $52 $44 $54 2011 2012 • Confidential Client – Waste Water Treatment Plant • PennDOT District 4-0 2013 16
  • 17.
    Balance Sheet andCash Flow Highlights (In millions) FY 2012 FY 2013 $16.6 $18.1 78 days 83 days Cash flow from operations $19.4 $14.4 Capital expenditures $7.1 $3.9 Free cash flow $12.3 $10.5 Balance Sheet Highlights Cash and cash equivalents Days sales outstanding (DSO) Cash Flow Highlights 17
  • 18.
    Investment Highlights  Wellpositioned in markets with solid medium- to long-term growth opportunities  Executing a focused profitable growth strategy  Large addressable market opportunity  Diversified revenue stream with attractive customer base  Strong balance sheet and cash position  Stable but growing backlog 18
  • 19.
    Reconciliation of Non-GAAPMeasures Earnings Before Interest, Taxes, Depreciation, Amortization In millions FY 2012 $ 33.6 0.7 (3.9) 5.5 (0.1) (0.3) $ 35.5 FY 2013 $ 36.3 0.3 (18.0) 6.9 $ 25.5 FY 2011 $ 245.9 202.3 $ 43.6 17.7% Net income applicable to TRC Companies, Inc.'s common shareholders Interest expense Federal and state income tax provision Depreciation and amortization Net loss applicable to noncontrolling interest Equity in earninngs from unconsolidated affiliates, net of taxes Accretion charges on preferred stock Consolidated EBITDA FY 2011 $ (16.6) 0.8 1.1 4.7 (0.1) 7.3 $ (2.8) FY 2012 $ 301.8 246.5 $ 55.3 18.3% FY 2013 $ 320.4 268.5 $ 51.9 16.2% FY 2011 $ 12.5 (3.1) $ 9.4 FY 2012 $ 19.4 (7.1) $ 12.3 FY 2013 $ 14.4 (3.9) $ 10.5 19 Gross Margin and Gross Margin % In millions Net service revenue Cost of services Gross Margin Gross Margin % Free Cash Flow In millions Net cash provided by operating activities Additions to property and equipment Free Cash Flow