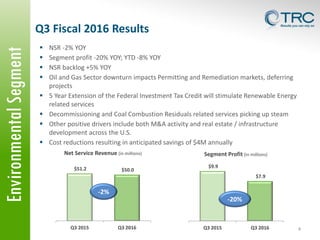
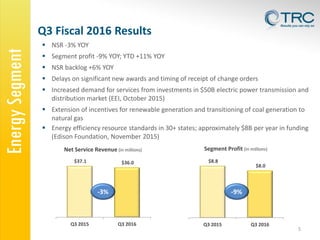
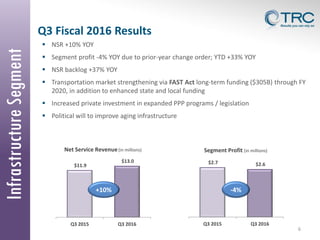
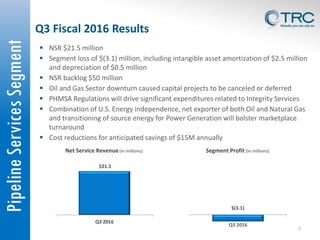
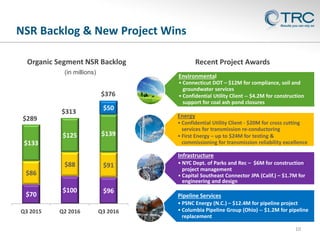
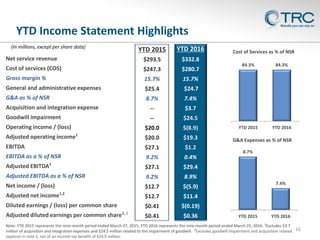
The document provides an overview of TRC Solutions' Q3 2016 financial results. Key points include:
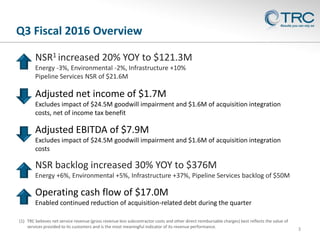
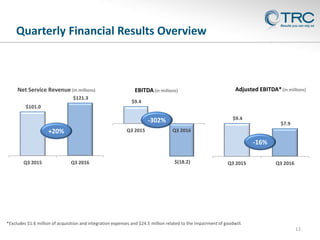
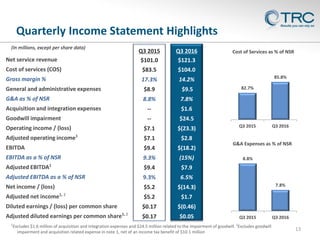
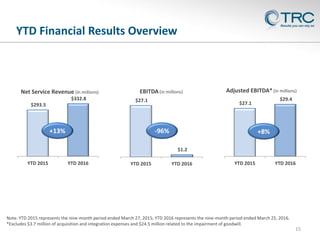
1) Net service revenue increased 20% year-over-year to $121.3 million, with growth in infrastructure and declines in energy and environmental.
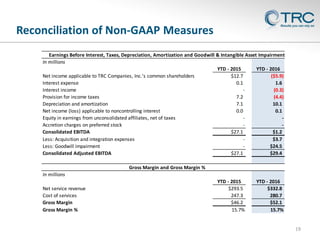
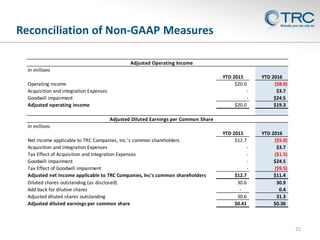
2) Adjusted EBITDA was $7.9 million, excluding one-time acquisition and integration costs and a goodwill impairment.
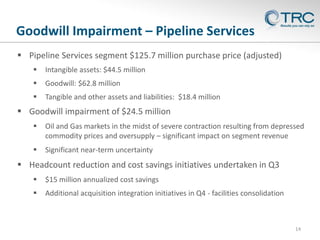
3) A goodwill impairment charge of $24.5 million was recorded for the pipeline services segment due to challenges in the oil and gas market.
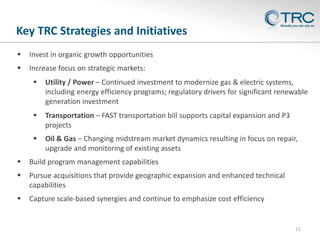
4) The company continues focusing on organic growth opportunities in strategic markets like utilities and transportation infrastructure.