Download to read offline

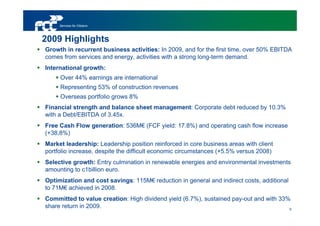


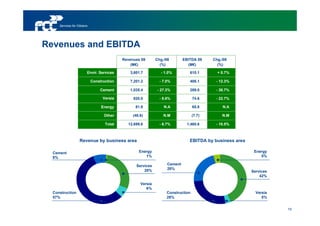


1. FCC reported its 2009 results, with over 50% of EBITDA coming from recurrent services and energy businesses. 2. Key figures included revenues of €12.7 billion (down 6.7%) and net income of €307 million (down 8%). 3. FCC has a more balanced business model with infrastructure, services, and energy activities, and over 44% of earnings coming from international markets.


