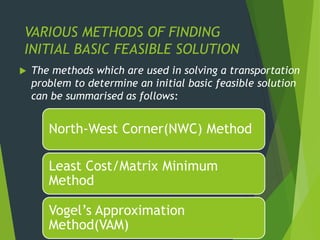
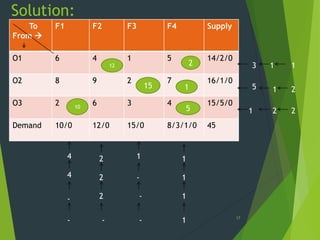
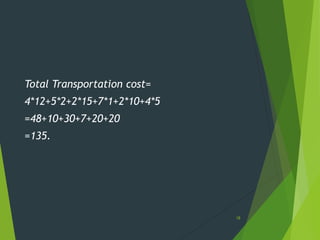
1) The document discusses three methods for finding an initial basic feasible solution to transportation problems: the North-West Corner method, Least Cost/Matrix Minimum method, and Vogel's Approximation Method.
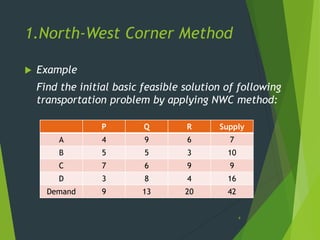
2) The North-West Corner method works by sequentially filling cells beginning from the northwest corner based on minimum supply or demand values.
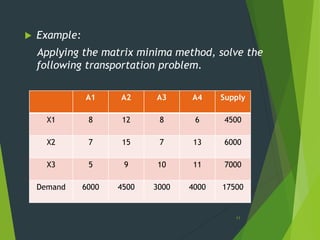
3) The Least Cost method selects the cell with the minimum unit cost and allocates the maximum possible units to it, eliminating satisfied rows and columns until complete.
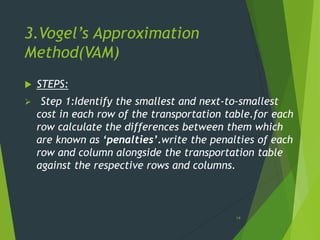
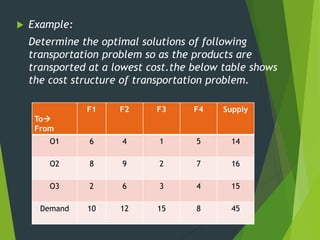
4) Vogel's Approximation Method identifies row and column penalties based on cost differences and sequentially fills the cell in the row or column with the largest penalty.