Transit Mode Selection Tool Development Phase 2 Poster_Carly_Queen
1. Transit Mode Selection Tool Development: Phase 2 (Transit Planning Organization Survey)
Carly Queen | B.S.M.E. 2009, Master of City and Regional Planning Candidate 2016, M.S.-C.E. Candidate 2016 | Georgia Institute of Technology
Advisors: Dr. Kari E. Watkins, P.E. and Dr. Catherine Ross
Respondents
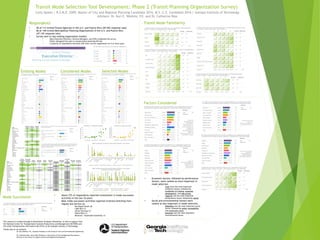
• 56 of 113 invited Transit Agencies in the U.S. and Puerto Rico (49.56% response rate)
• 66 of 140 invited Metropolitan Planning Organizations in the U.S. and Puerto Rico
(47.14% response rate)
• Survey sent to top-ranking organization leaders
• Many Executive Directors, General Managers, and CEOs completed the survey
• Others delegated the task to transportation planning officials
• A majority of respondents had been with their current organization for 9 or more years
Transit Mode Familiarity
Existing Modes Considered Modes Selected Modes
Mode Succession
Factors Considered
Demand (2)
Appropriateness of
Technology (1)
Cost effectiveness (1)
FRA Compliance (1)
Land-use Allocation (1)
Livability and
Accessibility (1)
Proven Technology and
Market (1)
Ridership, Past Plans, and
Affordable Housing (1)
Air Quality and Visual
Factors (1)
Environmental Justice (1)
Land-use Allocation (1)
Congestion and Pavement
Condition (1)
Estimated Ridership (1)
Market Potential (1)
Service Requirements (1)
Vehicle Battery Capacity (1)
Equity (2)
Congestion Mitigation (1)
Demographics (1)
Equal Justice (1)
Health and ADA
Accessibility (1)
• Economic factors, followed by performance
factors, were ranked as more important in
mode selection.
• Costs were the most important
economic factors, followed by
availability of funding, economic
development, and jobs access.
• Capacity was the most important
performance factor, followed by speed.
• Social and environmental factors were
ranked as less important in mode selection.
• Reliability was the most important social
factor, followed by safety, accessibility,
and community views.
• Emissions was the most important
environmental factor.
Bus
Funitel
0
20
40
60
80
100
1 2 3 4 5
AgenciesConsideringMode
Familiarity (1 = Not Familiar, 5 = Very Familiar)
Familiarity vs. Consideration by Mode
Bus
Funitel
0
10
20
30
40
50
60
70
80
1 2 3 4 5
AgenciesSelectingMode
Familiarity (1 = Not Familiar, 5 = Very Familiar)
Familiarity vs. Selection by Mode
• About 27% of respondents reported involvement in mode succession
activities in the last 10 years.
• Most mode succession activities reported involved switching from
regular bus service to:
• Bus Rapid Transit (9)
• Light Rail (7)
• Aerial Tramway (1)
• Hybrid Rail (1)
• Monorail / Automated Guideway (1)
This research is funded through an Eisenhower Graduate Fellowship, as well as support from
the National Center for Transportation Systems Productivity and Management (NCTSPM) and
the Urban Transportation Information Lab (UTIL) at the Georgia Institute of Technology.
Thanks also to my advisors:
Dr. Kari Watkins, P.E., Assistant Professor in the School of Civil and Environmental Engineering
Dr. Catherine Ross, Harry West Professor in the School of City and Regional Planning and
Director of the Center for Quality Growth and Regional Development
Mode
Considered
/ Existing
Selected /
Considered
Selected /
Existing
Aerial Tramway 2.00 0.25 0.50
Bus 0.99 0.83 0.82
Bus Rapid Transit 2.56 0.67 1.72
Cable Car 0.00 - 0.00
Commuter Bus 1.06 0.53 0.56
Commuter Rail 1.78 0.68 1.22
Demand Response 0.70 0.52 0.36
Ferryboat 0.65 0.54 0.35
Funitel - 0.00 -
Gondola - 0.00 -
Heavy Rail 1.31 0.53 0.69
Hybrid Rail 4.00 0.50 2.00
Inclined Plane 0.00 - 0.00
Jitney 2.00 1.00 2.00
Light Rail 2.22 0.57 1.26
Maglev - 0.00 -
Monorail / Automated Guideway 1.57 0.18 0.29
Publico 1.00 1.00 1.00
Streetcar Rail 2.55 0.43 1.10
Taxi 0.40 0.40 0.16
Trolleybus 1.20 0.44 0.53
Vanpool 0.74 0.41 0.30
Water Bus 1.33 0.50 0.67
Water Taxi 3.33 0.50 1.67
Mode
(Existing,
Considered) /
Existing
(Not Existing,
Considered) /
Not Existing
Existing,
Considered
Existing, Not
Considered
Existing,
Selected
Existing, Not
Selected Not Existing
Not Existing,
Considered
Not Existing,
Not
Considered
Not Existing,
Selected
Not Existing,
Not Selected
Aerial Tramway 0.50 0.02 1 1 1 0 125 3 122 0 3
Bus 0.86 0.33 78 13 67 11 36 12 24 8 4
Bus Rapid Transit 0.91 0.56 29 3 29 0 95 53 42 26 27
Cable Car 0.00 0.00 0 1 0 0 126 0 126 0 0
Commuter Bus 0.73 0.23 38 14 22 16 75 17 58 7 10
Commuter Rail 0.91 0.29 29 3 25 4 95 28 67 14 14
Demand Response 0.60 0.16 46 31 25 21 50 8 42 3 5
Ferryboat 0.50 0.03 10 10 6 4 107 3 104 1 2
Funitel - 0.01 0 0 0 0 127 1 126 0 1
Gondola - 0.03 0 0 0 0 127 4 123 0 4
Heavy Rail 0.69 0.07 9 4 7 2 114 8 106 2 6
Hybrid Rail 1.00 0.05 2 0 2 0 125 6 119 2 4
Inclined Plane 0.00 0.00 0 2 0 0 125 0 125 0 0
Jitney 0.00 0.02 0 1 0 0 126 2 124 2 0
Light Rail 0.96 0.28 22 1 20 2 104 29 75 9 20
Maglev - 0.05 0 0 0 0 127 6 121 0 6
Monorail / Automated Guideway 0.71 0.05 5 2 2 3 120 6 114 0 6
Publico 1.00 0.00 1 0 1 0 126 0 126 0 0
Streetcar Rail 0.85 0.32 17 3 13 4 107 34 73 9 25
Taxi 0.20 0.05 5 20 0 5 102 5 97 4 1
Trolleybus 0.67 0.07 10 5 5 5 112 8 104 3 5
Vanpool 0.48 0.17 24 26 9 15 77 13 64 6 7
Water Bus 1.00 0.01 3 0 2 1 124 1 123 0 1
Water Taxi 0.67 0.06 2 1 0 2 124 8 116 5 3
0.00
0.10
0.20
0.30
0.40
0.50
0.60
0.70
0.80
0.90
1.00
Mode Consideration and Selection when Mode is Existing vs. Not Existing
(Proportion of Instances Considered)
(Existing, Considered) / Considered (Not Existing, Considered) / Considered
(Existing, Selected) / Considered (Not Existing, Selected) / Considered
0
10
20
30
40
50
60
70
80
90
Mode Consideration and Selection when Mode is Existing vs. Not Existing
Existing, Considered Not Existing, Considered Existing, Selected Not Existing, Selected