Download to read offline
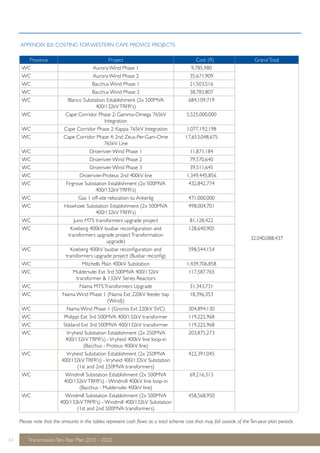


The document is Eskom's Transmission Ten-Year Development Plan (TDP) for 2013-2022, which outlines Eskom's plans to develop South Africa's transmission network over the next decade. It provides an overview of key factors like load demand forecasts, new generation assumptions, and major transmission projects planned for each province. The publication aims to inform stakeholders of developments to ensure a reliable electricity supply as load increases and accommodate new generation connections across South Africa and the region. It outlines approximately R149 billion in planned transmission investment over 10 years, including projects for reliability, generation integration, and new customer connections.


