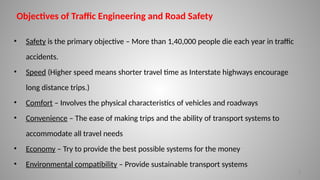
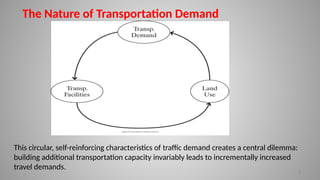
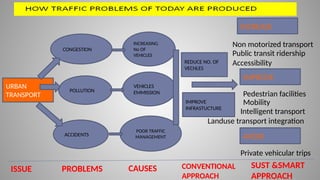
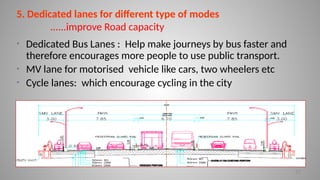
1
For effective transportation system, Integration of 5 P is required
Politician: for making the policies
Policies : for making scheme and standards
Planners : for making proposal and Solutions
Police : for enforcement and Management
People : for making the system Efficient
2
Objectives of Traffic Engineering and Road Safety
• Safety is the primary objective – More than 1,40,000 people die each year in traffic
accidents.
• Speed (Higher speed means shorter travel time as Interstate highways encourage
long distance trips.)
• Comfort – Involves the physical characteristics of vehicles and roadways
• Convenience – The ease of making trips and the ability of transport systems to
accommodate all travel needs
• Economy – Try to provide the best possible systems for the money
• Environmental compatibility – Provide sustainable transport systems
3
The Nature of Transportation Demand
This circular, self-reinforcing characteristics of traffic demand creates a central dilemma:
building additional transportation capacity invariably leads to incrementally increased
travel demands.
AVOID
VEHICLES
EMMISSION
POOR TRAFFIC
MANAGEMENT
POLLUTION
ACCIDENTS
INCREASING
No OF
VEHICLES
CONGESTION
URBAN
TRANSPORT
ISSUE CAUSES
PROBLEMS CONVENTIONAL
APPROACH
REDUCE NO. OF
VECHLES
IMPROVE
INFRASTUCTURE
4
SUST &SMART
APPROACH
INCREASE
IMPROVE
Pedestrian facilities
Non motorized transport
Public transit ridership
Mobility
Private vehicular trips
Intelligent transport
Landuse transport integration
Accessibility
Road Safety
Congestion
reduction
Accidents
prevention
may Associate with
Management &
Enforcement
POOR INFRASTRUCTURE & TRAVEL BEHAVIOR
LEADS TO ACCIDENTS
Facts about Traffic Congestion & Road accidents
• 0.14 million people are killed in road accidents every year
• 16 death per hour
• Over speed resulting from time lost in traffic jams is a major
cause for road accident (22%)
• At least 120,000 lives can be saved, every year, if traffic
congestions are reduced
• Carbon credits per day (Rs. 80 crores)
• Reduced Green House Gas emissions: 13.4 lakh tons per year
8
…according to MORTH
20022003200420052006200720082009201020112012201320142015
0
200000
400000
600000
800000
1000000
1200000
Total Number of Vehicles
Year
Total
Vehicles
Source: Based on RTO, Bhopal
2002
2003
2004
2005
2006
2007
2008
2009
2010
2011
2012
2013
2014
2015
2016
2017
2018
2019
2020
2021
0
500000
1000000
1500000
2000000
2500000
Total Vehicles
Source: CMP Bhopal 2012
VEHICLES GROWTH RATE
Private Vehicle Growth rate: 13.15% (annual)
Infrastructure growth index: 3.47 %
(in terms of funds/road area )
10
2. Incidents (Accidents and breakdown)
• Poor road geometry
- Curves
- Road elevations
- Site distance
• Poor road condition
- Surface quality
- Type of pavements
- Coordination for maintenance
• Lack of infrastructures
-Proper Signage
• Driving behavior
• Public awareness
Congestion measures approach
Travel Demand Management
Traffic Management
Enforcement Capacity Augmentation
Sustainable and Smart Approach
11
Parking Management
12
1. TRAVEL DEMAND MANAGEMENT
• Car pooling and other riding share programs:
- Discourage vehicle owners from making unnecessary journeys.
- Motivating commuters to pool their cars.
- Promotion of web and sms based pooling systems
• Park and Ride schemes:
- Park and ride facilities allowing parking at a distance and allowing
continuation by public transport or ride sharing.
13
• Road Pricing and Entry fee: It has a dual advantage, it reduces
traffic on the roads and generates funds that can go towards
improving alternative systems of transport
•Charted buses services and Incentives to use public transport.
• Parking restraints: Most transport planning experts agree that
free parking distorts the market in favour of car travel, increase
congestion.
• Peripheral parking schemes: Parking outside the CBD area
14
2. TRAFFIC MANAGEMENT
Why management required
• Reduce traffic congestion
• Improve mobility
• Providing safe and comfortable journey
• Optimum uses of resources
• Pollution mitigation
2. Congestion pricing: to stop entering vehicle in congested area………….
Imposing higher charges during peak periods, to make it move
costly hence less desirable may avoid to travel in peak times
15
• Users during peak periods are charged more than non peak hours
• Raising peak period transit fair
• Parking surcharges
3. One Way Streets: Increasing capacity of lanes
• Reduction in the number of conflicts
• Reduction in Travel Time
• Reduction in Delays
• Increased veh-km
• Achieving optimum capacity of the road
3. Reversible lanes (Tidal Flow)
• When directional flow is imbalanced 65:35 split reversible lanes can be
introduced during peak period
• Applicable to roads not separated by medians
• Signing, lane use control devices, overhead signals etc,are to be planned
properly
16
17
5. Dedicated lanes for different type of modes
......improve Road capacity
• Dedicated Bus Lanes : Help make journeys by bus faster and
therefore encourages more people to use public transport.
• MV lane for motorised vehicle like cars, two wheelers etc
• Cycle lanes: which encourage cycling in the city
18
From TRIP , IIT D
19
3. Enforcement and Capacity Augmentation
• Built additional Mainline capacity
• Proper Signage system & Geometric Design
• Improve and maintenance of road surface
• Improve public awareness with social activities
• Imposing high Penalty and fines
• Incident management : Introduce transportation
Management Center for
- Facility Management
- Corridor Management
- Regional Management
• Advanced Traveler information: Provided to users of transportation
systems, travel-related information to assist decision making on route choices,
estimate travel times, and avoid congestion.
- Variable massage Signs
- Dynamic route Guidance
- smart poles
• Use technology to better manage traffic :
- Signal sincronisaion
- Intelligent transportation system
- GPS based information
• Bicycle integration
• One ticket for all trips’ strategy. 20
4. Smart and Sustainable Approach
Improve NMT Infrastructure
Key Elements:
• Reserve Right of Way
• Develop appropriate urban environment
• Intersection treatments
• Traffic calming strategies
• other amenities
Wide Footpaths
Signalised Pedestrian crossing At grade Pedestrian crossing Segregated Foot Paths, Delhi BRTS
Driver Road infrastructure
Vehicle
Road accidents is seen as a failure of the whole traffic system
(interaction between the three elements) rather than a failure of
the driver
Road safety…….. measures
24
Holistic approach to accident prevention
The road infrastructure
The driver
The vehicle
Motivation
Training
Selection
Improve
functional
ability
Design may influence
drivers motivation
Reduce mental workload and
driver error, reduce injury
Reduce mental workload
and consequenses of
driver error
Reduce injury if an
accident occurs
25
Three components of driver behaviour which may cause accidents
• Slips and lapses
• Errors (mistakes)
• Violations
Based on Reason (1990), further developed by Parker et al. (1995):
26
Violations Driving expression
of underlying
motivation
Speeding, close
following,
dangerous
overtaking
Motivational and
social factors
Slips and lapses Technical mastery Choosing the
wrong gear
Influenced by:
Cognitive and
motor skills
Errors (mistakes) Reading the road
hazard perception
Misjudge the
distance to an
approaching car
Fail to notice a
“Wrong Way”
Sign
CAUSES REASONS
COMPONENTS
• Twenty percent of drivers text while driving
• Cell phones cause 1.4 million crashes each year
• 18 percent of fatalities are distraction-related
• 30-39- year-olds have the highest proportion of cell phone distraction
in fatal crashes
…..It is observed
Factors affecting Road Traffic Crashes:--
• Types of roads and road users.
• Colliding vehicles.
• Environment and road related factors like road geometry, design, visibility,
diversions etc.
• Vehicle related causing traffic mix.
• Inexperienced, untrained and underage, cyclists and rickshaw pullers on the road
with no separate path for them.
• Presence of beggars on busy road junctions and traffic lights.
• Use of mobile phones while driving.
• Drug addiction.
• Presence of wine outlets near the roads.
• Sale of lotteries, helmets etc near roadside.

Traffic Engineering for Road Safety Audit

  • 1.
    1 For effective transportationsystem, Integration of 5 P is required Politician: for making the policies Policies : for making scheme and standards Planners : for making proposal and Solutions Police : for enforcement and Management People : for making the system Efficient
  • 2.
    2 Objectives of TrafficEngineering and Road Safety • Safety is the primary objective – More than 1,40,000 people die each year in traffic accidents. • Speed (Higher speed means shorter travel time as Interstate highways encourage long distance trips.) • Comfort – Involves the physical characteristics of vehicles and roadways • Convenience – The ease of making trips and the ability of transport systems to accommodate all travel needs • Economy – Try to provide the best possible systems for the money • Environmental compatibility – Provide sustainable transport systems
  • 3.
    3 The Nature ofTransportation Demand This circular, self-reinforcing characteristics of traffic demand creates a central dilemma: building additional transportation capacity invariably leads to incrementally increased travel demands.
  • 4.
    AVOID VEHICLES EMMISSION POOR TRAFFIC MANAGEMENT POLLUTION ACCIDENTS INCREASING No OF VEHICLES CONGESTION URBAN TRANSPORT ISSUECAUSES PROBLEMS CONVENTIONAL APPROACH REDUCE NO. OF VECHLES IMPROVE INFRASTUCTURE 4 SUST &SMART APPROACH INCREASE IMPROVE Pedestrian facilities Non motorized transport Public transit ridership Mobility Private vehicular trips Intelligent transport Landuse transport integration Accessibility
  • 5.
  • 6.
    POOR INFRASTRUCTURE &TRAVEL BEHAVIOR
  • 7.
  • 8.
    Facts about TrafficCongestion & Road accidents • 0.14 million people are killed in road accidents every year • 16 death per hour • Over speed resulting from time lost in traffic jams is a major cause for road accident (22%) • At least 120,000 lives can be saved, every year, if traffic congestions are reduced • Carbon credits per day (Rs. 80 crores) • Reduced Green House Gas emissions: 13.4 lakh tons per year 8 …according to MORTH
  • 9.
    20022003200420052006200720082009201020112012201320142015 0 200000 400000 600000 800000 1000000 1200000 Total Number ofVehicles Year Total Vehicles Source: Based on RTO, Bhopal 2002 2003 2004 2005 2006 2007 2008 2009 2010 2011 2012 2013 2014 2015 2016 2017 2018 2019 2020 2021 0 500000 1000000 1500000 2000000 2500000 Total Vehicles Source: CMP Bhopal 2012 VEHICLES GROWTH RATE Private Vehicle Growth rate: 13.15% (annual) Infrastructure growth index: 3.47 % (in terms of funds/road area )
  • 10.
    10 2. Incidents (Accidentsand breakdown) • Poor road geometry - Curves - Road elevations - Site distance • Poor road condition - Surface quality - Type of pavements - Coordination for maintenance • Lack of infrastructures -Proper Signage • Driving behavior • Public awareness
  • 11.
    Congestion measures approach TravelDemand Management Traffic Management Enforcement Capacity Augmentation Sustainable and Smart Approach 11 Parking Management
  • 12.
    12 1. TRAVEL DEMANDMANAGEMENT • Car pooling and other riding share programs: - Discourage vehicle owners from making unnecessary journeys. - Motivating commuters to pool their cars. - Promotion of web and sms based pooling systems • Park and Ride schemes: - Park and ride facilities allowing parking at a distance and allowing continuation by public transport or ride sharing.
  • 13.
    13 • Road Pricingand Entry fee: It has a dual advantage, it reduces traffic on the roads and generates funds that can go towards improving alternative systems of transport •Charted buses services and Incentives to use public transport. • Parking restraints: Most transport planning experts agree that free parking distorts the market in favour of car travel, increase congestion. • Peripheral parking schemes: Parking outside the CBD area
  • 14.
    14 2. TRAFFIC MANAGEMENT Whymanagement required • Reduce traffic congestion • Improve mobility • Providing safe and comfortable journey • Optimum uses of resources • Pollution mitigation
  • 15.
    2. Congestion pricing:to stop entering vehicle in congested area…………. Imposing higher charges during peak periods, to make it move costly hence less desirable may avoid to travel in peak times 15 • Users during peak periods are charged more than non peak hours • Raising peak period transit fair • Parking surcharges 3. One Way Streets: Increasing capacity of lanes • Reduction in the number of conflicts • Reduction in Travel Time • Reduction in Delays • Increased veh-km • Achieving optimum capacity of the road
  • 16.
    3. Reversible lanes(Tidal Flow) • When directional flow is imbalanced 65:35 split reversible lanes can be introduced during peak period • Applicable to roads not separated by medians • Signing, lane use control devices, overhead signals etc,are to be planned properly 16
  • 17.
    17 5. Dedicated lanesfor different type of modes ......improve Road capacity • Dedicated Bus Lanes : Help make journeys by bus faster and therefore encourages more people to use public transport. • MV lane for motorised vehicle like cars, two wheelers etc • Cycle lanes: which encourage cycling in the city
  • 18.
  • 19.
    19 3. Enforcement andCapacity Augmentation • Built additional Mainline capacity • Proper Signage system & Geometric Design • Improve and maintenance of road surface • Improve public awareness with social activities • Imposing high Penalty and fines • Incident management : Introduce transportation Management Center for - Facility Management - Corridor Management - Regional Management
  • 20.
    • Advanced Travelerinformation: Provided to users of transportation systems, travel-related information to assist decision making on route choices, estimate travel times, and avoid congestion. - Variable massage Signs - Dynamic route Guidance - smart poles • Use technology to better manage traffic : - Signal sincronisaion - Intelligent transportation system - GPS based information • Bicycle integration • One ticket for all trips’ strategy. 20 4. Smart and Sustainable Approach
  • 21.
    Improve NMT Infrastructure KeyElements: • Reserve Right of Way • Develop appropriate urban environment • Intersection treatments • Traffic calming strategies • other amenities Wide Footpaths Signalised Pedestrian crossing At grade Pedestrian crossing Segregated Foot Paths, Delhi BRTS
  • 23.
    Driver Road infrastructure Vehicle Roadaccidents is seen as a failure of the whole traffic system (interaction between the three elements) rather than a failure of the driver Road safety…….. measures
  • 24.
    24 Holistic approach toaccident prevention The road infrastructure The driver The vehicle Motivation Training Selection Improve functional ability Design may influence drivers motivation Reduce mental workload and driver error, reduce injury Reduce mental workload and consequenses of driver error Reduce injury if an accident occurs
  • 25.
    25 Three components ofdriver behaviour which may cause accidents • Slips and lapses • Errors (mistakes) • Violations Based on Reason (1990), further developed by Parker et al. (1995):
  • 26.
    26 Violations Driving expression ofunderlying motivation Speeding, close following, dangerous overtaking Motivational and social factors Slips and lapses Technical mastery Choosing the wrong gear Influenced by: Cognitive and motor skills Errors (mistakes) Reading the road hazard perception Misjudge the distance to an approaching car Fail to notice a “Wrong Way” Sign CAUSES REASONS COMPONENTS
  • 27.
    • Twenty percentof drivers text while driving • Cell phones cause 1.4 million crashes each year • 18 percent of fatalities are distraction-related • 30-39- year-olds have the highest proportion of cell phone distraction in fatal crashes …..It is observed
  • 28.
    Factors affecting RoadTraffic Crashes:-- • Types of roads and road users. • Colliding vehicles. • Environment and road related factors like road geometry, design, visibility, diversions etc. • Vehicle related causing traffic mix. • Inexperienced, untrained and underage, cyclists and rickshaw pullers on the road with no separate path for them. • Presence of beggars on busy road junctions and traffic lights. • Use of mobile phones while driving. • Drug addiction. • Presence of wine outlets near the roads. • Sale of lotteries, helmets etc near roadside.

Editor's Notes

  • #26    Driving skills divided into two sub-components Slips refers to more technical mastery, such errors are not believed to be dangerous, more embarrassing for the driver. usually harmless but irritating, and include: turning on the wipers when you mean to indicate, realizing you have no clear recollection of the road you have just driven along Hitting the brake instead of the gas pedal Error refers to the failure of planned actions to reach their goal – Errors are potentially dangerous mistakes and slips, such as misjudging the speed of oncoming traffic when attempting to overtake, failing to notice a Give Way sign at a junction failing to see an oncoming vehicle at a junction Both are believed to be influenced by cognitive factors (attention, and to the degree behaviour is automatised . Especially problematic for older drivers, but also for younger when beginning to drive The higher up, the ore conscious decision making Driving style refers to what the driver choose to do with his skills – deliberate actions to offend. Violations are committed intentionally and in the knowledge that one is engaging in potentially dangerous and often illegal behaviour. Speeding, close following overtaking on the inside are all violations. Still inexperience seems to be of importance for younger drivers, cognitive skills for older drivers Uncertain relation between skills and accidents – actually, increase in skills has be found increase prob. Of being involved in accidents