Would you like to learn secrets of price action trading which is used in every day trading by a 15 years trader? Continue reading on to learn real examples of how price action trading works on Forex, stock futures and gold charts!
Stop Trading Support And Resistance The Wrong WayNetpicksTrading
Stop Trading Support And Resistance The Wrong Way
- See more at: http://www.netpicks.com/support-resistance/
Support and resistance trading is a popular technical analysis method of trading. The bad part is that many traders enter trades blindly at these levels without a firm understanding of what they mean.
Learn about trading support and resistance and see if your trading results improve.
- See more at: http://www.netpicks.com/support-resistance/
- Visit our website: http://www.netpicks.com/
- Download the free indicator blueprint: http://www.netpicks.com/blueprint/
- Options Hot List PLUS Training: http://www.netpicks.com/oftbrightbreakthroughs
support, resistance, support and resistance trading, reversals, trend
What are some of the advantages of using a scalping strategy to trade the forex market? - Quick profits Entry and exit is usually done within a couple of minutes. This allows for quick profits but can lead to quick losses as well. - Exit is usually within 20 minutes or less - Lots of trades Strategy uses 3 Indicators The strategy uses 3 indicators: pivot points, Fibonacci retracement and the Stochastic Oscillator. The 3 main pivot points both above and below the pivot are used for this system: S1, S2, S3 and R1, R2, R3. The Fibonacci retracement values used are the 0.618, the 0.382 and the 0.500 levels. The Stochastic Oscillator is set at 5,3,3.
Top 8 Forex Trading Strategies That Pro Traders UseSyrous Pejman
In this slideshow find the best Forex trading strategies including chart patterns, price rejection, correlation trading, volume-price analysis, long term daily and weekly trading, news and sentiment trading strategies. Besides, you will learn the best money and risk management methods and also the best advice by the experts to control your psychology during your trades.
Click here for more information on range trading
http://www.netpicks.com/simple-range-trading-strategy/
Here is some information on range trading:
It’s been said that a market only trends 30% of the time.
I can’t quantify that figure but having a range trading strategy to take advantage of the other 70% is good business.
Range trading is not difficult however it does require discipline and a method of determining when a trading range is in play.
For more information on range trading click here:
http://www.netpicks.com/simple-range-trading-strategy/
forex trading strategy that you can make money with. Can also be use by using your android and iphone metatrader.
The settings on the indicator are easy to setup. The strategy best time frame is h4 and hourly chart.
http://www.pipsumo.com/2017/04/parabolic-sar-trading-strategy.html
Bollinger bands strategy - With Moving Averaga (BBMA)pipsumo traderfx
This forex trading strategy will be use 2 indicators.
The Bollinger bands and moving average.
Those 2 forex indicator will have rules and steps to find the entry.
In this file, you will have the bollinger bands basic settings and also the 2 moving average settings.
4 step buy and sell entry setup.
1. THE BEST STRATEGIES THAT CAN BE USED WHEN TRADING
2. THE CANDLES GETTING SMALLER AND SMALLER AS APPROACH THE SUPPORT OR RESISTANCE
• THE CANDLES GETTING SMALLER AND SMALLER AS APPROACH THE SUPPORT OR RESISTANCE
• WHEN THE CANDLES GETTING SMALLER AND SMALLER ALONG with THE TREND AND THE LAST CANDLES IS THE LONG WICK CANDLES, IT MEANS THE PRICE POSSIBLY GOING REVERSAL
3. THE CANDLES GETTING SMALLER AND SMALLER AS APPROACH THE SUPPORT OR RESISTANCE
• THE CANDLES GETTING SMALLER AND SMALLER AS APPROACH THE SUPPORT OR RESISTANCE
• WHEN THE CANDLES GETTING SMALLER AND SMALLER ALONG, with THE TREND, IT MEANS THE PRICE POSSIBLY GOING REVERSAL.
4. BULLISH CANDLES STICK ( BULLISH ENGULFING) AND BEARISH CANDLESTICK ( BEARISH ENGULFING)
• ALL THE GREEN CANDLES ALONG THE UPTREND
• THE CANDLES COLOUR CHANGES AT THE SUPPORT OR RESISTANCE LEVEL
• GREEN CANDLES MEANS THE BULLISH PRICE ACTION
• THREE GREEN CANDLES ALONG THE UPTREND, THEN NEXT CANDLES BECOME RED CANDLES AND THE RED CANDLES APPEAR AT THE RESISTANCE
5. ALL THE GREEN CANDLES ALONG THE UPTREND
• THE CANDLES COLOUR CHANGES AT THE SUPPORT OR RESISTANCE LEVEL
• RED CANDLES MEANS THE BEARISH PRICE ACTION
• RED CANDLES ALONG THE DOWNTREND, THEN NEXT CANDLES BECOME GREEN CANDLES AND THE RED CANDLES APPEAR AT THE SUPPORT
6. CANDLES PATTERN THAT WORK IN TRADING
• LONG WICK CANDLES
• INSIDE BAR CANDLES
• MOMENTUM CANDLES
• MULTIPLE CANDLES REJECTION
7. LONG WICK CANDLE
• THE LONG WICK CANDLE IN THE PICTURE REPRESENTS THE SELLERS TRIES TO PUSH THE PRICE DOWN BUT FAILED, SO THE WICK TO STICK OUT.
• AS YOU CAN SEE IN THE PICTURE, IN THE DOWNTREND, THERE HAS THREE RED CANDLES, THEREFORE ONE GREEN CANDLES AND THE GREEN CANDLES REPRESENT THE LONG WICK CANDLES, SO MEANS THE PRICE ACTION GOING REVERSAL.
8. INSIDE BAR CANDLES
• THE HIGH AND LOW OF THE CANDLES IS INSIDE THE HIGH AND LOW OF PREVIOUS CANDLES
• MEANS MOMENTUM LOSS OCCURRING
• AS THE PICTURE BESIDES, SHOW THE PRICE ACTION FAILED TO MAKE HIGHER HIGH
• MEANS THE PRICE ACTION GOING REVERSAL
9. MOMENTUM CANDLES
• THE CANDLE BODY IS BIGGER THAN THE PREVIOUS CANDLE BODY.
• MORE CONFIRMATION FOR THE MARKET
• THE MOMENTUM CANDLES IN THE PICTURE BESIDES SHOW THE MORE CONFIRMATION THE MARKET IS GOING DOWNWARD TREND
10. MULTIPLE CANDLES REJECTION
• MORE THAN ONE CANDLES REJECT THE KEY LEVEL
• SHOW THAT PRICE TRIED OVER AGAIN AND AGAIN TO PUSH TO THE LEVEL BUT FAILED
11. STACK CANDLESTICK PATTERNS TOGETHER
• DIFFERENT CANDLES PATTERNS TOGETHER
• AS THE PICTURE SHOWS HAS THREE DIFFERENT CANDLESTICK PATTERNS, WHICH ARE INSIDE BAR, MOMENTUM AND CANDLES GETTING SMALLER AND SMALLER ALONG THE UPTREND.
12. THANK YOU
Forex Trading - How to Create a Trading StrategyBlueMax Capital
Forex trading how to create a trading strategy. The Forex Fundamental Analysis, Technical Analysis, Risk Management, Rules Successful Forex Traders Follow and Reasons Why Forex Traders Fail.
The best swing trading strategies are the ones that allow you to trade and profit from your beliefs about the market. I have added some of the most popular swing trading indicators as a guide for you to explore. The swing trading indicators listed here focus on trend trading, volatility, and overbought/oversold conditions.
TradersCockpit.com is India's leading Cloud based platform Firm providing Markets Analytics Software Solutions to every Trader, Investor whether newbie or expert using power of technical & fundamental analysis.
It gives you give you the power for leveraging strategy/algorithmic based trading without you writing a single line of code. To learn more about TradersCockpit.com can help you, please go through the presentation as it explains in detail about TradersCockpit Product Offering.
QNBFS Daily Technical Trader - Qatar for August 26 2018 التحليل الفني اليومي ...QNB Group
We mentioned in previous reports that the 10,000 psychological resistance level is expected to be strong and the RSI indicated possible correction is valid; the Index corrected since then.
QNBFS Daily Technical Trader Qatar - November 18 2019 التحليل الفني اليومي لب...QNB Group
The Index reached the upper side of the flattish, and now testing the moving averages after it broke below the short- term uptrend channel. That being said, a breakout above that side of the flattish channel means a stronger possibility of a bullish move towards the 11,000 mark.
QNBFS Daily Technical Trader Qatar - October 29 2019 التحليل الفني اليومي لبو...QNB Group
The Index reached the upper side of the flattish, and now testing the moving averages after it broke below the short- term uptrend channel. That being said, a breakout above that side of the flattish channel means a stronger possibility of a bullish move towards the 11,000 mark.
QNBFS Daily Technical Trader Qatar - November 28 2019 التحليل الفني اليومي لب...QNB Group
The Index reached the upper side of the flattish, and now testing the moving averages after it broke below the short- term uptrend channel. That being said, a breakout above that side of the flattish channel means a stronger possibility of a bullish move towards the 11,000 mark.
Financial Assets: Debit vs Equity Securities.pptxWrito-Finance
financial assets represent claim for future benefit or cash. Financial assets are formed by establishing contracts between participants. These financial assets are used for collection of huge amounts of money for business purposes.
Two major Types: Debt Securities and Equity Securities.
Debt Securities are Also known as fixed-income securities or instruments. The type of assets is formed by establishing contracts between investor and issuer of the asset.
• The first type of Debit securities is BONDS. Bonds are issued by corporations and government (both local and national government).
• The second important type of Debit security is NOTES. Apart from similarities associated with notes and bonds, notes have shorter term maturity.
• The 3rd important type of Debit security is TRESURY BILLS. These securities have short-term ranging from three months, six months, and one year. Issuer of such securities are governments.
• Above discussed debit securities are mostly issued by governments and corporations. CERTIFICATE OF DEPOSITS CDs are issued by Banks and Financial Institutions. Risk factor associated with CDs gets reduced when issued by reputable institutions or Banks.
Following are the risk attached with debt securities: Credit risk, interest rate risk and currency risk
There are no fixed maturity dates in such securities, and asset’s value is determined by company’s performance. There are two major types of equity securities: common stock and preferred stock.
Common Stock: These are simple equity securities and bear no complexities which the preferred stock bears. Holders of such securities or instrument have the voting rights when it comes to select the company’s board of director or the business decisions to be made.
Preferred Stock: Preferred stocks are sometime referred to as hybrid securities, because it contains elements of both debit security and equity security. Preferred stock confers ownership rights to security holder that is why it is equity instrument
<a href="https://www.writofinance.com/equity-securities-features-types-risk/" >Equity securities </a> as a whole is used for capital funding for companies. Companies have multiple expenses to cover. Potential growth of company is required in competitive market. So, these securities are used for capital generation, and then uses it for company’s growth.
Concluding remarks
Both are employed in business. Businesses are often established through debit securities, then what is the need for equity securities. Companies have to cover multiple expenses and expansion of business. They can also use equity instruments for repayment of debits. So, there are multiple uses for securities. As an investor, you need tools for analysis. Investment decisions are made by carefully analyzing the market. For better analysis of the stock market, investors often employ financial analysis of companies.
Turin Startup Ecosystem 2024 - Ricerca sulle Startup e il Sistema dell'Innov...Quotidiano Piemontese
Turin Startup Ecosystem 2024
Una ricerca de il Club degli Investitori, in collaborazione con ToTeM Torino Tech Map e con il supporto della ESCP Business School e di Growth Capital
when will pi network coin be available on crypto exchange.DOT TECH
There is no set date for when Pi coins will enter the market.
However, the developers are working hard to get them released as soon as possible.
Once they are available, users will be able to exchange other cryptocurrencies for Pi coins on designated exchanges.
But for now the only way to sell your pi coins is through verified pi vendor.
Here is the telegram contact of my personal pi vendor
@Pi_vendor_247
The Evolution of Non-Banking Financial Companies (NBFCs) in India: Challenges...beulahfernandes8
Role in Financial System
NBFCs are critical in bridging the financial inclusion gap.
They provide specialized financial services that cater to segments often neglected by traditional banks.
Economic Impact
NBFCs contribute significantly to India's GDP.
They support sectors like micro, small, and medium enterprises (MSMEs), housing finance, and personal loans.
The European Unemployment Puzzle: implications from population agingGRAPE
We study the link between the evolving age structure of the working population and unemployment. We build a large new Keynesian OLG model with a realistic age structure, labor market frictions, sticky prices, and aggregate shocks. Once calibrated to the European economy, we quantify the extent to which demographic changes over the last three decades have contributed to the decline of the unemployment rate. Our findings yield important implications for the future evolution of unemployment given the anticipated further aging of the working population in Europe. We also quantify the implications for optimal monetary policy: lowering inflation volatility becomes less costly in terms of GDP and unemployment volatility, which hints that optimal monetary policy may be more hawkish in an aging society. Finally, our results also propose a partial reversal of the European-US unemployment puzzle due to the fact that the share of young workers is expected to remain robust in the US.
what is the future of Pi Network currency.DOT TECH
The future of the Pi cryptocurrency is uncertain, and its success will depend on several factors. Pi is a relatively new cryptocurrency that aims to be user-friendly and accessible to a wide audience. Here are a few key considerations for its future:
Message: @Pi_vendor_247 on telegram if u want to sell PI COINS.
1. Mainnet Launch: As of my last knowledge update in January 2022, Pi was still in the testnet phase. Its success will depend on a successful transition to a mainnet, where actual transactions can take place.
2. User Adoption: Pi's success will be closely tied to user adoption. The more users who join the network and actively participate, the stronger the ecosystem can become.
3. Utility and Use Cases: For a cryptocurrency to thrive, it must offer utility and practical use cases. The Pi team has talked about various applications, including peer-to-peer transactions, smart contracts, and more. The development and implementation of these features will be essential.
4. Regulatory Environment: The regulatory environment for cryptocurrencies is evolving globally. How Pi navigates and complies with regulations in various jurisdictions will significantly impact its future.
5. Technology Development: The Pi network must continue to develop and improve its technology, security, and scalability to compete with established cryptocurrencies.
6. Community Engagement: The Pi community plays a critical role in its future. Engaged users can help build trust and grow the network.
7. Monetization and Sustainability: The Pi team's monetization strategy, such as fees, partnerships, or other revenue sources, will affect its long-term sustainability.
It's essential to approach Pi or any new cryptocurrency with caution and conduct due diligence. Cryptocurrency investments involve risks, and potential rewards can be uncertain. The success and future of Pi will depend on the collective efforts of its team, community, and the broader cryptocurrency market dynamics. It's advisable to stay updated on Pi's development and follow any updates from the official Pi Network website or announcements from the team.
How to get verified on Coinbase Account?_.docxBuy bitget
t's important to note that buying verified Coinbase accounts is not recommended and may violate Coinbase's terms of service. Instead of searching to "buy verified Coinbase accounts," follow the proper steps to verify your own account to ensure compliance and security.
how to sell pi coins effectively (from 50 - 100k pi)DOT TECH
Anywhere in the world, including Africa, America, and Europe, you can sell Pi Network Coins online and receive cash through online payment options.
Pi has not yet been launched on any exchange because we are currently using the confined Mainnet. The planned launch date for Pi is June 28, 2026.
Reselling to investors who want to hold until the mainnet launch in 2026 is currently the sole way to sell.
Consequently, right now. All you need to do is select the right pi network provider.
Who is a pi merchant?
An individual who buys coins from miners on the pi network and resells them to investors hoping to hang onto them until the mainnet is launched is known as a pi merchant.
debuts.
I'll provide you the Telegram username
@Pi_vendor_247
Exploring Abhay Bhutada’s Views After Poonawalla Fincorp’s Collaboration With...beulahfernandes8
The financial landscape in India has witnessed a significant development with the recent collaboration between Poonawalla Fincorp and IndusInd Bank.
The launch of the co-branded credit card, the IndusInd Bank Poonawalla Fincorp eLITE RuPay Platinum Credit Card, marks a major milestone for both entities.
This strategic move aims to redefine and elevate the banking experience for customers.
how to sell pi coins on Bitmart crypto exchangeDOT TECH
Yes. Pi network coins can be exchanged but not on bitmart exchange. Because pi network is still in the enclosed mainnet. The only way pioneers are able to trade pi coins is by reselling the pi coins to pi verified merchants.
A verified merchant is someone who buys pi network coins and resell it to exchanges looking forward to hold till mainnet launch.
I will leave the telegram contact of my personal pi merchant to trade with.
@Pi_vendor_247
BYD SWOT Analysis and In-Depth Insights 2024.pptxmikemetalprod
Indepth analysis of the BYD 2024
BYD (Build Your Dreams) is a Chinese automaker and battery manufacturer that has snowballed over the past two decades to become a significant player in electric vehicles and global clean energy technology.
This SWOT analysis examines BYD's strengths, weaknesses, opportunities, and threats as it competes in the fast-changing automotive and energy storage industries.
Founded in 1995 and headquartered in Shenzhen, BYD started as a battery company before expanding into automobiles in the early 2000s.
Initially manufacturing gasoline-powered vehicles, BYD focused on plug-in hybrid and fully electric vehicles, leveraging its expertise in battery technology.
Today, BYD is the world’s largest electric vehicle manufacturer, delivering over 1.2 million electric cars globally. The company also produces electric buses, trucks, forklifts, and rail transit.
On the energy side, BYD is a major supplier of rechargeable batteries for cell phones, laptops, electric vehicles, and energy storage systems.
what is the best method to sell pi coins in 2024DOT TECH
The best way to sell your pi coins safely is trading with an exchange..but since pi is not launched in any exchange, and second option is through a VERIFIED pi merchant.
Who is a pi merchant?
A pi merchant is someone who buys pi coins from miners and pioneers and resell them to Investors looking forward to hold massive amounts before mainnet launch in 2026.
I will leave the telegram contact of my personal pi merchant to trade pi coins with.
@Pi_vendor_247
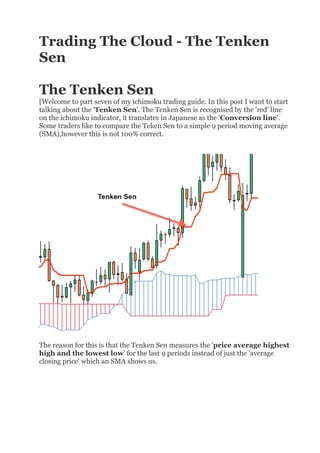
1. Trading The Cloud - The Tenken
Sen
The Tenken Sen
[Welcome to part seven of my ichimoku trading guide. In this post I want to start
talking about the 'Tenken Sen'. The Tenken Sen is recognised by the 'red' line
on the ichimoku indicator, it translates in Japanese as the 'Conversion line'.
Some traders like to compare the Teken Sen to a simple 9 period moving average
(SMA),however this is not 100% correct.
The reason for this is that the Tenken Sen measures the 'price average highest
high and the lowest low' for the last 9 periods instead of just the 'average
closing price' which an SMA shows us.
2. You will notice that the SMA is much more smoothed and has less straight edges,
the Tenkou Sen however has jagged edges and straight flattened portions, this
not only better represents price equilibrium but provides a more accurate
gauge of support then the SMA line.
By using the averages of price extremes (high and lows) over the 9 periods, the
Tenken Sen gives us a better measure of equilibrium rather then merely using an
average of the closing price (SMA).
3.
So what does it mean when the Tenken Sen is flat?
When you see the Tenken Sen flatten out, it generally means there has been a
trendless situation over the last 9 periods (9 candles)
The Tenken Sen can also provide a much more accurate level of price support
then the 9 period SMA Take a look at this
As you can see, the Tenken price broke through the 9 period SMA, but didn't
manage to break past the Tenken Sen. This is to do with the more conservative
way the Tenken Sen is calculated which makes it less reactive to small
movements in the price.
Finding momentum.
The angle of the Tenkan Sen can give us some idea on how price has built up
momentum over the past 9 periods (past 9 candles).
If the Tenken Sen had a steep angle it means price has been moving with some
good strong momentum, whereas a flat or relatively straight Tenken Sen
indicates low or no movement at all over the same time period.
4.
Just like the Kijun Sen, the Tenken Sen measures the short term trend, out of the
two, the Tenken Sen is the fastest because it measures trend over the past 9
periods as opposed to the Kijun sen which measures trend over 26 periods.
Given the short term nature of the Tenken Sen it can't be used as a reliable
indicator of trend on its own, although price breaking the Tenken Sen can give an
early indication of a trend change, we should always make sure it is
confirmed by the other ichimoku components before we make our
trading decision.
However one of the main uses for the Tenken Sen is when used in relation with
the Kijun Sen.
5.
If the Tenken Sen is above the Kijun Sen, then we have a bullish trend
If the Tenken Sen is below the Kijun Sen, then we have a Bearish trend.
But the real power happens when the Kijun Sen and Tenken Sen crossover,
this is actually a trading signal on its own and one of the most powerful trading
6. signals in ichimoku, I will cover this in future posts when I start talking and
teaching you about the various trading strategies in ichimoku.
Thats the basics of the Tenken Sen covered, in my next lesson I will be covering
my favourite part of the ichimoku indicator, the Kijun Sen.
See you next time
Chris (admin)