Downloaded 269 times
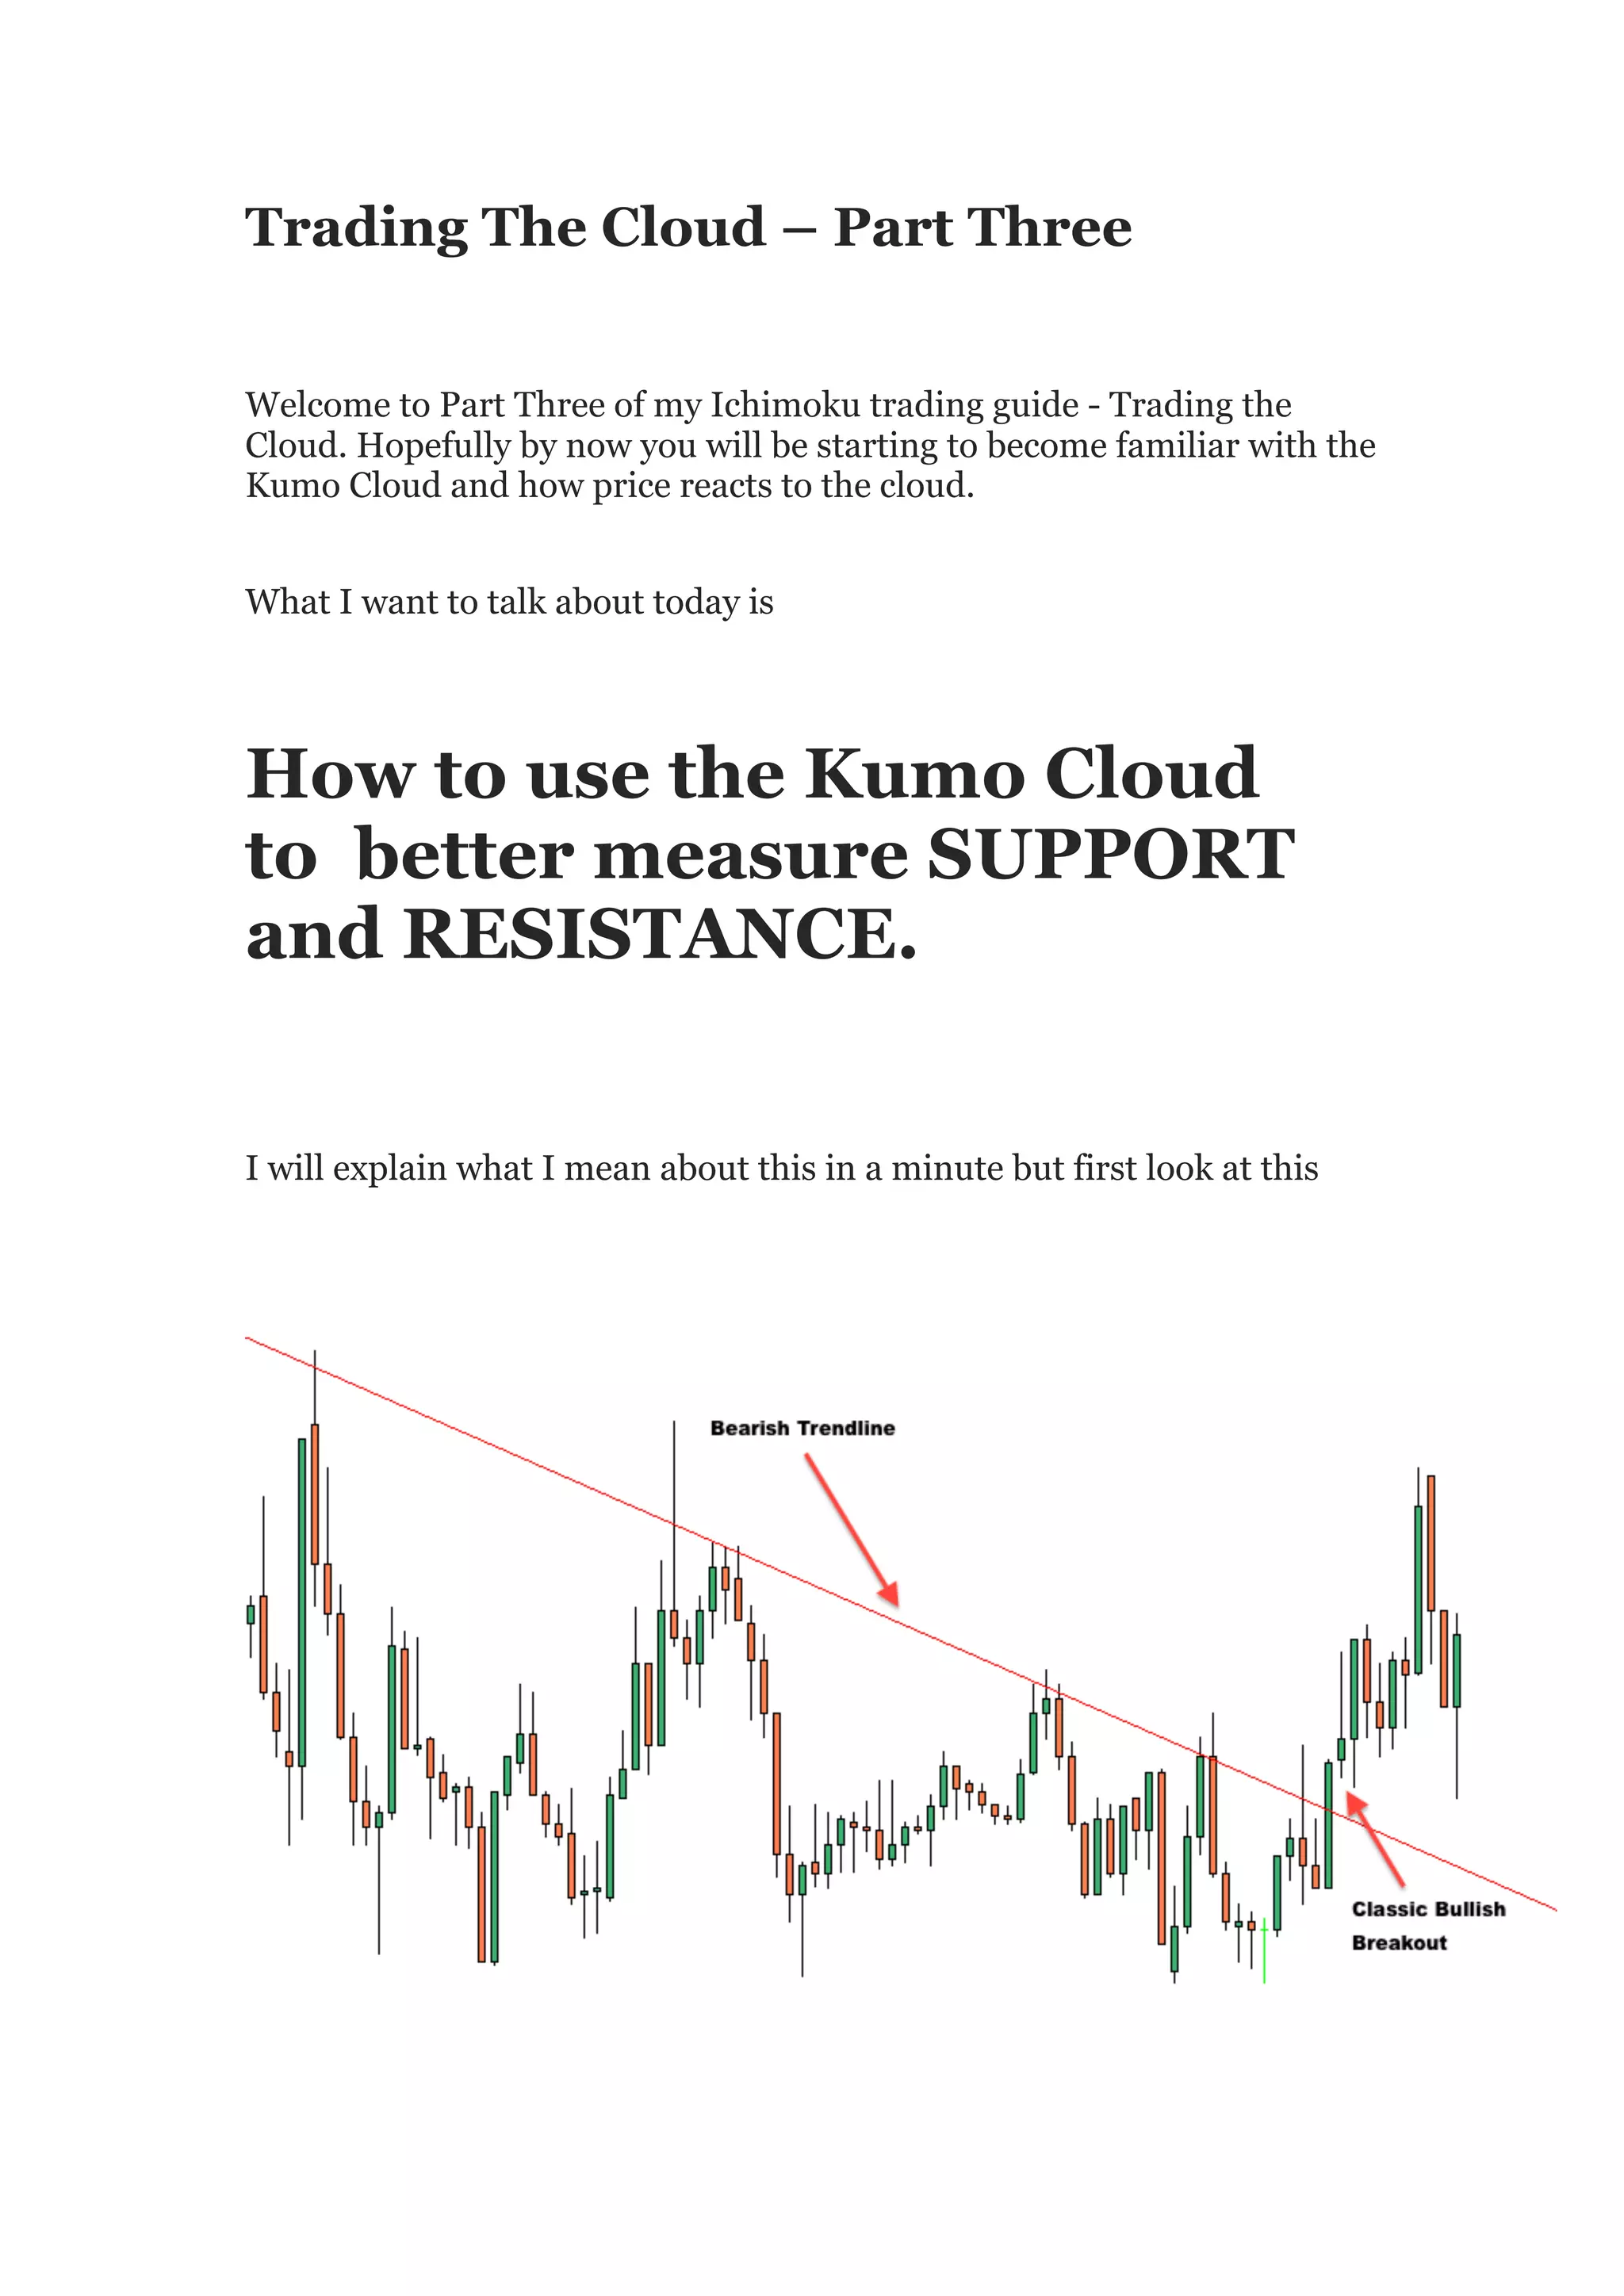

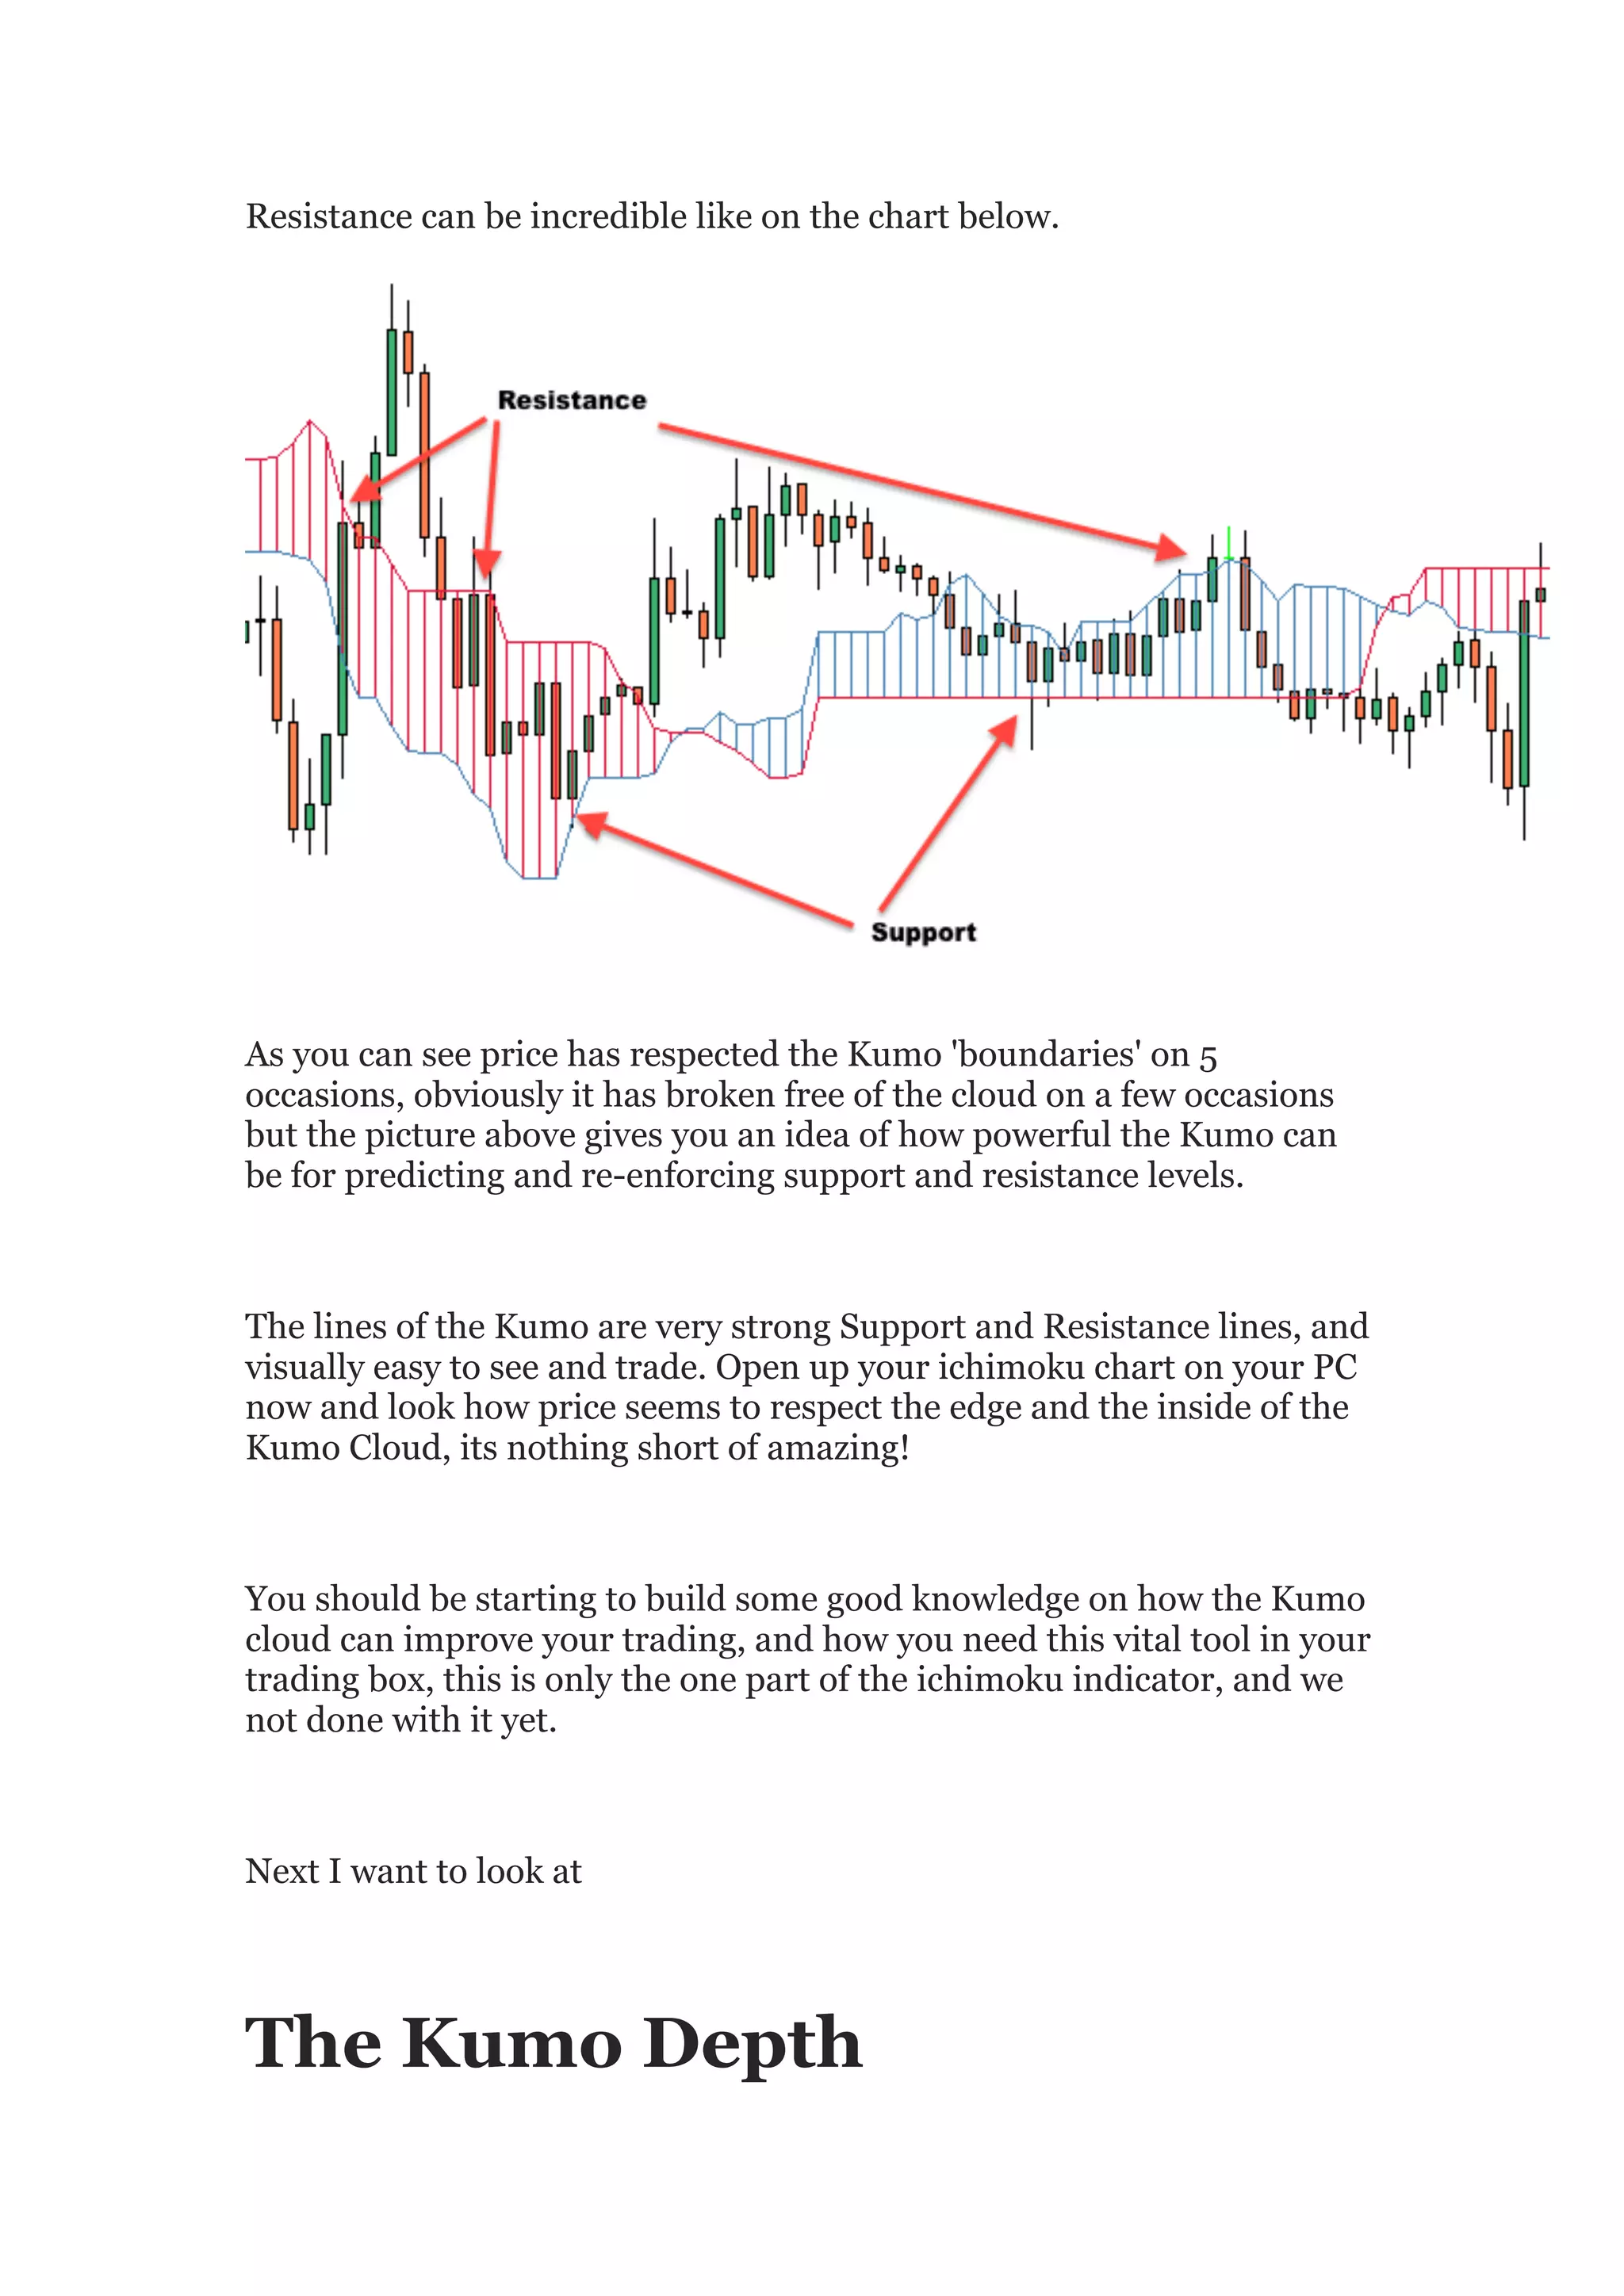
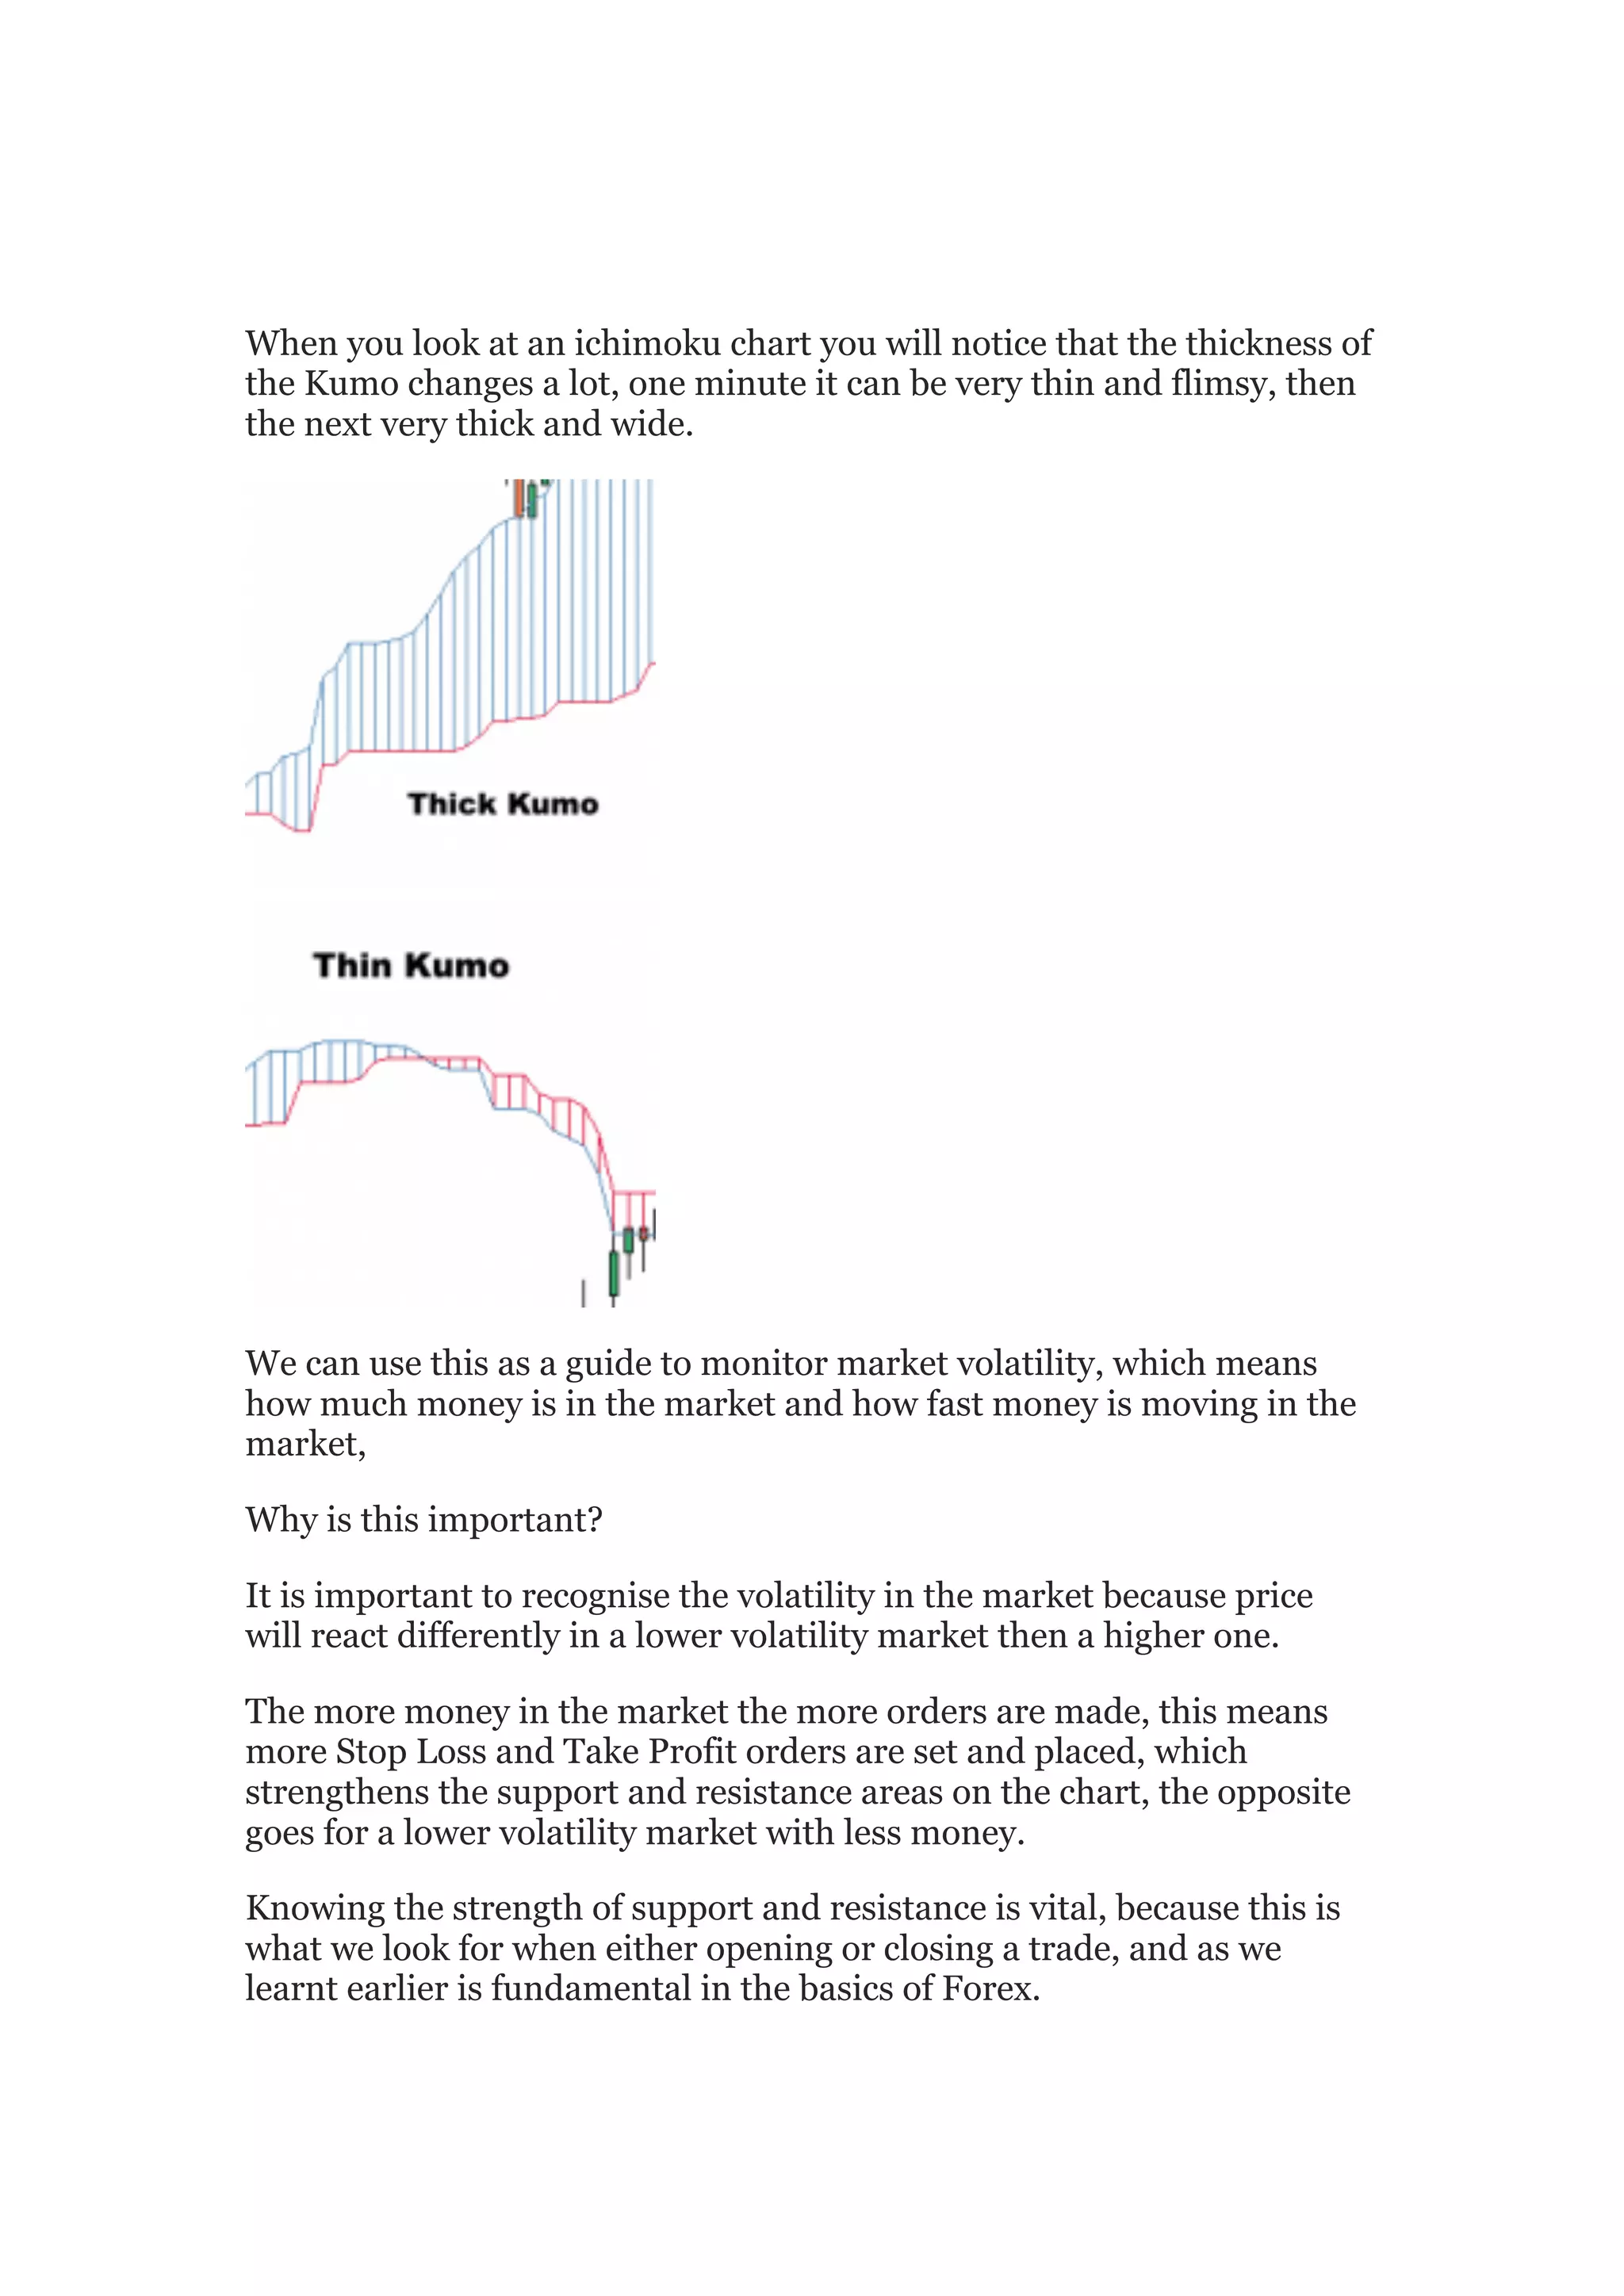
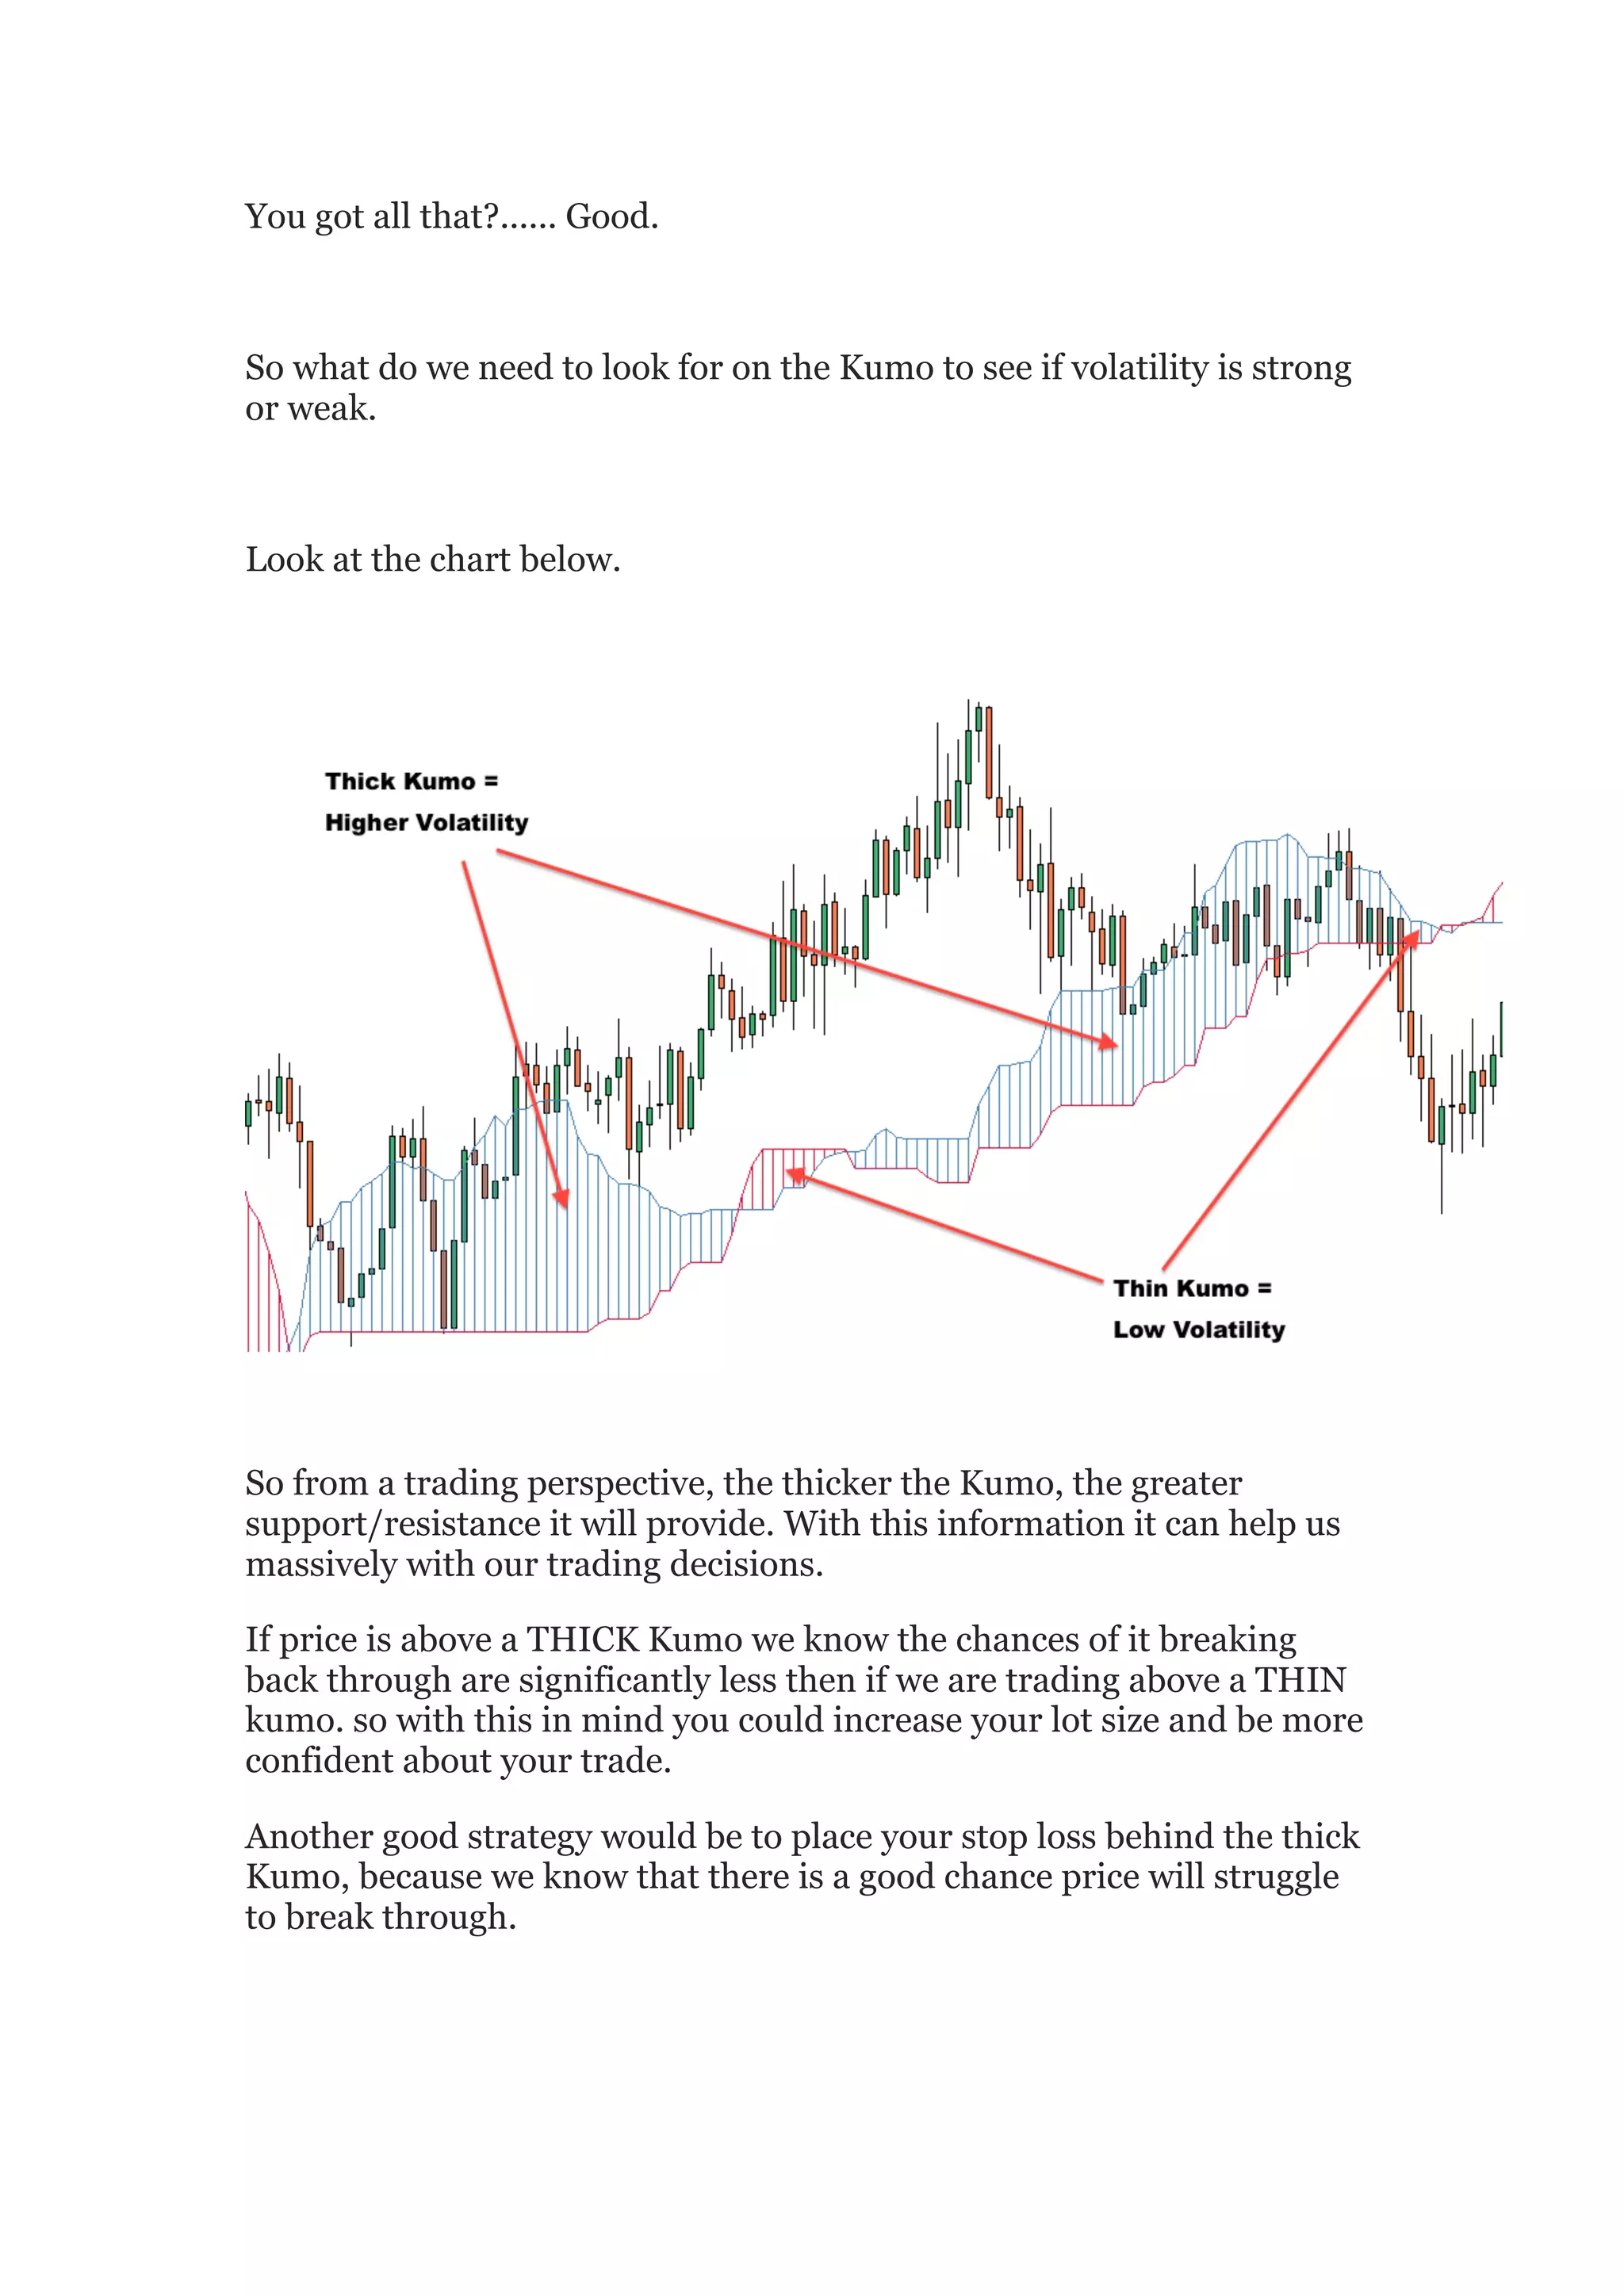
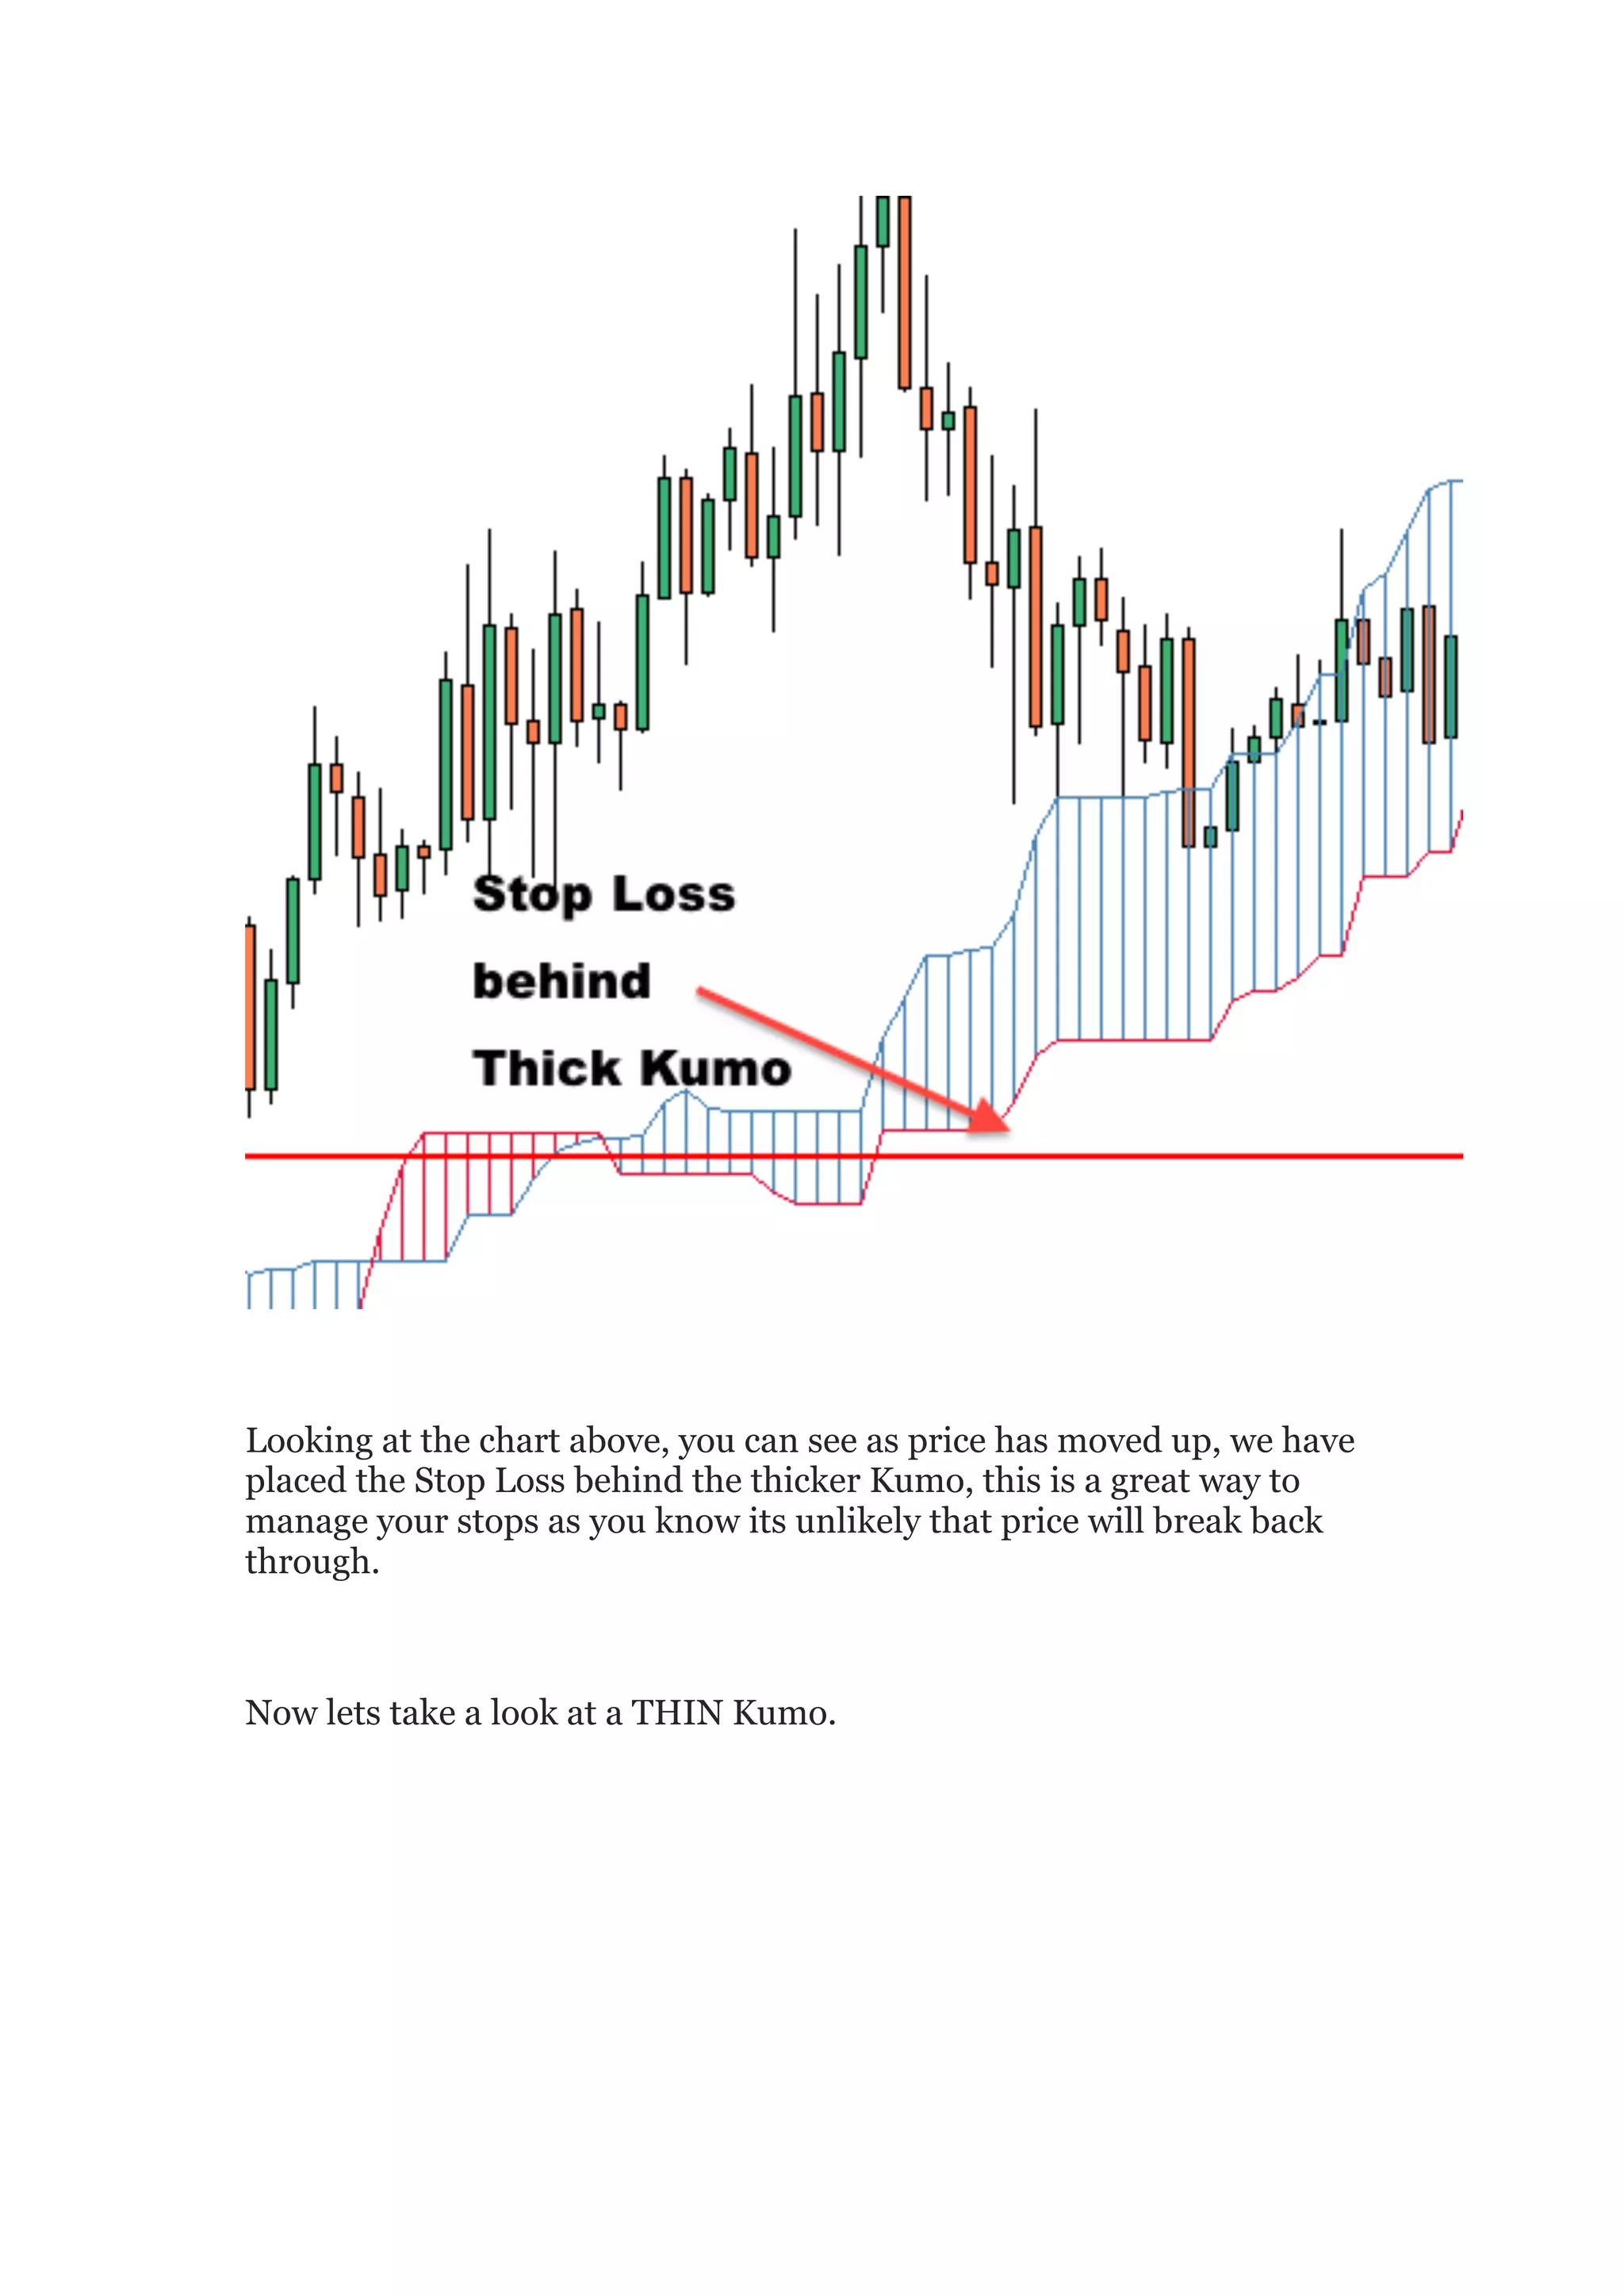
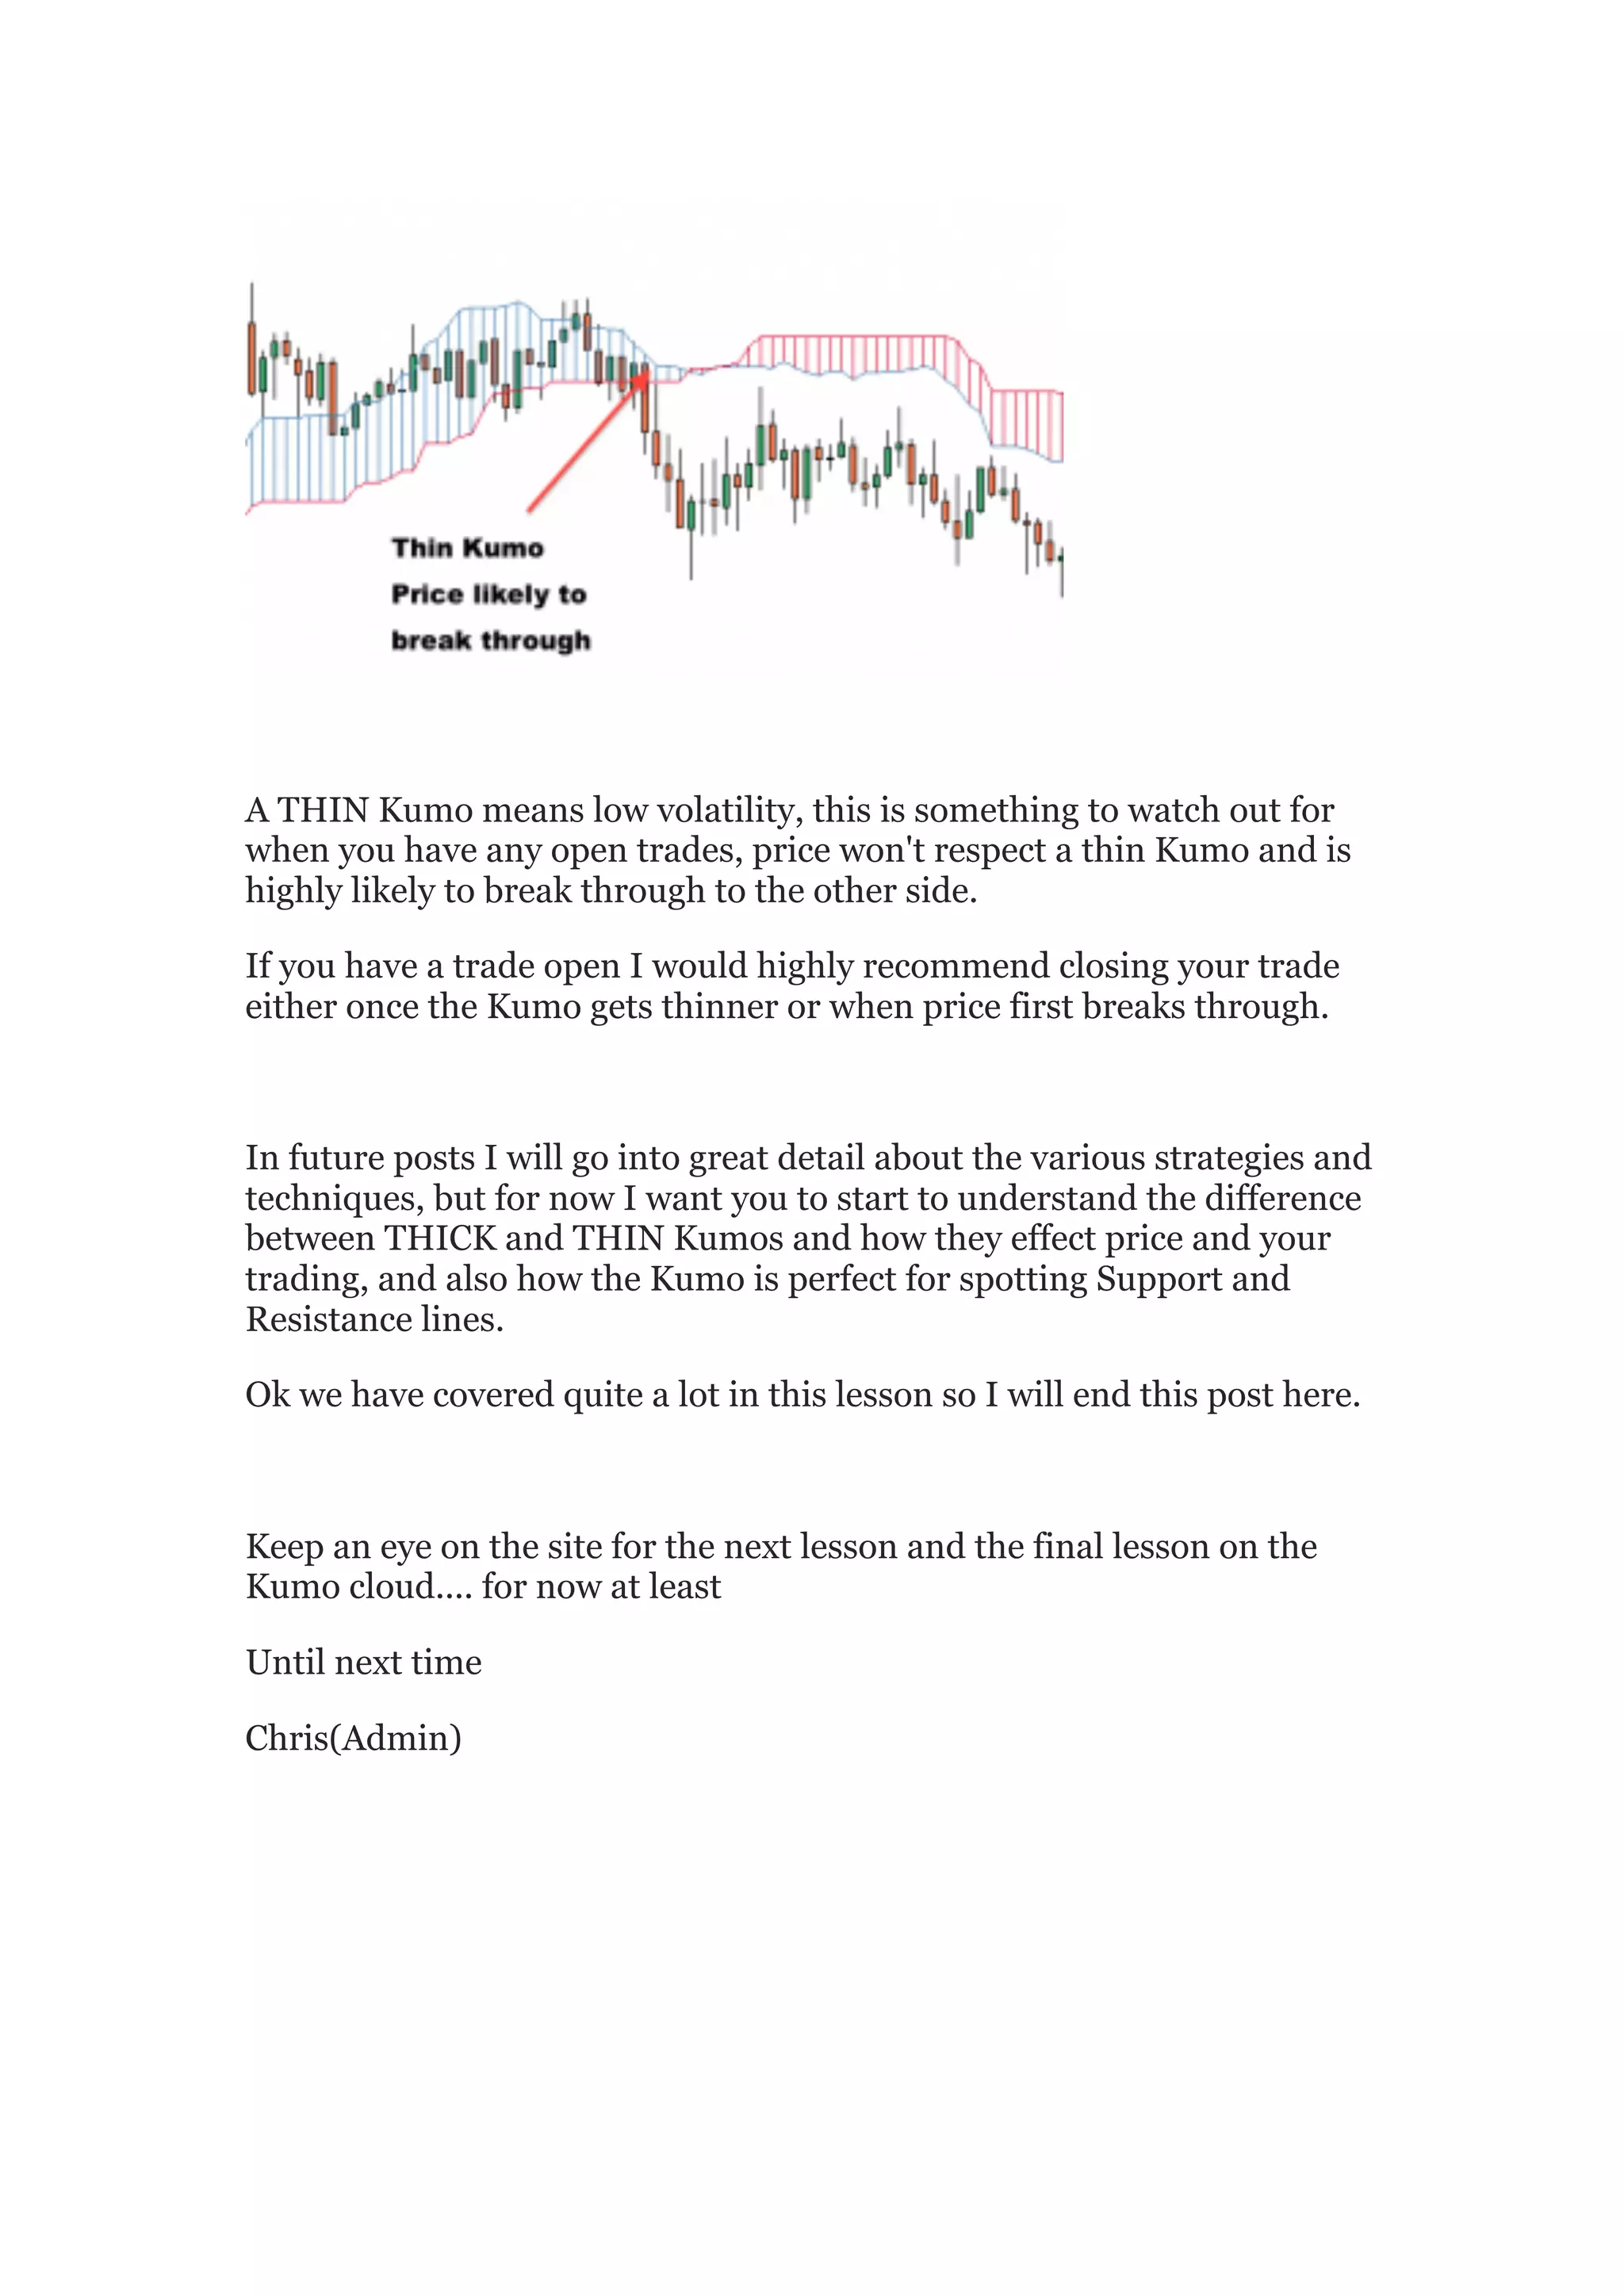

This document discusses the use of the kumo cloud in forex trading, emphasizing its role in measuring support and resistance effectively compared to traditional trend lines. It explains how the thickness of the kumo can indicate market volatility, aiding traders in making informed decisions about trade entries and stop-loss placements. The author encourages readers to understand these concepts to enhance their trading strategies and invites them to follow future lessons on the subject.


