
Download to read offline
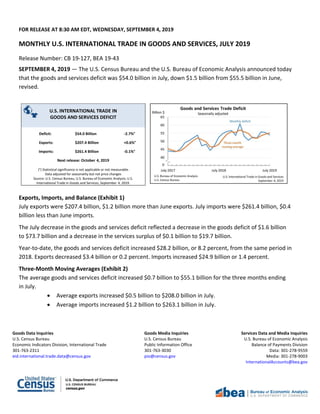


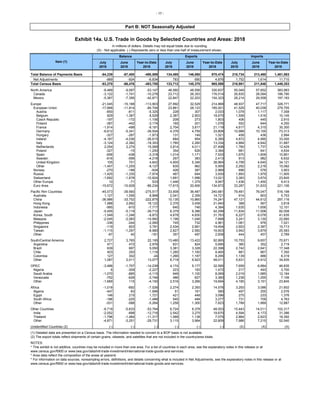


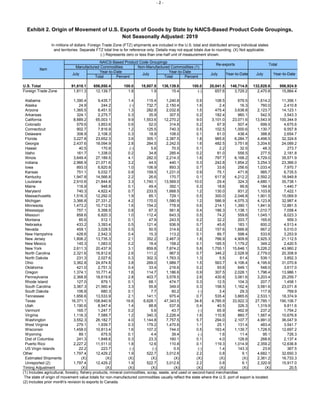


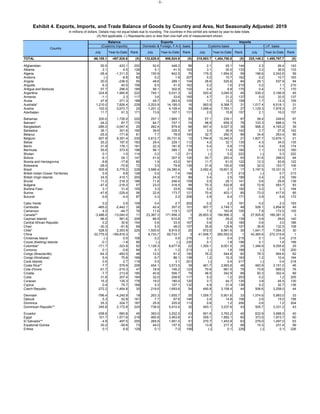


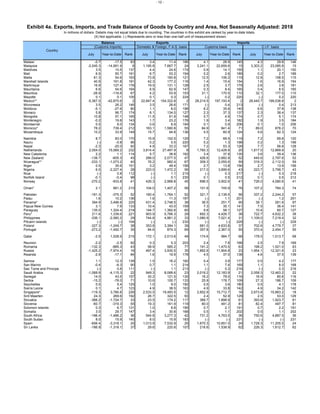
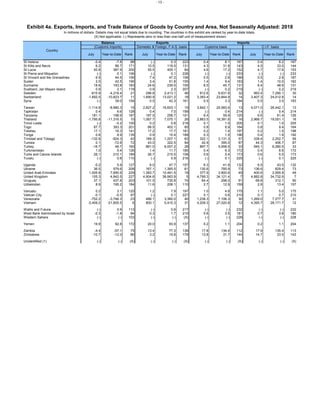

- The US goods and services trade deficit decreased slightly in July to $54.0 billion from a revised $55.5 billion in June. Exports increased $1.2 billion while imports decreased $0.4 billion. - Exports of goods increased $1.2 billion in July driven by increases in consumer goods like pharmaceuticals and capital goods. Imports of goods decreased $0.4 billion led by a fall in computer imports. - The trade deficit with China decreased in July as US exports to China fell less than imports from China. The surplus with South and Central America also decreased as US exports to the region fell more than imports.


