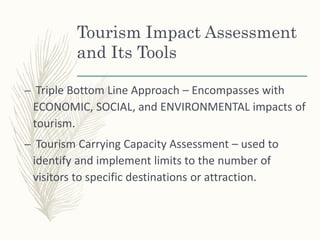
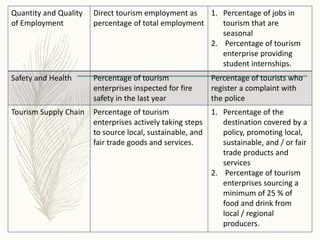
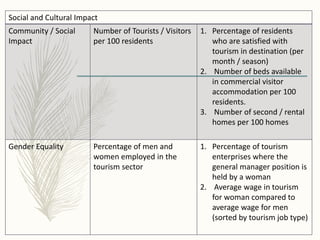
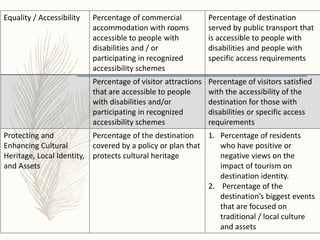
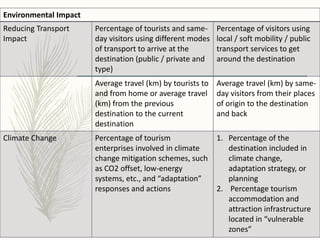
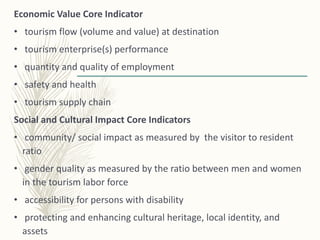
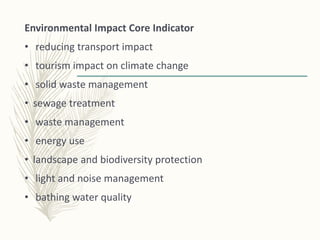
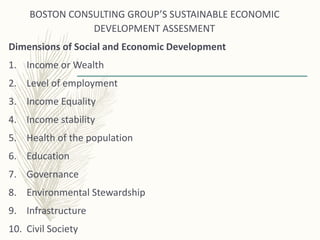
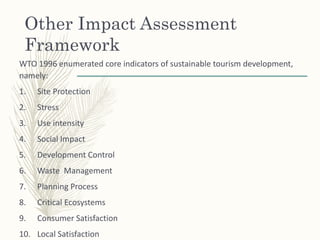
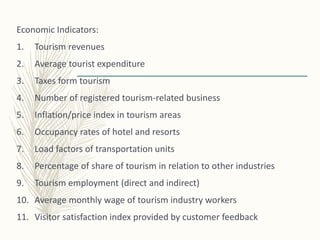
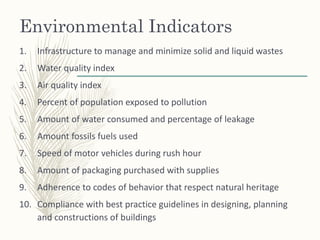
TOURISM
IMPACT
ASSESSMENT
Tourism Impact Assessment
and its Importance
– It forces planners and developers to foresee what
could possibly go wrong and take precautions to
prevent such unfortunate consequences from
happening.
– It compels the parties involved in tourism
development to participate in a consultative
process to iron out kinks prior to the actual
implementation of a project.
– Planners and developers would be able to identify
actions could prevent or mitigate the impacts.
What to consider in Tourism
Impact Assessment?
– Constitution and Existing Laws
– Land Use Plans and Spatial Planning
– Zoning Laws, Zones of tourism value
– Regulations on Tourism Investments, Tourism
Enterprise Zones, and Tourism Enterprises.
– Building Code ( various permits, standards for various
types of structures)
– Business Registration Requirements
– Requirements for public consultation
– Foreign Equity Laws
– Protected Area Laws
– Indigenous People’s Rights, Including their rights to ancestral
domains
– Gender and Development Provision
– Minimum Wage Laws
– Labor Laws
– Environmental Laws
– Tourism Policy Act
– Critical Habitat Areas
– Buffer Zones
Tourism Impact Assessment
and Its Tools
– Triple Bottom Line Approach – Encompasses with
ECONOMIC, SOCIAL, and ENVIRONMENTAL impacts of
tourism.
– Tourism Carrying Capacity Assessment – used to
identify and implement limits to the number of
visitors to specific destinations or attraction.
Types of Carrying Capacity
Assessment According to Lundberg
1. Physical CC- determines the level of physical impacts that are
acceptable at a destination.
2. Perceptual CC – look at the situation from the tourists’ point of
view, related to how they perceived the quality of the destination.
3. Social or Sociocultural CC – focuses on the social and cultural
changes due to tourism increase.
4. Economic CC – the destination’s possibility to cater the demand
without crowding out other local economic activities.
5. Political or Administrative CC – concerned with how the local,
political, and administrative bodies can cope with tourism and to
what extent it is needed to put limits on tourism inflow.
– European Tourism Indicator System - a tool for monitoring, managing, and
enhancing tourism destination sustainability.
Section A. Destination Management
Criteria Core Indicator Optional Indicator
1. Sustainable
Tourism Public
Policy
Percentage of the destination
with a sustainable tourism
strategy / action plan, with
agreed monitoring,
development control, and
evaluation arrangement.
1. Percentage of Residents
satisfied with their
involvement and their
influence in the planning
and development of
tourism.
2. Percentage of the
destination represented by
a destination management
organization.
2. Sustainable
Tourism
Management in
Tourism
Enterprises
Percentage of tourism
enterprises / establishments
in the destination using a
voluntary verified
certification / labeling for
environmental / quality /
sustainability and / or CSR
measures.
Number of Tourism enterprises
/ establishments with
sustainability reports in
accordance with the Global
Reporting Initiative (GRI)
3. Customer
Satisfaction
Percentage of Visitors that
are satisfied with their
overall experience in the
destination
Percentage of repeat / return
visitors (within 5 years)
4. Information
and
Communication
Percentage of visitors who
note that they are aware of
destination sustainability
efforts
Percentage of businesses that
communicate their
sustainability efforts to visitors
in their products, marketing, or
branding.
Section B. Economic Value
Tourism Flow
(volume and value)
at destination
Number of tourist nights per
months
1. Relative contribution of
tourism to the destination’s
economy (% GDP)
2. Number of “same day”
visitors in high season and
low season
3. Daily spending per same-
day visitor
Tourism Enterprise(s)
Performance
Average length of stay of
tourists (nights)
1. Average length of stay of
same-day visitors (hours)
2. Percentage of ten largest
tourism enterprises involved
in destination management
/ cooperative marketing
Occupancy rate in commercial
accommodation per month
and average for the year.
Average price per room in the
destination.
Quantity and Quality
of Employment
Direct tourism employment as
percentage of total employment
1. Percentage of jobs in
tourism that are
seasonal
2. Percentage of tourism
enterprise providing
student internships.
Safety and Health Percentage of tourism
enterprises inspected for fire
safety in the last year
Percentage of tourists who
register a complaint with
the police
Tourism Supply Chain Percentage of tourism
enterprises actively taking steps
to source local, sustainable, and
fair trade goods and services.
1. Percentage of the
destination covered by a
policy, promoting local,
sustainable, and / or fair
trade products and
services
2. Percentage of tourism
enterprises sourcing a
minimum of 25 % of
food and drink from
local / regional
producers.
Social and Cultural Impact
Community / Social
Impact
Number of Tourists / Visitors
per 100 residents
1. Percentage of residents
who are satisfied with
tourism in destination (per
month / season)
2. Number of beds available
in commercial visitor
accommodation per 100
residents.
3. Number of second / rental
homes per 100 homes
Gender Equality Percentage of men and
women employed in the
tourism sector
1. Percentage of tourism
enterprises where the
general manager position is
held by a woman
2. Average wage in tourism
for woman compared to
average wage for men
(sorted by tourism job type)
Equality / Accessibility Percentage of commercial
accommodation with rooms
accessible to people with
disabilities and / or
participating in recognized
accessibility schemes
Percentage of destination
served by public transport that
is accessible to people with
disabilities and people with
specific access requirements
Percentage of visitor attractions
that are accessible to people
with disabilities and/or
participating in recognized
accessibility schemes
Percentage of visitors satisfied
with the accessibility of the
destination for those with
disabilities or specific access
requirements
Protecting and
Enhancing Cultural
Heritage, Local Identity,
and Assets
Percentage of the destination
covered by a policy or plan that
protects cultural heritage
1. Percentage of residents
who have positive or
negative views on the
impact of tourism on
destination identity.
2. Percentage of the
destination’s biggest events
that are focused on
traditional / local culture
and assets
Environmental Impact
Reducing Transport
Impact
Percentage of tourists and same-
day visitors using different modes
of transport to arrive at the
destination (public / private and
type)
Percentage of visitors using
local / soft mobility / public
transport services to get
around the destination
Average travel (km) by tourists to
and from home or average travel
(km) from the previous
destination to the current
destination
Average travel (km) by same-
day visitors from their places
of origin to the destination
and back
Climate Change Percentage of tourism
enterprises involved in climate
change mitigation schemes, such
as CO2 offset, low-energy
systems, etc., and “adaptation”
responses and actions
1. Percentage of the
destination included in
climate change,
adaptation strategy, or
planning
2. Percentage tourism
accommodation and
attraction infrastructure
located in “vulnerable
zones”
Solid Waste
Management
Waste volume produced by
destination (tons per resident
per year or per month)
Percentage of tourism
enterprises separating
different types of waste
Volume of waste recycled
(percent or per resident per
year)
Sewage Treatment Percentage of sewage from the
destination treated to at least
secondary level prior to
discharge
Percentage of commercial
accommodation connected
to central sewage and / or
employing tertiary sewage
treatment
Water Management Fresh water consumption per
tourist night compared to
general population water
consumption per person night
1. Percentage of tourism
enterprises with low-
flow showerheads and
taps and/ or dual flush
toilets/ waterless urinals
2. Percentage of tourism
enterprises using
recycled water
3. Percentage of water use
derived from recycled
water in the destination
Energy Usage Energy consumption per
tourist night compared to
general population energy
consumption per person
night
1. Percentage of tourism
enterprises that have
switched to low-energy
lighting
2. Annual amount of
energy consumed from
renewable sources
(Mwah) as a percentage
of overall energy
consumption
Landscape and
Biodiversity
Protection
Percentage of destination
(area in km squared) that is
designated for protection
1. Percentage of local
enterprises in the tourism
sector actively supporting
protection, conservation,
and management of local
biodiversity and landscape
2. Percentage of
destination covered by a
biodiversity
management and
monitoring plan
Light and Noise
Management
The destination has
policies in places that
require tourism
enterprises to minimize
light and noise pollution
Percentage of the
destination and
percentage of population
covered by local strategy
and / or plans to reduce
noise and light pollution
Bathing Water
Quality
Level of contamination
per 100 ml (fecal
coliforms,
campylobacter)
Number of days beach /
shore closed due to
contamination
Core Indicators
Destination Management Core Indicators
• sustainable tourism public policy
• sustainable tourism management in tourism
enterprises
• customer satisfaction
• information and communication
Economic Value Core Indicator
• tourism flow (volume and value) at destination
• tourism enterprise(s) performance
• quantity and quality of employment
• safety and health
• tourism supply chain
Social and Cultural Impact Core Indicators
• community/ social impact as measured by the visitor to resident
ratio
• gender quality as measured by the ratio between men and women
in the tourism labor force
• accessibility for persons with disability
• protecting and enhancing cultural heritage, local identity, and
assets
Environmental Impact Core Indicator
• reducing transport impact
• tourism impact on climate change
• solid waste management
• sewage treatment
• waste management
• energy use
• landscape and biodiversity protection
• light and noise management
• bathing water quality
BOSTON CONSULTING GROUP’S SUSTAINABLE ECONOMIC
DEVELOPMENT ASSESMENT
Dimensions of Social and Economic Development
1. Income or Wealth
2. Level of employment
3. Income Equality
4. Income stability
5. Health of the population
6. Education
7. Governance
8. Environmental Stewardship
9. Infrastructure
10. Civil Society
The SEDA scores for the ASEAN member countries (with
available data)
Country Wealth to well-
being coefficient
Growth to well-
being coefficient
Cambodia 1.17 1.32
Indonesia 1.37 1.24
Laos 1.27 1.14
Malaysia 1.05 0.87
Philippines 1.35 1.08
Singapore 1.03 1.24
Thailand 1.17 0.89
Vietnam 1.56 1.08
Average 1.25 1.11
Sustainable Livelihood Approach
Sustainable livelihoods (SL) approach analyzes the impact
of tourism development on a community in terms of its
contribution to buildings capabilities, assets (natural, economic,
or financial, human, and social capital),and activities required for
a means of living (Lundberg 2011).
It also analyzes tourism’s impact on creating sustainable
livelihood, that is, the ability of a livelihood to cope with and
recover from stresses and shocks , maintain or enhance its
capabilities and assets, while preserving the natural resource
base.
SL approach measures
outcomes in terms of the ff.
Indicators:
– Increase in income;
– Increase well-being;
– Reduced vulnerability;
– Improved food security; and
– More sustainable use of natural resource
base
Philippine Environmental
Impact Assessment System
Environmental Impact Assessment (EIA)
Is a process that involves predicting and evaluating the likely
impacts of a projects (including cumulative impacts) on the
environment during construction, commissioning, operation, and
abandonment.
It also includes designing appropriate preventive, mitigating, and
enhancement measures addressing these consequences to protect
the environment and the community’s welfare.
EIA is mandated by law under the Presidential Decree No. 1586,
which established “ an environmental impact statement system
including other environmental management related measures and
for other purposes”.
–Initial Environmental Examination (IEE) is
required for projects of the ff. nature: building,
batching and crushing plant, cemetery, funeral
parlors, crematorium, fishery aquaculture,
food and food by-products, irrigation and flood
control, non-food manufacturing plant, water
supply, and resort and other tourism or leisure.
Possible Environmental and social
impacts of projects, included potential
impacts for projects are:
1. Consistency with the use (residential, commercial/institutional,
industrial, agricultural/recreational, protected areas, etc.);
2. Disturbance to wild life due to vegetation caring (forestland, marshland,
grassland, mangrove, wetland etc.);
3. Change in surface landform/topography/terrain/slope (slope types: flat
which is 0-3%, gently sloping to rolling, 3-18%, and steep, a gradient of
greater than > 18%)
4. Soil erosion (hazard-prone or not);
5. Soil/land contamination due to improper solid waste disposal (soil
types: sandy, clay, sandy-loam)
6. Impairment of visual aesthetics (presence of visually significant land
forms, landscape, or structures);
7. Devaluation of land values;
8. Increased siltation due to project activities;
9. Water quality degradation;
10. Competition in water use;
11. Depletion of water resources;
12. Increased occurrence of flooding;
13. Air quality degradation;
14. Nuisance due to noise generation;
15. Displacement of residents in the project site and within its vicinity;
16. Displacement of indigenous people;
17. Enhanced employment and/or livelihood opportunities;
18. Reduced employment and/or livelihood opportunities;
19. Increased revenues for LGU;
20. Disruption/Competition in delivery of public services
(education, peace, and order etc.);
21. Enhance delivery of public services (education, peace, and
order etc.);
22. Increased in traffic volume and worsening of traffic flow;
23. Impacts on community health and safety.
Other Impact Assessment
Framework
WTO 1996 enumerated core indicators of sustainable tourism development,
namely:
1. Site Protection
2. Stress
3. Use intensity
4. Social Impact
5. Development Control
6. Waste Management
7. Planning Process
8. Critical Ecosystems
9. Consumer Satisfaction
10. Local Satisfaction
List of indicators that can
be used for assessing the
impact of tourism
development
Economic Indicators:
1. Tourism revenues
2. Average tourist expenditure
3. Taxes form tourism
4. Number of registered tourism-related business
5. Inflation/price index in tourism areas
6. Occupancy rates of hotel and resorts
7. Load factors of transportation units
8. Percentage of share of tourism in relation to other industries
9. Tourism employment (direct and indirect)
10. Average monthly wage of tourism industry workers
11. Visitor satisfaction index provided by customer feedback
Environmental Indicators
1. Infrastructure to manage and minimize solid and liquid wastes
2. Water quality index
3. Air quality index
4. Percent of population exposed to pollution
5. Amount of water consumed and percentage of leakage
6. Amount fossils fuels used
7. Speed of motor vehicles during rush hour
8. Amount of packaging purchased with supplies
9. Adherence to codes of behavior that respect natural heritage
10. Compliance with best practice guidelines in designing, planning
and constructions of buildings
11. Adaption of technologies that reduce consumption of natural
resources, reduce waste, and pollution, such as solar power
12. Use of local materials and local architecture that do not destroy
aesthetics values
13. Extent of used of soft transport, such as cycle routes and walking
trails
14. Used of sustainable trails, hides, and interpretation
15. Used of sustainable souvenirs; those not made from parts of
endangered animal and plant species
16. Used of biodegradable soaps and detergents
17. Park fees used to manage habitat and species
18. Percentage of profits invested in nature conservation
19. Average annual frequency and severity of natural disasters

Tourism Impact Assessment

  • 1.
  • 2.
    Tourism Impact Assessment andits Importance – It forces planners and developers to foresee what could possibly go wrong and take precautions to prevent such unfortunate consequences from happening. – It compels the parties involved in tourism development to participate in a consultative process to iron out kinks prior to the actual implementation of a project. – Planners and developers would be able to identify actions could prevent or mitigate the impacts.
  • 3.
    What to considerin Tourism Impact Assessment? – Constitution and Existing Laws – Land Use Plans and Spatial Planning – Zoning Laws, Zones of tourism value – Regulations on Tourism Investments, Tourism Enterprise Zones, and Tourism Enterprises. – Building Code ( various permits, standards for various types of structures) – Business Registration Requirements – Requirements for public consultation
  • 4.
    – Foreign EquityLaws – Protected Area Laws – Indigenous People’s Rights, Including their rights to ancestral domains – Gender and Development Provision – Minimum Wage Laws – Labor Laws – Environmental Laws – Tourism Policy Act – Critical Habitat Areas – Buffer Zones
  • 5.
    Tourism Impact Assessment andIts Tools – Triple Bottom Line Approach – Encompasses with ECONOMIC, SOCIAL, and ENVIRONMENTAL impacts of tourism. – Tourism Carrying Capacity Assessment – used to identify and implement limits to the number of visitors to specific destinations or attraction.
  • 7.
    Types of CarryingCapacity Assessment According to Lundberg 1. Physical CC- determines the level of physical impacts that are acceptable at a destination. 2. Perceptual CC – look at the situation from the tourists’ point of view, related to how they perceived the quality of the destination. 3. Social or Sociocultural CC – focuses on the social and cultural changes due to tourism increase. 4. Economic CC – the destination’s possibility to cater the demand without crowding out other local economic activities. 5. Political or Administrative CC – concerned with how the local, political, and administrative bodies can cope with tourism and to what extent it is needed to put limits on tourism inflow.
  • 12.
    – European TourismIndicator System - a tool for monitoring, managing, and enhancing tourism destination sustainability. Section A. Destination Management Criteria Core Indicator Optional Indicator 1. Sustainable Tourism Public Policy Percentage of the destination with a sustainable tourism strategy / action plan, with agreed monitoring, development control, and evaluation arrangement. 1. Percentage of Residents satisfied with their involvement and their influence in the planning and development of tourism. 2. Percentage of the destination represented by a destination management organization.
  • 13.
    2. Sustainable Tourism Management in Tourism Enterprises Percentageof tourism enterprises / establishments in the destination using a voluntary verified certification / labeling for environmental / quality / sustainability and / or CSR measures. Number of Tourism enterprises / establishments with sustainability reports in accordance with the Global Reporting Initiative (GRI) 3. Customer Satisfaction Percentage of Visitors that are satisfied with their overall experience in the destination Percentage of repeat / return visitors (within 5 years) 4. Information and Communication Percentage of visitors who note that they are aware of destination sustainability efforts Percentage of businesses that communicate their sustainability efforts to visitors in their products, marketing, or branding.
  • 14.
    Section B. EconomicValue Tourism Flow (volume and value) at destination Number of tourist nights per months 1. Relative contribution of tourism to the destination’s economy (% GDP) 2. Number of “same day” visitors in high season and low season 3. Daily spending per same- day visitor Tourism Enterprise(s) Performance Average length of stay of tourists (nights) 1. Average length of stay of same-day visitors (hours) 2. Percentage of ten largest tourism enterprises involved in destination management / cooperative marketing Occupancy rate in commercial accommodation per month and average for the year. Average price per room in the destination.
  • 15.
    Quantity and Quality ofEmployment Direct tourism employment as percentage of total employment 1. Percentage of jobs in tourism that are seasonal 2. Percentage of tourism enterprise providing student internships. Safety and Health Percentage of tourism enterprises inspected for fire safety in the last year Percentage of tourists who register a complaint with the police Tourism Supply Chain Percentage of tourism enterprises actively taking steps to source local, sustainable, and fair trade goods and services. 1. Percentage of the destination covered by a policy, promoting local, sustainable, and / or fair trade products and services 2. Percentage of tourism enterprises sourcing a minimum of 25 % of food and drink from local / regional producers.
  • 16.
    Social and CulturalImpact Community / Social Impact Number of Tourists / Visitors per 100 residents 1. Percentage of residents who are satisfied with tourism in destination (per month / season) 2. Number of beds available in commercial visitor accommodation per 100 residents. 3. Number of second / rental homes per 100 homes Gender Equality Percentage of men and women employed in the tourism sector 1. Percentage of tourism enterprises where the general manager position is held by a woman 2. Average wage in tourism for woman compared to average wage for men (sorted by tourism job type)
  • 17.
    Equality / AccessibilityPercentage of commercial accommodation with rooms accessible to people with disabilities and / or participating in recognized accessibility schemes Percentage of destination served by public transport that is accessible to people with disabilities and people with specific access requirements Percentage of visitor attractions that are accessible to people with disabilities and/or participating in recognized accessibility schemes Percentage of visitors satisfied with the accessibility of the destination for those with disabilities or specific access requirements Protecting and Enhancing Cultural Heritage, Local Identity, and Assets Percentage of the destination covered by a policy or plan that protects cultural heritage 1. Percentage of residents who have positive or negative views on the impact of tourism on destination identity. 2. Percentage of the destination’s biggest events that are focused on traditional / local culture and assets
  • 18.
    Environmental Impact Reducing Transport Impact Percentageof tourists and same- day visitors using different modes of transport to arrive at the destination (public / private and type) Percentage of visitors using local / soft mobility / public transport services to get around the destination Average travel (km) by tourists to and from home or average travel (km) from the previous destination to the current destination Average travel (km) by same- day visitors from their places of origin to the destination and back Climate Change Percentage of tourism enterprises involved in climate change mitigation schemes, such as CO2 offset, low-energy systems, etc., and “adaptation” responses and actions 1. Percentage of the destination included in climate change, adaptation strategy, or planning 2. Percentage tourism accommodation and attraction infrastructure located in “vulnerable zones”
  • 19.
    Solid Waste Management Waste volumeproduced by destination (tons per resident per year or per month) Percentage of tourism enterprises separating different types of waste Volume of waste recycled (percent or per resident per year) Sewage Treatment Percentage of sewage from the destination treated to at least secondary level prior to discharge Percentage of commercial accommodation connected to central sewage and / or employing tertiary sewage treatment Water Management Fresh water consumption per tourist night compared to general population water consumption per person night 1. Percentage of tourism enterprises with low- flow showerheads and taps and/ or dual flush toilets/ waterless urinals 2. Percentage of tourism enterprises using recycled water
  • 20.
    3. Percentage ofwater use derived from recycled water in the destination Energy Usage Energy consumption per tourist night compared to general population energy consumption per person night 1. Percentage of tourism enterprises that have switched to low-energy lighting 2. Annual amount of energy consumed from renewable sources (Mwah) as a percentage of overall energy consumption Landscape and Biodiversity Protection Percentage of destination (area in km squared) that is designated for protection 1. Percentage of local enterprises in the tourism sector actively supporting protection, conservation, and management of local biodiversity and landscape
  • 21.
    2. Percentage of destinationcovered by a biodiversity management and monitoring plan Light and Noise Management The destination has policies in places that require tourism enterprises to minimize light and noise pollution Percentage of the destination and percentage of population covered by local strategy and / or plans to reduce noise and light pollution Bathing Water Quality Level of contamination per 100 ml (fecal coliforms, campylobacter) Number of days beach / shore closed due to contamination
  • 23.
    Core Indicators Destination ManagementCore Indicators • sustainable tourism public policy • sustainable tourism management in tourism enterprises • customer satisfaction • information and communication
  • 26.
    Economic Value CoreIndicator • tourism flow (volume and value) at destination • tourism enterprise(s) performance • quantity and quality of employment • safety and health • tourism supply chain Social and Cultural Impact Core Indicators • community/ social impact as measured by the visitor to resident ratio • gender quality as measured by the ratio between men and women in the tourism labor force • accessibility for persons with disability • protecting and enhancing cultural heritage, local identity, and assets
  • 27.
    Environmental Impact CoreIndicator • reducing transport impact • tourism impact on climate change • solid waste management • sewage treatment • waste management • energy use • landscape and biodiversity protection • light and noise management • bathing water quality
  • 28.
    BOSTON CONSULTING GROUP’SSUSTAINABLE ECONOMIC DEVELOPMENT ASSESMENT Dimensions of Social and Economic Development 1. Income or Wealth 2. Level of employment 3. Income Equality 4. Income stability 5. Health of the population 6. Education 7. Governance 8. Environmental Stewardship 9. Infrastructure 10. Civil Society
  • 29.
    The SEDA scoresfor the ASEAN member countries (with available data) Country Wealth to well- being coefficient Growth to well- being coefficient Cambodia 1.17 1.32 Indonesia 1.37 1.24 Laos 1.27 1.14 Malaysia 1.05 0.87 Philippines 1.35 1.08 Singapore 1.03 1.24 Thailand 1.17 0.89 Vietnam 1.56 1.08 Average 1.25 1.11
  • 31.
    Sustainable Livelihood Approach Sustainablelivelihoods (SL) approach analyzes the impact of tourism development on a community in terms of its contribution to buildings capabilities, assets (natural, economic, or financial, human, and social capital),and activities required for a means of living (Lundberg 2011). It also analyzes tourism’s impact on creating sustainable livelihood, that is, the ability of a livelihood to cope with and recover from stresses and shocks , maintain or enhance its capabilities and assets, while preserving the natural resource base.
  • 32.
    SL approach measures outcomesin terms of the ff. Indicators: – Increase in income; – Increase well-being; – Reduced vulnerability; – Improved food security; and – More sustainable use of natural resource base
  • 33.
    Philippine Environmental Impact AssessmentSystem Environmental Impact Assessment (EIA) Is a process that involves predicting and evaluating the likely impacts of a projects (including cumulative impacts) on the environment during construction, commissioning, operation, and abandonment. It also includes designing appropriate preventive, mitigating, and enhancement measures addressing these consequences to protect the environment and the community’s welfare. EIA is mandated by law under the Presidential Decree No. 1586, which established “ an environmental impact statement system including other environmental management related measures and for other purposes”.
  • 35.
    –Initial Environmental Examination(IEE) is required for projects of the ff. nature: building, batching and crushing plant, cemetery, funeral parlors, crematorium, fishery aquaculture, food and food by-products, irrigation and flood control, non-food manufacturing plant, water supply, and resort and other tourism or leisure.
  • 36.
    Possible Environmental andsocial impacts of projects, included potential impacts for projects are: 1. Consistency with the use (residential, commercial/institutional, industrial, agricultural/recreational, protected areas, etc.); 2. Disturbance to wild life due to vegetation caring (forestland, marshland, grassland, mangrove, wetland etc.); 3. Change in surface landform/topography/terrain/slope (slope types: flat which is 0-3%, gently sloping to rolling, 3-18%, and steep, a gradient of greater than > 18%) 4. Soil erosion (hazard-prone or not); 5. Soil/land contamination due to improper solid waste disposal (soil types: sandy, clay, sandy-loam)
  • 37.
    6. Impairment ofvisual aesthetics (presence of visually significant land forms, landscape, or structures); 7. Devaluation of land values; 8. Increased siltation due to project activities; 9. Water quality degradation; 10. Competition in water use; 11. Depletion of water resources; 12. Increased occurrence of flooding; 13. Air quality degradation; 14. Nuisance due to noise generation; 15. Displacement of residents in the project site and within its vicinity;
  • 38.
    16. Displacement ofindigenous people; 17. Enhanced employment and/or livelihood opportunities; 18. Reduced employment and/or livelihood opportunities; 19. Increased revenues for LGU; 20. Disruption/Competition in delivery of public services (education, peace, and order etc.); 21. Enhance delivery of public services (education, peace, and order etc.); 22. Increased in traffic volume and worsening of traffic flow; 23. Impacts on community health and safety.
  • 39.
    Other Impact Assessment Framework WTO1996 enumerated core indicators of sustainable tourism development, namely: 1. Site Protection 2. Stress 3. Use intensity 4. Social Impact 5. Development Control 6. Waste Management 7. Planning Process 8. Critical Ecosystems 9. Consumer Satisfaction 10. Local Satisfaction
  • 40.
    List of indicatorsthat can be used for assessing the impact of tourism development
  • 41.
    Economic Indicators: 1. Tourismrevenues 2. Average tourist expenditure 3. Taxes form tourism 4. Number of registered tourism-related business 5. Inflation/price index in tourism areas 6. Occupancy rates of hotel and resorts 7. Load factors of transportation units 8. Percentage of share of tourism in relation to other industries 9. Tourism employment (direct and indirect) 10. Average monthly wage of tourism industry workers 11. Visitor satisfaction index provided by customer feedback
  • 42.
    Environmental Indicators 1. Infrastructureto manage and minimize solid and liquid wastes 2. Water quality index 3. Air quality index 4. Percent of population exposed to pollution 5. Amount of water consumed and percentage of leakage 6. Amount fossils fuels used 7. Speed of motor vehicles during rush hour 8. Amount of packaging purchased with supplies 9. Adherence to codes of behavior that respect natural heritage 10. Compliance with best practice guidelines in designing, planning and constructions of buildings
  • 43.
    11. Adaption oftechnologies that reduce consumption of natural resources, reduce waste, and pollution, such as solar power 12. Use of local materials and local architecture that do not destroy aesthetics values 13. Extent of used of soft transport, such as cycle routes and walking trails 14. Used of sustainable trails, hides, and interpretation 15. Used of sustainable souvenirs; those not made from parts of endangered animal and plant species 16. Used of biodegradable soaps and detergents 17. Park fees used to manage habitat and species 18. Percentage of profits invested in nature conservation 19. Average annual frequency and severity of natural disasters