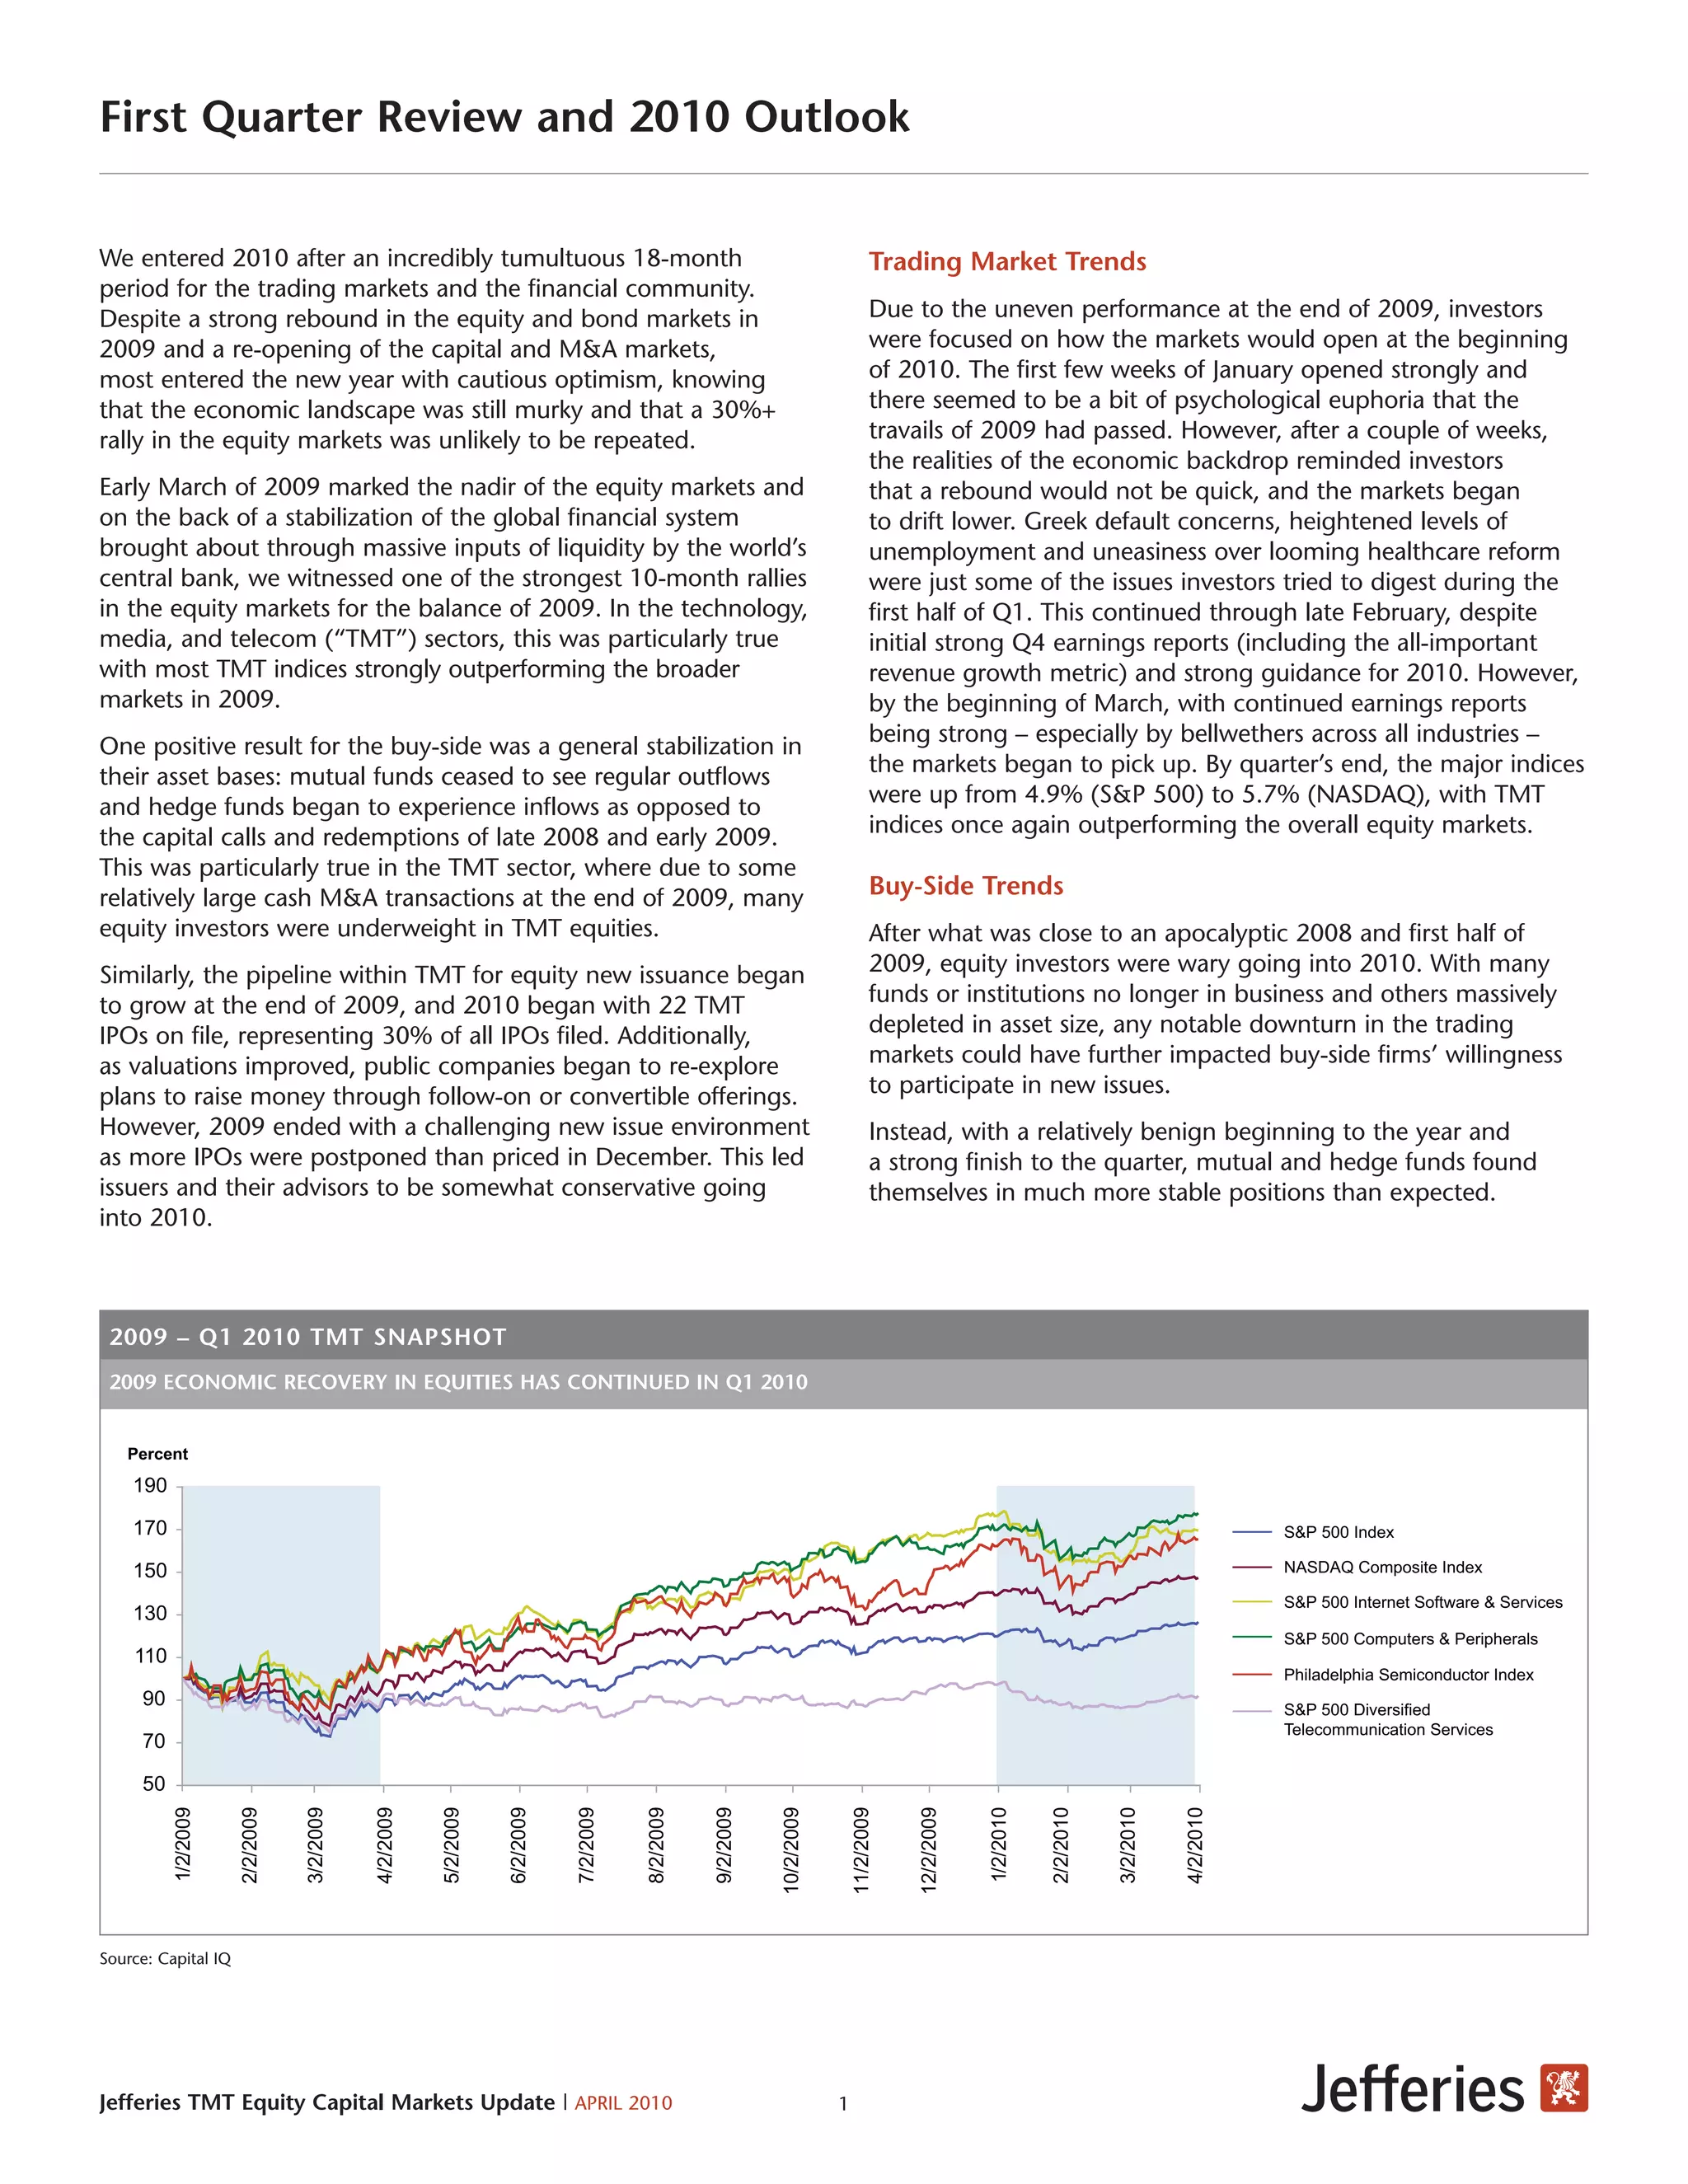
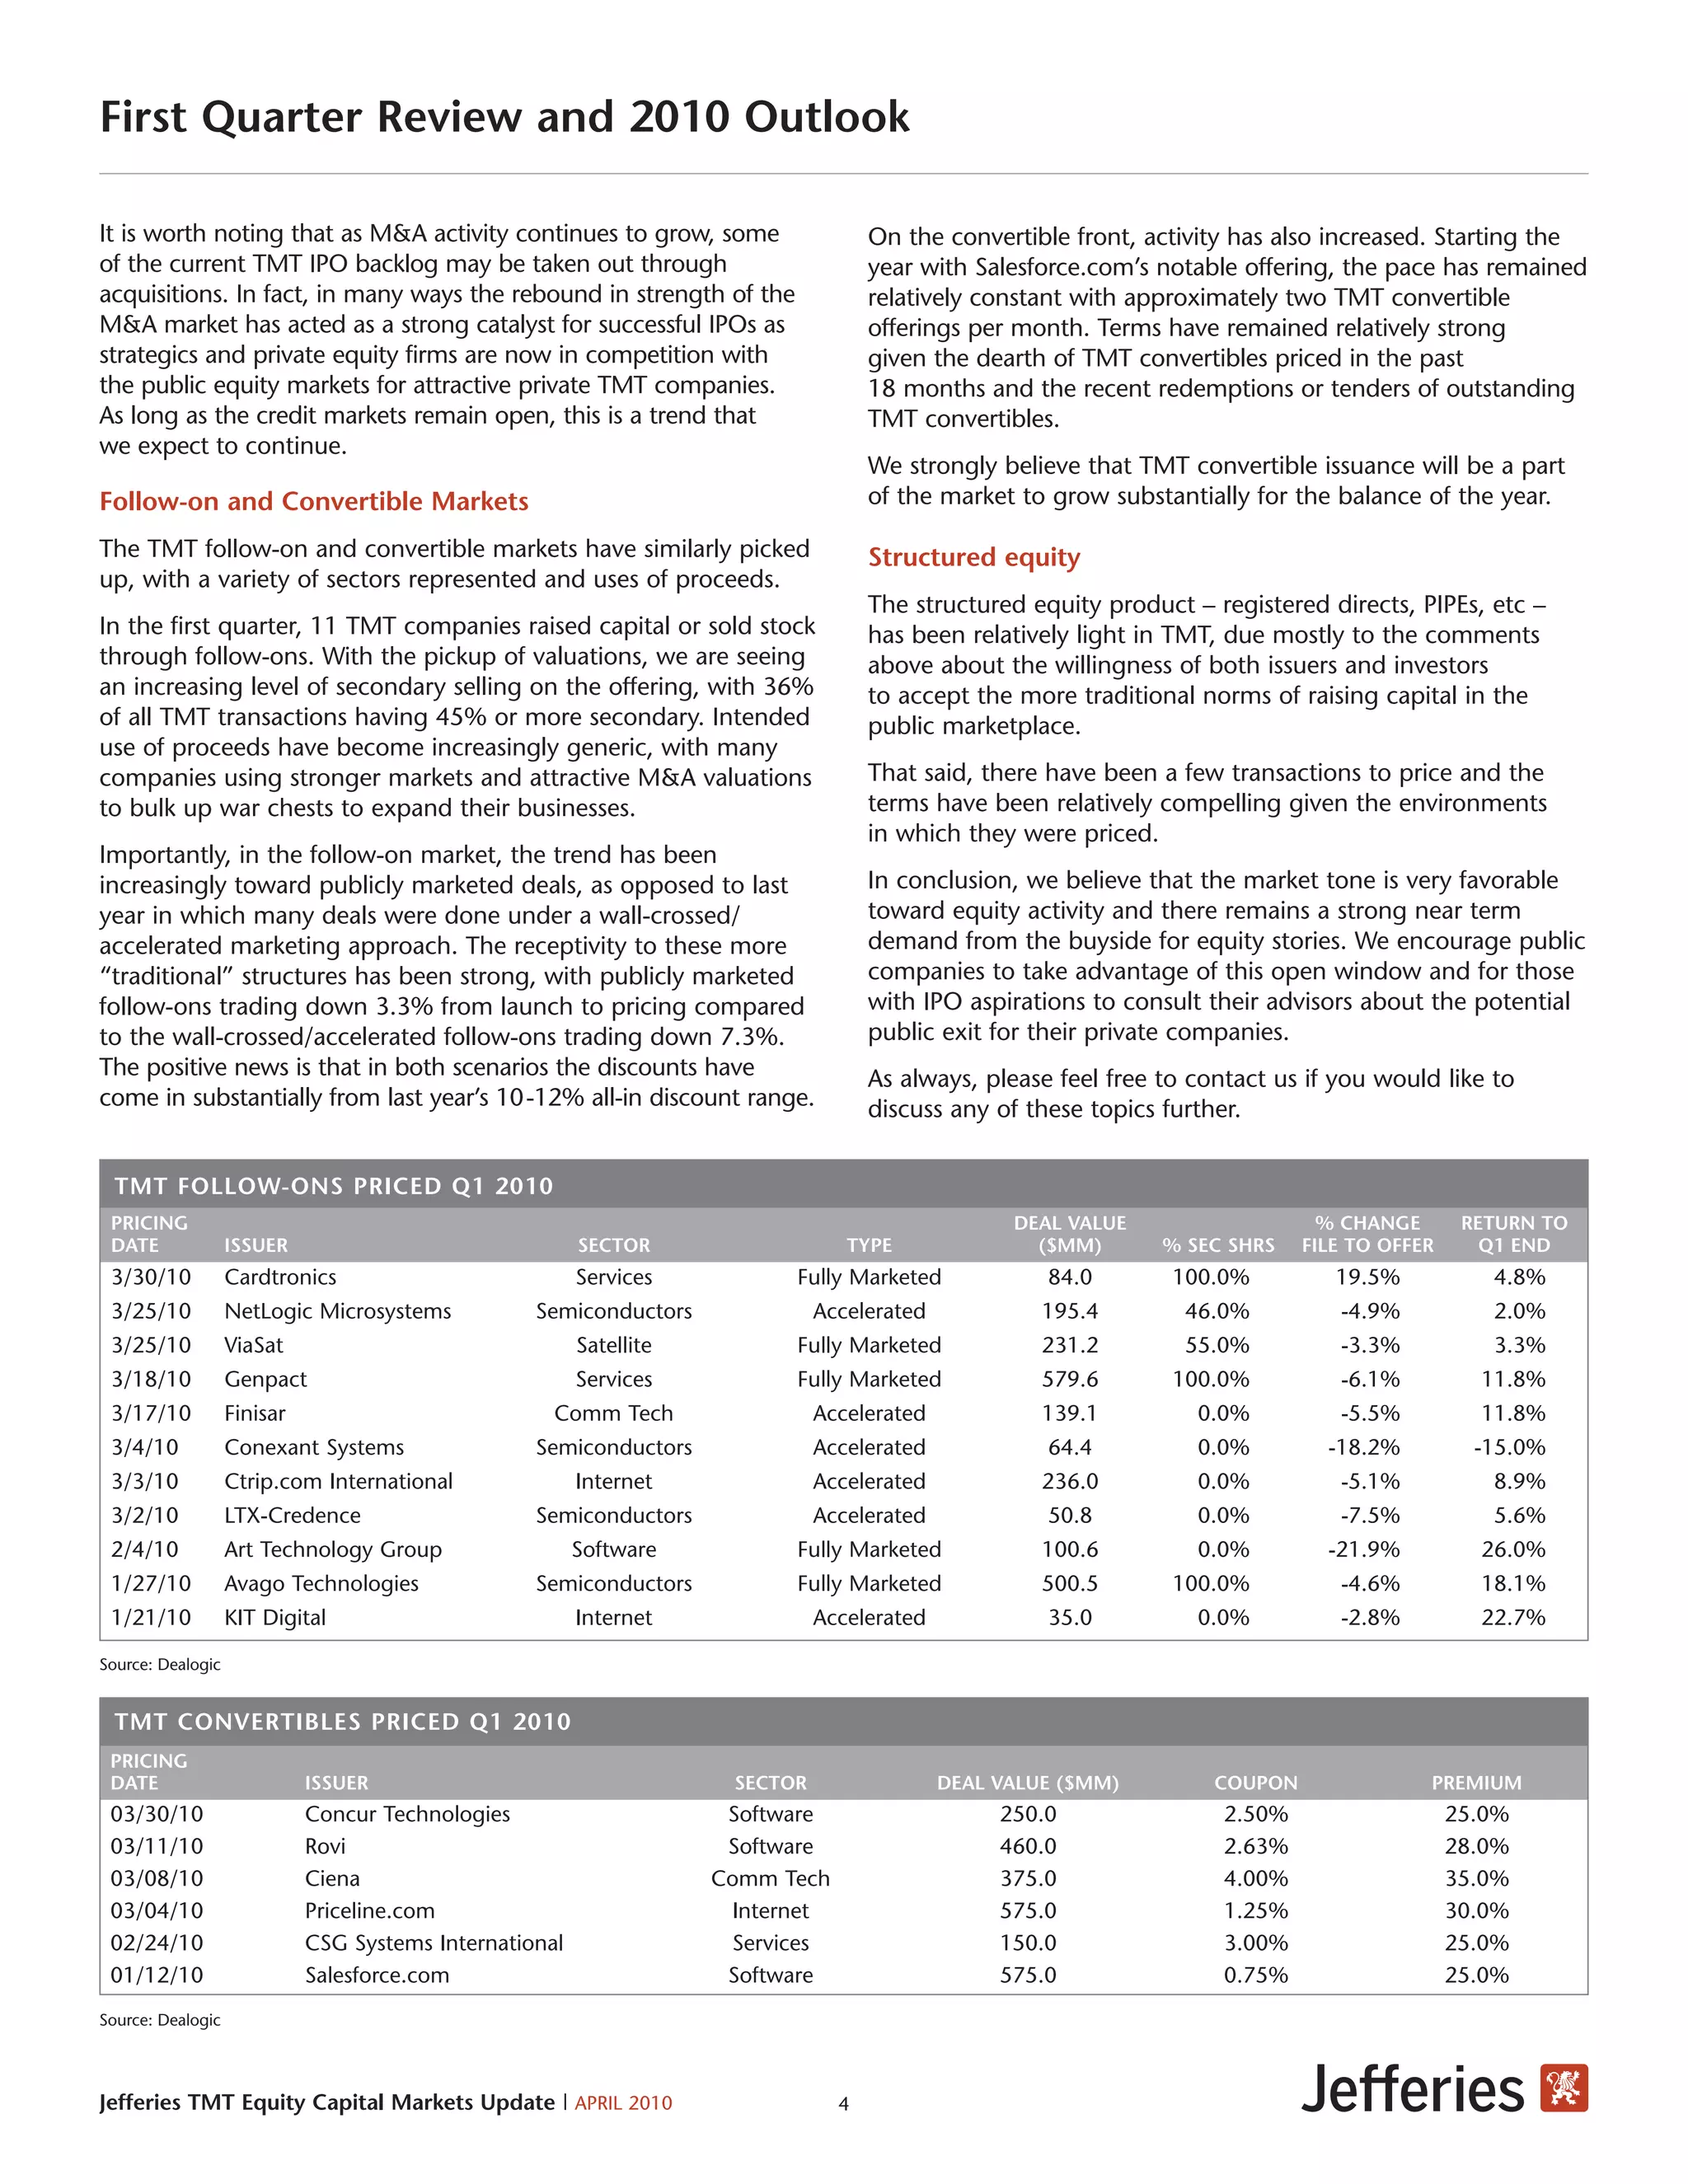
Jefferies TMT Equity Capital Markets Update
                                                                              2010 First Quarter Review


Jefferies TMT
Equity Capital Markets
                                 ISSUE HIGHLIGHTS:

Alex Lehmann                     • Stabilization of the buy-side: Increased appetite for all equities and
Managing Director
TMT Equity Origination             particularly TMT equities
212.323.3946
alehmann@Jefferies.com           • New issue pipeline builds: As valuations improve, issuers and investors
Jefferies & Company, Inc.
                                   begin to lineup for IPOs, follow-ons, and convertibles
520 Madison Avenue
New York, NY 10022
                                 • M&A activity grows: This increase has created an “underweight”
www.jefferies.com
                                   situation for equity investors in TMT securities


APRIL 2010
First Quarter Review and 2010 Outlook


We entered 2010 after an incredibly tumultuous 18-month                                                                             Trading Market Trends
period for the trading markets and the financial community.
Despite a strong rebound in the equity and bond markets in                                                                          Due to the uneven performance at the end of 2009, investors
2009 and a re-opening of the capital and M&A markets,                                                                               were focused on how the markets would open at the beginning
most entered the new year with cautious optimism, knowing                                                                           of 2010. The first few weeks of January opened strongly and
that the economic landscape was still murky and that a 30%+                                                                         there seemed to be a bit of psychological euphoria that the
rally in the equity markets was unlikely to be repeated.                                                                            travails of 2009 had passed. However, after a couple of weeks,
                                                                                                                                    the realities of the economic backdrop reminded investors
Early March of 2009 marked the nadir of the equity markets and                                                                      that a rebound would not be quick, and the markets began
on the back of a stabilization of the global financial system                                                                       to drift lower. Greek default concerns, heightened levels of
brought about through massive inputs of liquidity by the world’s                                                                    unemployment and uneasiness over looming healthcare reform
central bank, we witnessed one of the strongest 10-month rallies                                                                    were just some of the issues investors tried to digest during the
in the equity markets for the balance of 2009. In the technology,                                                                   first half of Q1. This continued through late February, despite
media, and telecom (“TMT”) sectors, this was particularly true                                                                      initial strong Q4 earnings reports (including the all-important
with most TMT indices strongly outperforming the broader                                                                            revenue growth metric) and strong guidance for 2010. However,
markets in 2009.                                                                                                                    by the beginning of March, with continued earnings reports
                                                                                                                                    being strong – especially by bellwethers across all industries –
One positive result for the buy-side was a general stabilization in
                                                                                                                                    the markets began to pick up. By quarter’s end, the major indices
their asset bases: mutual funds ceased to see regular outflows
                                                                                                                                    were up from 4.9% (S&P 500) to 5.7% (NASDAQ), with TMT
and hedge funds began to experience inflows as opposed to
                                                                                                                                    indices once again outperforming the overall equity markets.
the capital calls and redemptions of late 2008 and early 2009.
This was particularly true in the TMT sector, where due to some
relatively large cash M&A transactions at the end of 2009, many                                                                     Buy-Side Trends
equity investors were underweight in TMT equities.                                                                                  After what was close to an apocalyptic 2008 and first half of
Similarly, the pipeline within TMT for equity new issuance began                                                                    2009, equity investors were wary going into 2010. With many
to grow at the end of 2009, and 2010 began with 22 TMT                                                                              funds or institutions no longer in business and others massively
IPOs on file, representing 30% of all IPOs filed. Additionally,                                                                     depleted in asset size, any notable downturn in the trading
as valuations improved, public companies began to re-explore                                                                        markets could have further impacted buy-side firms’ willingness
plans to raise money through follow-on or convertible offerings.                                                                    to participate in new issues.
However, 2009 ended with a challenging new issue environment                                                                        Instead, with a relatively benign beginning to the year and
as more IPOs were postponed than priced in December. This led                                                                       a strong finish to the quarter, mutual and hedge funds found
issuers and their advisors to be somewhat conservative going                                                                        themselves in much more stable positions than expected.
into 2010.


 2009 – Q1 2010 TMT SNAPSHOT
 2009 ECONOMIC RECOVERY IN EQUITIES HAS CONTINUED IN Q1 2010


   Percent
    190

    170                                                                                                                                                                                          S&P 500 Index

    150                                                                                                                                                                                          NASDAQ Composite Index

                                                                                                                                                                                                 S&P 500 Internet Software & Services
    130
                                                                                                                                                                                                 S&P 500 Computers & Peripherals
    110
                                                                                                                                                                                                 Philadelphia Semiconductor Index
     90                                                                                                                                                                                          S&P 500 Diversified
                                                                                                                                                                                                 Telecommunication Services
     70

     50
          1/2/2009


                     2/2/2009


                                3/2/2009


                                           4/2/2009


                                                      5/2/2009


                                                                 6/2/2009


                                                                            7/2/2009


                                                                                       8/2/2009


                                                                                                  9/2/2009


                                                                                                             10/2/2009


                                                                                                                             11/2/2009


                                                                                                                                         12/2/2009


                                                                                                                                                     1/2/2010


                                                                                                                                                                2/2/2010


                                                                                                                                                                           3/2/2010


                                                                                                                                                                                      4/2/2010


Source: Capital IQ


Jefferies TMT Equity Capital Markets Update | APRIL 2010                                                                 1
First Quarter Review and 2010 Outlook


In addition, proceeds that many asset managers received as part
                                                                                    MONTHLY US EQUITY MUTUAL FUND FLOWS
of cash M&A deals that closed in Q1 gave them additional capital
to re-invest in the market and/or additional cushion in the case of                   $ in Billions
redemptions or capital calls.                                                          15                   $13.9

                                                                                       12                                                                           $11.6

New Issue Trends
                                                                                         9
                                                                                                                    $7.3
If there was one pattern witnessed in the first quarter related                          6                                        $4.9
to new issuance, it was the reminder of how quickly windows                                                                $3.7
for new issuance can open and shut. Companies that were                                  3
                                                                                                                                                                            $0.2            $0.7
unfortunate enough to be on the road during negative macro                               0
economic news releases suffered either the inability to price an                                                                                                                   ($1.2)
                                                                                        -3        ($2.3)
offering or were forced to do it on terms that were less favorable                                                                                ($3.7)
as compared to the launch of their roadshow.                                            -6
                                                                                                                                                           ($6.3)
                                                                                        -9                                               ($7.9)
IPO Market                                                                                            Apr   May June        Jul   Aug    Sep      Oct      Nov      Dec     Jan     Feb     Mar
                                                                                                  2009                                                                      2010
The IPO market started 2010 somewhat tamely due to many
issuers waiting for year-end results and audits. The first TMT                    Source: Ipreo
company to hit the market in Q1 was Quinstreet, a online local
advertising business. Due to a market that traded down during                     oversubscribed. Equally as important, all of these IPOs have
the roadshow, the offering was priced below the range but has                     traded up well in the aftermarket.
since traded up nicely since issue.
                                                                                  Also of interest, on several of these transactions, investors were
The market then took a break until early March when five TMT                      willing to look to 2011 projections when valuing these businesses
IPOs launched. Interestingly the offerings came across many                       – a point earlier in the calendar year than we have seen in almost
different TMT sectors including communications equipment,                         a decade.
semiconductors, and software, and were all priced within two
                                                                                  Another lesson learned from these offerings is that while growth
weeks. All five transactions priced well, with two pricing above
                                                                                  remains important to investors, it is not the key driver in attaining
their ranges and the other three pricing at the high ends. Also
                                                                                  a successful offering and valuation. Investors remain generally
interestingly, the sizes of these offerings were relatively low,
                                                                                  focused on profitability and revenue growth of around 20%
marked at the smallest end by Calix (launched at $76mm),
                                                                                  (which is now considered “growth” in the post-2007 era). That
Meru Networks (launched at $61.4mm) and MaxLinear
                                                                                  said, we did see several transactions, including Calix and Meru,
(launched at $65mm). Importantly, despite the varying –
                                                                                  that priced off of a combination of EV/revenues and PE multiples,
and in some cases small – deal sizes, the appetite for these
                                                                                  the first time a TMT IPO has priced off of a revenue multiple in
offerings was strong with every offering receiving a “who’s who”
                                                                                  almost three years.
of investors on the roadshow and ending up many times


 TMT M&A DEALS CLOSED DURING Q1 2010
 DATE
 CLOSED                   ACQUIROR                                  TARGET                                            SECTOR                                        DEAL VALUE ($MM)
 02/08/10                 Xerox                        Affiliated Computer Services                                   Services                                                8,374.2
 01/27/10                 Oracle                               Sun Microsystems                               Comp Equipment                                                  7,305.2
 02/26/10                 Investor Group                          IMS Health                                               HCIT                                               4,038.0
 02/18/10                 KDDI                             Liberty Global-Subsidiaries                         Telecom Services                                               4,000.0
 02/08/10                 Windstream                       NuVox Communications                                Telecom Services                                                    643.0

 TMT M&A DEALS ANNOUNCED DURING Q1 2010
 DATE
 ANNOUNCED                ACQUIROR                                  TARGET                                            SECTOR                                        DEAL VALUE ($MM)
 03/02/10                 Elliott Associates LP                      Novell                                          Software                                                 1,883.8
 03/05/10                 ABRY Partners LLC                           RCN                                      Telecom Services                                               1,273.0
 03/29/10                 Avnet                               Bell Microproducts                              Comp Equipment                                                       568.4
 02/23/10                 RR Donnelley & Sons                    Bowne & Co                                            Media                                                       467.1
 03/08/10                 CCMP Capital Advisors                    infoGroup                                           Media                                                       463.2
Source: Thomson Reuters


Jefferies TMT Equity Capital Markets Update | APRIL 2010                      2
First Quarter Review and 2010 Outlook


Issuers and investors are now looking to see what the next TMT
                                                                                                    CURRENT TMT IPO BACKLOG
offering could be and while there are several that seem to be
through the SEC clearance process, it is unclear which company                                     FILING                                                               AMT. FILED
                                                                                                   DATE              ISSUER                                 SECTOR       ($MM)
will come to market first in Q2. It does appear that despite the
recent willingness of investors to look to 2011 projections, that                                  03/31/10          Alpha and Omega                  Semiconductors        91.1
some companies want a little more certainty that they’ll get                                       03/26/10          Envestnet                           Software          100.0
credit for 2011 projections and thus are waiting for the late                                      03/26/10          SciQuest                              Software         75.0
April / early May time-period before tapping the markets.
                                                                                                   03/18/10          Telx                            Telecom Services      100.0
In the mean time, the IPO pipeline continues to build.                                             03/18/10          IronPlanet                            Internet         92.0
Currently, there are 33 TMT companies publicly filed for IPOs
                                                                                                   03/15/10          MagnaChip Semiconductor          Semiconductors       250.0
with another six to eight on file confidentially. In total this
represents almost 40% of the roughly 90 IPOs that are                                              03/15/10          BroadSoft                         Comm Tech           103.5
currently filed.                                                                                   03/10/10          Eyeblaster                         New Media          115.0

Importantly, we expect this number to grow substantially in                                        03/02/10          Force10 Networks                  Comm Tech           143.8
the next four to six weeks, with between seven and ten new                                         02/26/10          Green Dot                             Services        150.0
companies in the TMT space getting on file. With many                                              02/22/10          Reply!                             New Media           60.0
companies waiting for up to a month before going public, it                                        02/10/10          GameFly                            New Media           50.0
could mean a total IPO backlog for TMT (including confidential
                                                                                                   02/08/10          Wave2Wave Communications Telecom Services              94.9
filers) of close to 45 companies by the end of April.
                                                                                                   01/28/10          GlassHouse Technologies               Services         75.0
One characteristic of the current pipeline is the presence of
                                                                                                   01/25/10          Convio                                Software         57.5
smaller companies. In some cases, these are companies that are
aware that the market windows are opening and shutting more                                        01/22/10          Motricity                         Comm Tech           250.0
quickly than ever before. Subsequently, they are getting process                                   01/22/10          Everyday Health                       Internet        100.0
on file, with the belief that by the time they are through the                                     01/05/10          DynaVox                                HCIT           125.0
SEC they will be at a valuation threshold (roughly $200mm)                                         12/22/09          ReachLocal                         New Media          100.0
that will be attractive to small-cap growth investors.
                                                                                                   12/22/09          Mitel Networks                    Comm Tech           230.0
                                                                                                   12/07/09          Language Line Services                Services        400.0
 CURRENT TMT IPO BACKLOG (BY SECTOR)                                                               12/03/09          SPS Commerce                          Software         46.0
                                                                                                   11/23/09          Telegent Systems                 Semiconductors       250.0
                               Other – 6.1%
                                                         Services – 18.2%                          11/20/09          Fabrinet                         Semiconductors       150.0
           New Media – 12.1%
                                                                                                   10/30/09          TeleNav                           Comm Tech            75.0
                                                                                                   10/14/09          BJB Career Education                  Internet        100.0
                                                                                                   10/02/09          West                                  Services        500.0
                                                                  Semiconductors – 12.1%
        Software – 12.1%                                                                           09/29/09          Accretive Health                       HCIT           200.0
                                                                                                   09/28/09          Newegg                                Internet        175.0
                                                                                                   01/10/08          Intelius                              Services        143.8
    Telecom Services – 9.1%
                                                             Internet – 12.1%                      11/30/07          Broadview Networks              Telecom Services      250.0
        Computer Equipment – 3%                                                                    08/08/07          BancTec                               Services         70.9
                                    Comm Tech – 15.2%
                                                                                                   07/27/07          Intcomex                        Comp Equipment        125.0

Source: Dealogic                                                                                  Source: Dealogic


 TMT IPOs PRICED Q1 2010
 PRICING                                                                         DEAL VALUE           % OF                                    PRICING RELATIVE        RETURN TO
 DATE              ISSUER                                SECTOR                    ($MM)           COMPANY SOLD               % SEC SHRS        TO MIDPOINT             Q1 END
 3/30/10           Meru Networks                        Comm Tech                     75.7               33.9%                   18.5%           In Range               27.8%
 3/30/10           SS&C Technologies                     Software                   160.9                15.5%                   23.3%           In Range                0.5%
 3/23/10           MaxLinear                      Semiconductors                    103.7                24.4%                   20.1%             Above                27.0%
 3/23/10           Calix                                Comm Tech                     82.3               17.4%                   34.2%           In Range                3.5%
 3/15/10           Financial Engines                     Services                   146.3                31.5%                   44.6%             Above                40.8%
 2/10/10           QuinStreet                           New Media                   150.0                22.3%                    0.0%             Below                13.4%
Source: Dealogic


Jefferies TMT Equity Capital Markets Update | APRIL 2010                                      3
First Quarter Review and 2010 Outlook

It is worth noting that as M&A activity continues to grow, some                      On the convertible front, activity has also increased. Starting the
of the current TMT IPO backlog may be taken out through                              year with Salesforce.com’s notable offering, the pace has remained
acquisitions. In fact, in many ways the rebound in strength of the                   relatively constant with approximately two TMT convertible
M&A market has acted as a strong catalyst for successful IPOs as                     offerings per month. Terms have remained relatively strong
strategics and private equity firms are now in competition with                      given the dearth of TMT convertibles priced in the past
the public equity markets for attractive private TMT companies.                      18 months and the recent redemptions or tenders of outstanding
As long as the credit markets remain open, this is a trend that                      TMT convertibles.
we expect to continue.
                                                                                     We strongly believe that TMT convertible issuance will be a part
Follow-on and Convertible Markets                                                    of the market to grow substantially for the balance of the year.

The TMT follow-on and convertible markets have similarly picked                      Structured equity
up, with a variety of sectors represented and uses of proceeds.
                                                                                     The structured equity product – registered directs, PIPEs, etc –
In the first quarter, 11 TMT companies raised capital or sold stock                  has been relatively light in TMT, due mostly to the comments
through follow-ons. With the pickup of valuations, we are seeing                     above about the willingness of both issuers and investors
an increasing level of secondary selling on the offering, with 36%                   to accept the more traditional norms of raising capital in the
of all TMT transactions having 45% or more secondary. Intended                       public marketplace.
use of proceeds have become increasingly generic, with many
companies using stronger markets and attractive M&A valuations                       That said, there have been a few transactions to price and the
to bulk up war chests to expand their businesses.                                    terms have been relatively compelling given the environments
                                                                                     in which they were priced.
Importantly, in the follow-on market, the trend has been
increasingly toward publicly marketed deals, as opposed to last                      In conclusion, we believe that the market tone is very favorable
year in which many deals were done under a wall-crossed/                             toward equity activity and there remains a strong near term
accelerated marketing approach. The receptivity to these more                        demand from the buyside for equity stories. We encourage public
“traditional” structures has been strong, with publicly marketed                     companies to take advantage of this open window and for those
follow-ons trading down 3.3% from launch to pricing compared                         with IPO aspirations to consult their advisors about the potential
to the wall-crossed/accelerated follow-ons trading down 7.3%.                        public exit for their private companies.
The positive news is that in both scenarios the discounts have                       As always, please feel free to contact us if you would like to
come in substantially from last year’s 10-12% all-in discount range.                 discuss any of these topics further.


 TMT FOLLOW-ONS PRICED Q1 2010
 PRICING                                                                                           DEAL VALUE                    % CHANGE       RETURN TO
 DATE              ISSUER                                SECTOR                   TYPE               ($MM)       % SEC SHRS    FILE TO OFFER      Q1 END
 3/30/10           Cardtronics                           Services          Fully Marketed             84.0        100.0%          19.5%           4.8%
 3/25/10           NetLogic Microsystems           Semiconductors              Accelerated            195.4        46.0%          -4.9%           2.0%
 3/25/10           ViaSat                                Satellite         Fully Marketed             231.2        55.0%          -3.3%           3.3%
 3/18/10           Genpact                               Services          Fully Marketed             579.6       100.0%          -6.1%          11.8%
 3/17/10           Finisar                           Comm Tech                 Accelerated            139.1         0.0%          -5.5%          11.8%
 3/4/10            Conexant Systems                Semiconductors              Accelerated            64.4          0.0%         -18.2%          -15.0%
 3/3/10            Ctrip.com International               Internet              Accelerated            236.0         0.0%          -5.1%           8.9%
 3/2/10            LTX-Credence                    Semiconductors              Accelerated            50.8          0.0%          -7.5%           5.6%
 2/4/10            Art Technology Group                  Software          Fully Marketed             100.6         0.0%         -21.9%          26.0%
 1/27/10           Avago Technologies              Semiconductors          Fully Marketed             500.5       100.0%          -4.6%          18.1%
 1/21/10           KIT Digital                           Internet              Accelerated            35.0          0.0%          -2.8%          22.7%

Source: Dealogic


 TMT CONVERTIBLES PRICED Q1 2010
 PRICING
 DATE                        ISSUER                                   SECTOR                 DEAL VALUE ($MM)         COUPON               PREMIUM
 03/30/10                    Concur Technologies                      Software                    250.0                2.50%                   25.0%
 03/11/10                    Rovi                                     Software                    460.0                2.63%                   28.0%
 03/08/10                    Ciena                                   Comm Tech                    375.0                4.00%                   35.0%
 03/04/10                    Priceline.com                            Internet                    575.0                1.25%                   30.0%
 02/24/10                    CSG Systems International                Services                    150.0                3.00%                   25.0%
 01/12/10                    Salesforce.com                           Software                    575.0                0.75%                   25.0%
Source: Dealogic


Jefferies TMT Equity Capital Markets Update | APRIL 2010                         4
About Jefferies
Jefferies, a major global securities and investment banking firm, has served companies and their investors for more than 45 years.
Headquartered in New York City, with offices in more than 25 cities around the world, Jefferies provides clients with capital
markets and financial advisory services, institutional brokerage, securities research and asset management. The firm provides
investors with fundamental research and trade execution in equity, equity-linked, and fixed income securities, including
corporate bonds, high yield bonds, US government and agency securities, repo finance, mortgage- and asset-backed securities,
municipal bonds, whole loans and emerging markets debt, as well as commodities and derivatives. Jefferies offers companies
capital markets, merger and acquisition, restructuring and other financial advisory services. Jefferies & Company, Inc. is
the principal operating subsidiary of Jefferies Group, Inc. (NYSE: JEF; www.jefferies.com). Jefferies International Limited,
a UK-incorporated, wholly owned subsidiary of Jefferies Group, Inc., is authorized and regulated by the UK Financial
Services Authority.
For corporate clients, the Firm is a top M&A and restructuring advisor and underwriter of high yield and equity new issues.
Serving institutional investors and high net worth individuals, the Firm is a leading provider of trade execution in equity,
convertible, and high yield securities and a market maker of investment grade fixed income and commodity-linked products.
Jefferies also offers top-tier private client services, prime brokerage, securities lending, correspondent clearing and NYSE
brokerage services. The Firm has an award-winning research practice, covering equity, high yield and convertible securities,
as well as a growing asset management practice utilizing a variety of asset strategies.
Jefferies was founded in the capital markets as a third-market equity trading firm and has flourished over the past five decades.
The Firm’s reputation has been built on a high level of client attention and service, and the ability to execute large block trades
with minimal market impact. Today, Jefferies is seen by many as the investment bank of choice for companies and their investors.
A creative, hands-on approach, combined with experience, expertise and widespread relationships, distinguishes the firm.

Important Disclosures
This communication is being provided strictly for informational purposes only and is not intended as a recommendation or an
offer or solicitation for the purchase or sale of any security referenced herein. The information upon which this material is based
was obtained from sources believed to be reliable, but has not been independently verified, therefore, we do not guarantee its
accuracy. Any opinion or estimates constitute our best judgment as of this date, and are subject to change without notice, and
any views expressed herein may not be supported by independent analysis. Jefferies & Company, Inc. and Jefferies International
Limited and their affiliates and their respective directors, officers and employees may buy or sell securities mentioned herein as
agent or principal for their own account. This report was created by members of the Jefferies investment banking division of
Jefferies & Company, Inc. (“Jefferies”), employing appropriate expertise, and in the belief that it is fair and not misleading.
The report has not been reviewed by, or discussed with, any member of Jefferies’ research department. This report is not
intended to be, and in no way constitutes a “research report”, as such term is defined in Rule 137 promulgated under the
US Securities Act of 1933, as amended, nor should it be considered the same under the Conduct of Business Rules of the
Financial Services Authority (“FSA”). Jefferies’ investment banking department has done, and may continue to do business with,
companies included in this report. This document is a marketing communication; it is not and should not be construed as
investment research.

Additional Information
In the UK, this material is intended for use only by persons who have professional experience in matters relating to investments
falling within Articles 19(5) and 49(2)(a) to (d) of the Financial Services and Markets Act 2000 (Financial Promotion) Order 2005
(as amended), or by persons to whom it can be otherwise lawfully distributed. For Canadian investors, this material is intended
for use only by professional or institutional investors. None of the investments or investment services mentioned or described
herein is available to other persons or to anyone in Canada who is not a "Designated Institution" as defined by the Securities Act
(Ontario). Recipients of this document in any other jurisdiction should inform themselves about and observe any applicable legal
requirements in relation to the receipt of this document. Jefferies International Limited is authorized and regulated in the United
Kingdom by the Financial Services Authority. Its registered office is at Vintners Place, 68 Upper Thames Street, London EC4V 3BJ;
telephone +44 (0)20 7029 8000; facsimile +44 (0)20 7029 8010.
Reproduction of this document without written permission of Jefferies is expressly forbidden. All logos, trademarks and service marks appearing herein are property of Jefferies & Company, Inc.
Member SIPC • © 04/2010 Jefferies & Company, Inc.


Jefferies & Company, Inc.
520 Madison Avenue
New York, NY 10022
Jefferies.com


Investment Banking
Sales & Trading
Research
Asset Management

Jefferies TMT Q1 Review

  • 1.
    Jefferies TMT EquityCapital Markets Update 2010 First Quarter Review Jefferies TMT Equity Capital Markets ISSUE HIGHLIGHTS: Alex Lehmann • Stabilization of the buy-side: Increased appetite for all equities and Managing Director TMT Equity Origination particularly TMT equities 212.323.3946 alehmann@Jefferies.com • New issue pipeline builds: As valuations improve, issuers and investors Jefferies & Company, Inc. begin to lineup for IPOs, follow-ons, and convertibles 520 Madison Avenue New York, NY 10022 • M&A activity grows: This increase has created an “underweight” www.jefferies.com situation for equity investors in TMT securities APRIL 2010
  • 2.
    First Quarter Reviewand 2010 Outlook We entered 2010 after an incredibly tumultuous 18-month Trading Market Trends period for the trading markets and the financial community. Despite a strong rebound in the equity and bond markets in Due to the uneven performance at the end of 2009, investors 2009 and a re-opening of the capital and M&A markets, were focused on how the markets would open at the beginning most entered the new year with cautious optimism, knowing of 2010. The first few weeks of January opened strongly and that the economic landscape was still murky and that a 30%+ there seemed to be a bit of psychological euphoria that the rally in the equity markets was unlikely to be repeated. travails of 2009 had passed. However, after a couple of weeks, the realities of the economic backdrop reminded investors Early March of 2009 marked the nadir of the equity markets and that a rebound would not be quick, and the markets began on the back of a stabilization of the global financial system to drift lower. Greek default concerns, heightened levels of brought about through massive inputs of liquidity by the world’s unemployment and uneasiness over looming healthcare reform central bank, we witnessed one of the strongest 10-month rallies were just some of the issues investors tried to digest during the in the equity markets for the balance of 2009. In the technology, first half of Q1. This continued through late February, despite media, and telecom (“TMT”) sectors, this was particularly true initial strong Q4 earnings reports (including the all-important with most TMT indices strongly outperforming the broader revenue growth metric) and strong guidance for 2010. However, markets in 2009. by the beginning of March, with continued earnings reports being strong – especially by bellwethers across all industries – One positive result for the buy-side was a general stabilization in the markets began to pick up. By quarter’s end, the major indices their asset bases: mutual funds ceased to see regular outflows were up from 4.9% (S&P 500) to 5.7% (NASDAQ), with TMT and hedge funds began to experience inflows as opposed to indices once again outperforming the overall equity markets. the capital calls and redemptions of late 2008 and early 2009. This was particularly true in the TMT sector, where due to some relatively large cash M&A transactions at the end of 2009, many Buy-Side Trends equity investors were underweight in TMT equities. After what was close to an apocalyptic 2008 and first half of Similarly, the pipeline within TMT for equity new issuance began 2009, equity investors were wary going into 2010. With many to grow at the end of 2009, and 2010 began with 22 TMT funds or institutions no longer in business and others massively IPOs on file, representing 30% of all IPOs filed. Additionally, depleted in asset size, any notable downturn in the trading as valuations improved, public companies began to re-explore markets could have further impacted buy-side firms’ willingness plans to raise money through follow-on or convertible offerings. to participate in new issues. However, 2009 ended with a challenging new issue environment Instead, with a relatively benign beginning to the year and as more IPOs were postponed than priced in December. This led a strong finish to the quarter, mutual and hedge funds found issuers and their advisors to be somewhat conservative going themselves in much more stable positions than expected. into 2010. 2009 – Q1 2010 TMT SNAPSHOT 2009 ECONOMIC RECOVERY IN EQUITIES HAS CONTINUED IN Q1 2010 Percent 190 170 S&P 500 Index 150 NASDAQ Composite Index S&P 500 Internet Software & Services 130 S&P 500 Computers & Peripherals 110 Philadelphia Semiconductor Index 90 S&P 500 Diversified Telecommunication Services 70 50 1/2/2009 2/2/2009 3/2/2009 4/2/2009 5/2/2009 6/2/2009 7/2/2009 8/2/2009 9/2/2009 10/2/2009 11/2/2009 12/2/2009 1/2/2010 2/2/2010 3/2/2010 4/2/2010 Source: Capital IQ Jefferies TMT Equity Capital Markets Update | APRIL 2010 1
  • 3.
    First Quarter Reviewand 2010 Outlook In addition, proceeds that many asset managers received as part MONTHLY US EQUITY MUTUAL FUND FLOWS of cash M&A deals that closed in Q1 gave them additional capital to re-invest in the market and/or additional cushion in the case of $ in Billions redemptions or capital calls. 15 $13.9 12 $11.6 New Issue Trends 9 $7.3 If there was one pattern witnessed in the first quarter related 6 $4.9 to new issuance, it was the reminder of how quickly windows $3.7 for new issuance can open and shut. Companies that were 3 $0.2 $0.7 unfortunate enough to be on the road during negative macro 0 economic news releases suffered either the inability to price an ($1.2) -3 ($2.3) offering or were forced to do it on terms that were less favorable ($3.7) as compared to the launch of their roadshow. -6 ($6.3) -9 ($7.9) IPO Market Apr May June Jul Aug Sep Oct Nov Dec Jan Feb Mar 2009 2010 The IPO market started 2010 somewhat tamely due to many issuers waiting for year-end results and audits. The first TMT Source: Ipreo company to hit the market in Q1 was Quinstreet, a online local advertising business. Due to a market that traded down during oversubscribed. Equally as important, all of these IPOs have the roadshow, the offering was priced below the range but has traded up well in the aftermarket. since traded up nicely since issue. Also of interest, on several of these transactions, investors were The market then took a break until early March when five TMT willing to look to 2011 projections when valuing these businesses IPOs launched. Interestingly the offerings came across many – a point earlier in the calendar year than we have seen in almost different TMT sectors including communications equipment, a decade. semiconductors, and software, and were all priced within two Another lesson learned from these offerings is that while growth weeks. All five transactions priced well, with two pricing above remains important to investors, it is not the key driver in attaining their ranges and the other three pricing at the high ends. Also a successful offering and valuation. Investors remain generally interestingly, the sizes of these offerings were relatively low, focused on profitability and revenue growth of around 20% marked at the smallest end by Calix (launched at $76mm), (which is now considered “growth” in the post-2007 era). That Meru Networks (launched at $61.4mm) and MaxLinear said, we did see several transactions, including Calix and Meru, (launched at $65mm). Importantly, despite the varying – that priced off of a combination of EV/revenues and PE multiples, and in some cases small – deal sizes, the appetite for these the first time a TMT IPO has priced off of a revenue multiple in offerings was strong with every offering receiving a “who’s who” almost three years. of investors on the roadshow and ending up many times TMT M&A DEALS CLOSED DURING Q1 2010 DATE CLOSED ACQUIROR TARGET SECTOR DEAL VALUE ($MM) 02/08/10 Xerox Affiliated Computer Services Services 8,374.2 01/27/10 Oracle Sun Microsystems Comp Equipment 7,305.2 02/26/10 Investor Group IMS Health HCIT 4,038.0 02/18/10 KDDI Liberty Global-Subsidiaries Telecom Services 4,000.0 02/08/10 Windstream NuVox Communications Telecom Services 643.0 TMT M&A DEALS ANNOUNCED DURING Q1 2010 DATE ANNOUNCED ACQUIROR TARGET SECTOR DEAL VALUE ($MM) 03/02/10 Elliott Associates LP Novell Software 1,883.8 03/05/10 ABRY Partners LLC RCN Telecom Services 1,273.0 03/29/10 Avnet Bell Microproducts Comp Equipment 568.4 02/23/10 RR Donnelley & Sons Bowne & Co Media 467.1 03/08/10 CCMP Capital Advisors infoGroup Media 463.2 Source: Thomson Reuters Jefferies TMT Equity Capital Markets Update | APRIL 2010 2
  • 4.
    First Quarter Reviewand 2010 Outlook Issuers and investors are now looking to see what the next TMT CURRENT TMT IPO BACKLOG offering could be and while there are several that seem to be through the SEC clearance process, it is unclear which company FILING AMT. FILED DATE ISSUER SECTOR ($MM) will come to market first in Q2. It does appear that despite the recent willingness of investors to look to 2011 projections, that 03/31/10 Alpha and Omega Semiconductors 91.1 some companies want a little more certainty that they’ll get 03/26/10 Envestnet Software 100.0 credit for 2011 projections and thus are waiting for the late 03/26/10 SciQuest Software 75.0 April / early May time-period before tapping the markets. 03/18/10 Telx Telecom Services 100.0 In the mean time, the IPO pipeline continues to build. 03/18/10 IronPlanet Internet 92.0 Currently, there are 33 TMT companies publicly filed for IPOs 03/15/10 MagnaChip Semiconductor Semiconductors 250.0 with another six to eight on file confidentially. In total this represents almost 40% of the roughly 90 IPOs that are 03/15/10 BroadSoft Comm Tech 103.5 currently filed. 03/10/10 Eyeblaster New Media 115.0 Importantly, we expect this number to grow substantially in 03/02/10 Force10 Networks Comm Tech 143.8 the next four to six weeks, with between seven and ten new 02/26/10 Green Dot Services 150.0 companies in the TMT space getting on file. With many 02/22/10 Reply! New Media 60.0 companies waiting for up to a month before going public, it 02/10/10 GameFly New Media 50.0 could mean a total IPO backlog for TMT (including confidential 02/08/10 Wave2Wave Communications Telecom Services 94.9 filers) of close to 45 companies by the end of April. 01/28/10 GlassHouse Technologies Services 75.0 One characteristic of the current pipeline is the presence of 01/25/10 Convio Software 57.5 smaller companies. In some cases, these are companies that are aware that the market windows are opening and shutting more 01/22/10 Motricity Comm Tech 250.0 quickly than ever before. Subsequently, they are getting process 01/22/10 Everyday Health Internet 100.0 on file, with the belief that by the time they are through the 01/05/10 DynaVox HCIT 125.0 SEC they will be at a valuation threshold (roughly $200mm) 12/22/09 ReachLocal New Media 100.0 that will be attractive to small-cap growth investors. 12/22/09 Mitel Networks Comm Tech 230.0 12/07/09 Language Line Services Services 400.0 CURRENT TMT IPO BACKLOG (BY SECTOR) 12/03/09 SPS Commerce Software 46.0 11/23/09 Telegent Systems Semiconductors 250.0 Other – 6.1% Services – 18.2% 11/20/09 Fabrinet Semiconductors 150.0 New Media – 12.1% 10/30/09 TeleNav Comm Tech 75.0 10/14/09 BJB Career Education Internet 100.0 10/02/09 West Services 500.0 Semiconductors – 12.1% Software – 12.1% 09/29/09 Accretive Health HCIT 200.0 09/28/09 Newegg Internet 175.0 01/10/08 Intelius Services 143.8 Telecom Services – 9.1% Internet – 12.1% 11/30/07 Broadview Networks Telecom Services 250.0 Computer Equipment – 3% 08/08/07 BancTec Services 70.9 Comm Tech – 15.2% 07/27/07 Intcomex Comp Equipment 125.0 Source: Dealogic Source: Dealogic TMT IPOs PRICED Q1 2010 PRICING DEAL VALUE % OF PRICING RELATIVE RETURN TO DATE ISSUER SECTOR ($MM) COMPANY SOLD % SEC SHRS TO MIDPOINT Q1 END 3/30/10 Meru Networks Comm Tech 75.7 33.9% 18.5% In Range 27.8% 3/30/10 SS&C Technologies Software 160.9 15.5% 23.3% In Range 0.5% 3/23/10 MaxLinear Semiconductors 103.7 24.4% 20.1% Above 27.0% 3/23/10 Calix Comm Tech 82.3 17.4% 34.2% In Range 3.5% 3/15/10 Financial Engines Services 146.3 31.5% 44.6% Above 40.8% 2/10/10 QuinStreet New Media 150.0 22.3% 0.0% Below 13.4% Source: Dealogic Jefferies TMT Equity Capital Markets Update | APRIL 2010 3
  • 5.
    First Quarter Reviewand 2010 Outlook It is worth noting that as M&A activity continues to grow, some On the convertible front, activity has also increased. Starting the of the current TMT IPO backlog may be taken out through year with Salesforce.com’s notable offering, the pace has remained acquisitions. In fact, in many ways the rebound in strength of the relatively constant with approximately two TMT convertible M&A market has acted as a strong catalyst for successful IPOs as offerings per month. Terms have remained relatively strong strategics and private equity firms are now in competition with given the dearth of TMT convertibles priced in the past the public equity markets for attractive private TMT companies. 18 months and the recent redemptions or tenders of outstanding As long as the credit markets remain open, this is a trend that TMT convertibles. we expect to continue. We strongly believe that TMT convertible issuance will be a part Follow-on and Convertible Markets of the market to grow substantially for the balance of the year. The TMT follow-on and convertible markets have similarly picked Structured equity up, with a variety of sectors represented and uses of proceeds. The structured equity product – registered directs, PIPEs, etc – In the first quarter, 11 TMT companies raised capital or sold stock has been relatively light in TMT, due mostly to the comments through follow-ons. With the pickup of valuations, we are seeing above about the willingness of both issuers and investors an increasing level of secondary selling on the offering, with 36% to accept the more traditional norms of raising capital in the of all TMT transactions having 45% or more secondary. Intended public marketplace. use of proceeds have become increasingly generic, with many companies using stronger markets and attractive M&A valuations That said, there have been a few transactions to price and the to bulk up war chests to expand their businesses. terms have been relatively compelling given the environments in which they were priced. Importantly, in the follow-on market, the trend has been increasingly toward publicly marketed deals, as opposed to last In conclusion, we believe that the market tone is very favorable year in which many deals were done under a wall-crossed/ toward equity activity and there remains a strong near term accelerated marketing approach. The receptivity to these more demand from the buyside for equity stories. We encourage public “traditional” structures has been strong, with publicly marketed companies to take advantage of this open window and for those follow-ons trading down 3.3% from launch to pricing compared with IPO aspirations to consult their advisors about the potential to the wall-crossed/accelerated follow-ons trading down 7.3%. public exit for their private companies. The positive news is that in both scenarios the discounts have As always, please feel free to contact us if you would like to come in substantially from last year’s 10-12% all-in discount range. discuss any of these topics further. TMT FOLLOW-ONS PRICED Q1 2010 PRICING DEAL VALUE % CHANGE RETURN TO DATE ISSUER SECTOR TYPE ($MM) % SEC SHRS FILE TO OFFER Q1 END 3/30/10 Cardtronics Services Fully Marketed 84.0 100.0% 19.5% 4.8% 3/25/10 NetLogic Microsystems Semiconductors Accelerated 195.4 46.0% -4.9% 2.0% 3/25/10 ViaSat Satellite Fully Marketed 231.2 55.0% -3.3% 3.3% 3/18/10 Genpact Services Fully Marketed 579.6 100.0% -6.1% 11.8% 3/17/10 Finisar Comm Tech Accelerated 139.1 0.0% -5.5% 11.8% 3/4/10 Conexant Systems Semiconductors Accelerated 64.4 0.0% -18.2% -15.0% 3/3/10 Ctrip.com International Internet Accelerated 236.0 0.0% -5.1% 8.9% 3/2/10 LTX-Credence Semiconductors Accelerated 50.8 0.0% -7.5% 5.6% 2/4/10 Art Technology Group Software Fully Marketed 100.6 0.0% -21.9% 26.0% 1/27/10 Avago Technologies Semiconductors Fully Marketed 500.5 100.0% -4.6% 18.1% 1/21/10 KIT Digital Internet Accelerated 35.0 0.0% -2.8% 22.7% Source: Dealogic TMT CONVERTIBLES PRICED Q1 2010 PRICING DATE ISSUER SECTOR DEAL VALUE ($MM) COUPON PREMIUM 03/30/10 Concur Technologies Software 250.0 2.50% 25.0% 03/11/10 Rovi Software 460.0 2.63% 28.0% 03/08/10 Ciena Comm Tech 375.0 4.00% 35.0% 03/04/10 Priceline.com Internet 575.0 1.25% 30.0% 02/24/10 CSG Systems International Services 150.0 3.00% 25.0% 01/12/10 Salesforce.com Software 575.0 0.75% 25.0% Source: Dealogic Jefferies TMT Equity Capital Markets Update | APRIL 2010 4
  • 6.
    About Jefferies Jefferies, amajor global securities and investment banking firm, has served companies and their investors for more than 45 years. Headquartered in New York City, with offices in more than 25 cities around the world, Jefferies provides clients with capital markets and financial advisory services, institutional brokerage, securities research and asset management. The firm provides investors with fundamental research and trade execution in equity, equity-linked, and fixed income securities, including corporate bonds, high yield bonds, US government and agency securities, repo finance, mortgage- and asset-backed securities, municipal bonds, whole loans and emerging markets debt, as well as commodities and derivatives. Jefferies offers companies capital markets, merger and acquisition, restructuring and other financial advisory services. Jefferies & Company, Inc. is the principal operating subsidiary of Jefferies Group, Inc. (NYSE: JEF; www.jefferies.com). Jefferies International Limited, a UK-incorporated, wholly owned subsidiary of Jefferies Group, Inc., is authorized and regulated by the UK Financial Services Authority. For corporate clients, the Firm is a top M&A and restructuring advisor and underwriter of high yield and equity new issues. Serving institutional investors and high net worth individuals, the Firm is a leading provider of trade execution in equity, convertible, and high yield securities and a market maker of investment grade fixed income and commodity-linked products. Jefferies also offers top-tier private client services, prime brokerage, securities lending, correspondent clearing and NYSE brokerage services. The Firm has an award-winning research practice, covering equity, high yield and convertible securities, as well as a growing asset management practice utilizing a variety of asset strategies. Jefferies was founded in the capital markets as a third-market equity trading firm and has flourished over the past five decades. The Firm’s reputation has been built on a high level of client attention and service, and the ability to execute large block trades with minimal market impact. Today, Jefferies is seen by many as the investment bank of choice for companies and their investors. A creative, hands-on approach, combined with experience, expertise and widespread relationships, distinguishes the firm. Important Disclosures This communication is being provided strictly for informational purposes only and is not intended as a recommendation or an offer or solicitation for the purchase or sale of any security referenced herein. The information upon which this material is based was obtained from sources believed to be reliable, but has not been independently verified, therefore, we do not guarantee its accuracy. Any opinion or estimates constitute our best judgment as of this date, and are subject to change without notice, and any views expressed herein may not be supported by independent analysis. Jefferies & Company, Inc. and Jefferies International Limited and their affiliates and their respective directors, officers and employees may buy or sell securities mentioned herein as agent or principal for their own account. This report was created by members of the Jefferies investment banking division of Jefferies & Company, Inc. (“Jefferies”), employing appropriate expertise, and in the belief that it is fair and not misleading. The report has not been reviewed by, or discussed with, any member of Jefferies’ research department. This report is not intended to be, and in no way constitutes a “research report”, as such term is defined in Rule 137 promulgated under the US Securities Act of 1933, as amended, nor should it be considered the same under the Conduct of Business Rules of the Financial Services Authority (“FSA”). Jefferies’ investment banking department has done, and may continue to do business with, companies included in this report. This document is a marketing communication; it is not and should not be construed as investment research. Additional Information In the UK, this material is intended for use only by persons who have professional experience in matters relating to investments falling within Articles 19(5) and 49(2)(a) to (d) of the Financial Services and Markets Act 2000 (Financial Promotion) Order 2005 (as amended), or by persons to whom it can be otherwise lawfully distributed. For Canadian investors, this material is intended for use only by professional or institutional investors. None of the investments or investment services mentioned or described herein is available to other persons or to anyone in Canada who is not a "Designated Institution" as defined by the Securities Act (Ontario). Recipients of this document in any other jurisdiction should inform themselves about and observe any applicable legal requirements in relation to the receipt of this document. Jefferies International Limited is authorized and regulated in the United Kingdom by the Financial Services Authority. Its registered office is at Vintners Place, 68 Upper Thames Street, London EC4V 3BJ; telephone +44 (0)20 7029 8000; facsimile +44 (0)20 7029 8010. Reproduction of this document without written permission of Jefferies is expressly forbidden. All logos, trademarks and service marks appearing herein are property of Jefferies & Company, Inc. Member SIPC • © 04/2010 Jefferies & Company, Inc. Jefferies & Company, Inc. 520 Madison Avenue New York, NY 10022 Jefferies.com Investment Banking Sales & Trading Research Asset Management