Investment Edge
Volume 4 Quarter 1 2011
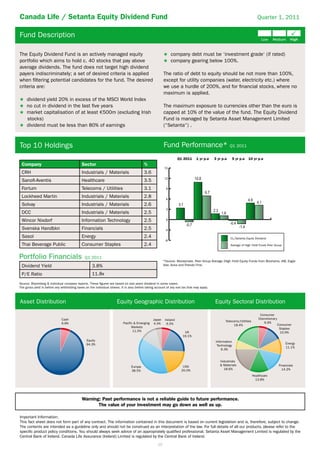
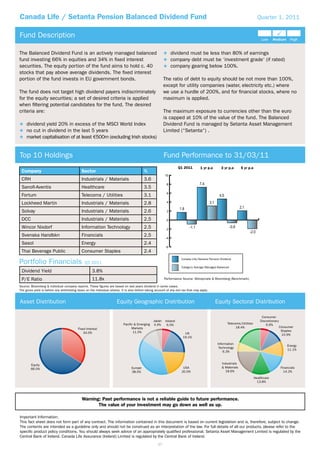
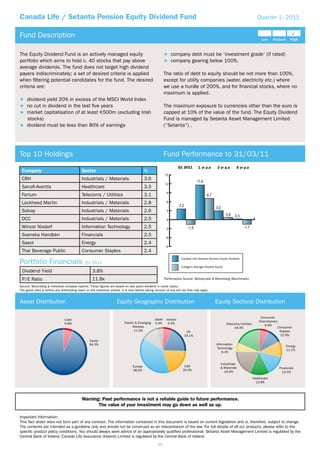
Canada Life is a leading provider of life, pensions and investments with over 100 years’
experience serving the financial planning needs of our customers in the Irish market.
We receive consistently high financial ratings from the independent rating agencies
including a AA* rating from Standard & Poor’s.

We only partner with the best investment managers to offer a broad range of choice to
Irish investors. And we are backed by strength. Our parent is Great-West Life, one of the
world’s leading life assurance companies, making us one of the largest and strongest life
and pension companies operating in the Irish market today.


* The financial rating shown for the Canada Life Assurance Company is provided by Standard & Poor’s.
Standard & Poor’s is a rating agency which provides ratings on the financial strength of companies.
This information is correct at the time of going to print.
Introduction
                    Welcome to the second quarter edition of Investment Edge. The second quarter was
                    a mixed bag for markets and overall the MSCI World Index fell by 0.9% in Euro terms
                    during the period. Equity markets initially started 2011 where they had left off last year by
                    extending the rally that began last summer on the back of strong corporate earnings and
                    positive economic momentum. By late February, equities began what many commentators
                    believed was an overdue correction prompted by increasing political unrest in the
                    Middle East and rising inflation concerns. The pullback intensified following the massive
                    earthquake and tsunami in Japan in mid-March. Markets regained some ground in the
second half of March as the economic impact of the earthquake in Japan was not expected to have a
significant effect on global growth and there was some further positive US economic data.
Developed equity markets broadly outperformed emerging equity markets; however, that trend began to
reverse late in the quarter. Sector performance varied throughout the quarter and finished with energy being
the only sector to produce a gain during the quarter benefiting from robust demand and tensions in the
Middle East.
At home another round of stress tests of Irish banks commissioned by the Central Bank of Ireland revealed
new capital requirements of €24 billion, and led to the new government following up with plans to restructure
the industry including plans to merge AIB with EBS and to have 2 main banking pillars. The government also
changed their pre election stance on their intention to impose losses on bank senior bondholders, providing
some respite for financial institutions and investors that hold the debt. The total cost of the bank bailout to
date is estimated to be €70 billion.
European markets performed well during the quarter and despite the recent downgrades of debt in Ireland,
Portugal and Spain, equity markets in peripheral Europe out-performed the broader European index. Out-
performance was driven by the unexpected progress made by eurozone leaders in addressing the structure
of bailout mechanisms and repayment conditions of existing loans. Robust fourth-quarter earnings reports,
accommodative monetary policy and improving economic momentum drove strong performance by US equity
markets as well. Equity markets in Russia and Canada, whose economies are leveraged to higher energy
prices, also out-performed.
Japanese equities, which had been outperforming since early November on a weaker yen and an improving
economy, dropped dramatically in the days following the earthquake and tsunami. They finished the quarter
well behind the global benchmark.
As we moved into April the European Central Bank increased interest rates for the first time since July 2008
in response to an increase in eurozone inflation. The quarter percentage point interest rate hike was entirely
expected, and the focus has now shifted to discerning what the bank’s next move will be.
While some form of correction has been expected as markets have now increased by over 70% since the
trough of March 2009 conditions still seem relatively positive for equity markets. However, there are some
risks to this favourable environment including an escalation of Middle East tensions that forces oil prices
higher, a policy error by central banks in increasing interest rates too quickly, the end of quantitative easing
in June and its impact on the US economy and a hard economic landing in emerging economies.
In the Spotlight section of this issue we focus on the importance of dividends as a major component of stock
returns to long term investors. We highlight our successful Canada Life/ Setanta Dividend Fund which follows
a value investing philosophy and looks for companies paying above average dividends. The case for dividend
based investing is a strong one and dividend payouts are expected to increase this year as many companies
distribute more of their surplus cash from improving earnings.


Michael Hayes
Investment Development Manager


                  Warning: Past performance is not a reliable guide to future performance.
                         The value of your investment may go down as well as up.

               Canada Life Assurance (Ireland) Limited and The Canada Life Assurance Company are regulated by the Central Bank of Ireland.
                                             This quarterly publication is intended for Financial Advisors only.
Index

Market Commentary                         4

Spotlight - The importance of dividends   6

Fund Fact Sheets                          9
Life Investment Funds                     9
Pension Funds                             35

Fund Performance                          62

Our Investment Partners                   64
Market Commentary Q1 2011
Financial markets in the first quarter were buffeted by a couple of the destabilising ‘known unknowns’: the tragic natural
disaster in Japan and the wave of political unrest/change sweeping across the Arab world. These macro uncertainties
proved enough to all but stifle, but not significantly reverse, the strong flow into ‘risk’ assets such as equities which has
characterised investor behaviour for much of the last two years. The MSCI Developed World index returned -0.9% for the
quarter.
Fuelled by the exceptionally easy stance of official monetary policy, the surge in global stock markets since the trough of
March 2009 has now extended to 71% (in Euro terms).
While there has certainly been a strong economic and consequent earnings recovery over this period, some pause to reflect
on what this substantial rally in stock prices means for current valuation levels seems timely. After all, for value investors
such as us owning/buying the stock of a company with, for example, the MSCI World Equity Index at a price 1334.9 today
is a very different value proposition from owning/buying that stock at the trough price level of 697.5 in March 2009.
In broad terms, valuation is now somewhat above long-term ‘fair value’ – though still well below the extreme levels scaled
at the height of the technology boom in 2000 or prior to the great crash in 1929.
As stock prices rally, it is becoming more difficult to buy stocks at prices below our estimation of their intrinsic worth. I
hasten to add, that this should in no way be taken as suggesting that we are making any forecast on the direction of stock
prices more generally. We are merely highlighting that as we analyse our stock opportunities on a case by case basis to
arrive at a sensible appraisal of their value, the sharp appreciation of stock prices over the last two years is now making
value more difficult to find.
European Government bonds lagged most assets over the quarter. The BofA ML Sovereign 5Yr+ index returned
-1.4% during the quarter. Despite political upheaval in the Middle East & North Africa and the natural disasters in
Japan, investors continued to allocate to riskier assets. Consensus points to global growth remaining strong over
the year, with liquidity deemed ample and offering some comfort to investors. Within Europe, the sovereign debt
crisis continues. However, there are signs of some containment as Spanish and Italian bond spreads narrowed
to core Europe. Portugal is expected to enter a bailout scenario, with many hopeful this is the line in the sand.
Ireland continues to try and get a handle on the socialisation of the banking crisis, with some signs of foreign
sentiment changing towards our pariah status (S&P rating lowered, but now stable outlook).
The Euro strengthened by approx. 6% against the USD during the quarter, from 1.34 to 1.42.
The best performing region over the period (in euro terms) was MSCI Europe ex UK (+1.9%). Japanese equities fell
by approx. 15% when the Earthquake and Tsunami hit in mid March, and although stocks did recover, the return for
the quarter was still negative (-10.1%).
The best performing global industrial sector was clearly energy, unsurprising given the rising oil price. The weakest
sector over the quarter was consumer staples.
Brent Oil continued to rise during the quarter reaching $118/bbl by end March – the highest level since October
2008. Growth in manufacturing together with the cold weather in Europe and the US helped to increase demand
in 2010. However, political upheaval in North Africa and the Middle East drove the price above $100/bbl in 2011.
The DJ UBS Spot Commodity index rose by 5.1% during the last quarter, bringing the gains for the year to 17.0%


MSCI World Q1. 2011


Source: MSCI Net Total Returns (in €) 01.01.11 – 31.03.11

                                                            4
Asset Class Returns Q1. 2011
           Global Equities      Euro Bonds             Property       Euro Cash
  %
  3

  2

  1
                                                                        0.3%
  0

  -1                                                   -0.7%
              -0.9%
  -2                              -1.4%

  -3


Source: MSCI World, Merrill Lynch (EMU +5yrs), Average Property Fund Mercer
Survey, 3 Month Interbank Deposit (all in €) 01.01.11 – 31.03.11


Regional Returns Q1. 2011


   %
  15

  10

   5                                         1.9%
                                                            0.0%                                         0.6%
   0

   -5                        -1.9%
              -0.9%                                                                     -2.9%
  -10
                                                                        -10.1%
  -15

            MSCI World         UK         Europe ex UK        USA         Japan         Pacific ex        Ireland
              Index                                                                       Japan


Source: MSCI Regional Indices Total Return, ISEQ, (in €), 01.01.11 – 31.03.11


Sector Returns Q1. 2011


       %
       9                                                                                             7.6%
       6

       3

       0
              -1.2%                       -1.1%                                    -0.7%
   -3                                                                                                               -1.6%
                             -3.3%                                   -3.2%
   -6                                                    -4.0%

   -9
             Financials    Consumer       Healthcare     Consumer   Information   Industrials &      Energy     Telecoms /
                          Discretionary                   Staple    Technology      Materials                     Utilities


Source: MSCI Global Sector Performances Total Return (in €), 01.01.11 – 31.03.11


                                                                                   5
Spotlight - The importance of dividends
By Michael Hayes, Investment Development Manager, Canada Life

2010 was another good year for investors with many major markets recording significant gains to
Albert Einstein once said of compound interest that ‘It is the greatest mathematical discovery of all
time’. While the veracity of this statement has long been questioned there can be no doubt about
the importance of dividends as a percentage of overall equity returns. The same logic attributed to
compound interest also applies to the reinvestment of dividends.
In a recent research study ‘The quest for yield’ (2011) by Elroy Dimson, Paul Marsh and Roy Staunton
of the London Business School, the role of dividends is examined in some detail. In the study, $1
invested in 1900 in US equities grew in capital value to $217 by the end of 2010 for an annualised
gain of 5%. However, according to the study if dividends had been reinvested in US equities, $1 would
have been worth $21,766 or an annualised return of 9.4%. Thus, reinvesting income can lead to a
return 100 times larger than the return from capital gains alone. This is not specific just to the US but
is true for all equity markets researched in the study. The study also demonstrates that the longer the
investment horizon, the more important is dividend income as ‘for the seriously long term investor, the
value of a portfolio corresponds closely to the present value of dividends’.
As well as the importance of dividends as a percentage of overall return the study found that high
yielding stocks also out-performed lower yielding stocks. The study broke down data in respect of
US returns from 1927 into US stocks that rank each year in the highest or lowest yielding 30% of
dividend paying-companies, the middle 40% and stocks that pay no dividends at all. Non-dividend
paying stocks gave the lowest total return of 8.4% per year, while low-yield stocks returned 9.1% and
high yielders gave the best return at 11.2%.
The longest data timeline provided in the study of the yield effect was done in the UK and goes back
to 1900. In the study, the 100 largest UK stocks are ranked by their dividend yield and divided 50:50
into higher and lower yielding stocks. The capitalisation weighted returns on those two portfolios
are calculated over the following year and that process is repeated every year. The results show that
an investment of £1 in 1900 would have grown to £5,122 in the lower yielding strategy by the end
of 2010, an annualised return of 8%. However, the same initial investment allocated to high yield
stocks would have grown to £100,160 which is almost 20 times greater and equivalent to an annual
return of 10.9% per year. As before, the study found that same effect has been evident in every other
country reviewed except New Zealand which is a small market.
According to the study the same results applied when different countries were compared to each
other based on dividend yield. At the start of each year 19 countries were ranked by their dividend
yield at the old year end. The countries were assigned to quintiles each one made of four countries
with the middle quintile containing three markets. Each portfolio had an equal amount invested in
each country and all income was reinvested. Portfolios were held for one year and the 19 countries
were then re-ranked and the portfolios were rebalanced and this was repeated each year. The results
found that over the full 111 years from 1900 an investment of $1 in the lowest yielding countries
would have grown to $370 by the end of 2010, a return of 5.5%. But the same initial investment
allocated to the highest yielding countries vastly out-performed as it would have grown to an end 2010
value of more than $1 million, some 2700 times as much or a return of 13.4% per annum.
The study also looked at four sub-periods of 25 years each and the first 10 years of the 21st
century with high yielding stocks out-performing every time. While this strategy would have required
a disciplined rebalancing regime, it does highlight the yield effect. The study also found that higher
yielding strategies not only had higher returns but also at lower levels of risk.


                                                   6
The Canada Life/ Setanta Dividend Fund

The Canada Life/Setanta Dividend Fund is an actively managed equity portfolio which invests in
stocks that have paid above average dividends since 2003.
Setanta Asset Management Limited (‘Setanta’), Canada Life’s primary investment manager follows
a value investing philosophy. The Canada Life/ Setanta Dividend Fund (the ‘Fund’) distils this
philosophy, placing particular emphasis on the significant proportion of cumulative total return that
dividends typically represent.
High yield investment fits neatly with Setanta’s value philosophy for a number of reasons. A high
dividend yield is generally considered to be a classical indicator of value and typically corresponds
to other respected value metrics. That said, a high dividend yield alone is not enough for a stock to
merit consideration for investment. In addition the stock must trade below Setanta’s assessment of
intrinsic value and the company will ideally exhibit strong competitive advantages. Setanta believes
that a strong balance sheet, a central tenet of value investing, is important for a company that aspires
to pay a sustainable and upwardly-trending dividend. Cash flow should closely reflect accounting
earnings, indicating that profits are real and not reflective of an accountant’s vivid imagination. Robust
cash flows typically ensure that a dividend is well covered and a company’s payout viable. These
factors help to protect an investment during the difficult times a company inevitably encounters,
through an economic cycle. They also ensure that the Fund, in accordance with value investing
principles, emphasises a high probability of long-term capital preservation.
Setanta takes a common sense approach to risk so that investment decisions are based on the
characteristics of each stock. By design, the Fund is well diversified, holding 45 stocks across
nineteen countries and five continents. Stocks are currently drawn from ten broad economic sectors,
while no stock has a greater weight than 5% of the fund.
Sector concentration is a function of the value opportunities available, subject to reasonable
diversification. Although subject to change, the largest sector is telecoms which currently represents
15% of the fund. Upon investment the fund managers typically expect to hold a stock for 4-5 years,
but are not bound to a maximum holding period. Setanta pays no heed to classical ‘risk’ metrics and
agree with Warren Buffett, who said: “The risk that matters is not beta or volatility, but the possibility
of loss or injury from an investment.”
The rationale for dividend based investing is clear and dividend payouts are expected to increase this
year as many companies distribute more of their surplus cash from improved earnings.
Dividends have historically contributed the majority of overall returns and to date there is no historical
evidence that this will change in the future. Dividends are the foundations on which long term equity
returns are built.

For more information on Canada Life’s fund performance, please visit www.canadalife.ie

             Warning: The value of your investment may go down as well as up.
              Past performance is not a reliable guide to future performance.
The Canada Life Assurance Company and Canada Life Assurance (Ireland) Limited are regulated by the Central Bank of Ireland.

This article does not constitute advice or an advertisement and does not form part of any contract.


                                                              7
8
Life Funds


9
Canada Life / Setanta Equity Dividend Fund                                                                                                                                  Quarter 1, 2011


Fund Description

The Equity Dividend Fund is an actively managed equity                                                          company debt must be ‘investment grade‘ (if rated)
portfolio which aims to hold c. 40 stocks that pay above                                                        company gearing below 100%.
average dividends. The fund does not target high dividend
payers indiscriminately; a set of desired criteria is applied                                             The ratio of debt to equity should be not more than 100%,
when filtering potential candidates for the fund. The desired                                              except for utility companies (water, electricity etc.) where
criteria are:                                                                                             we use a hurdle of 200%, and for financial stocks, where no
                                                                                                          maximum is applied.
     dividend yield 20% in excess of the MSCI World Index
     no cut in dividend in the last five years                                                             The maximum exposure to currencies other than the euro is
     market capitalisation of at least 500m (excluding Irish                                              capped at 10% of the value of the fund. The Equity Dividend
     stocks)                                                                                              Fund is managed by Setanta Asset Management Limited
     dividend must be less than 80% of earnings                                                           (“Setanta“) .


Top 10 Holdings                                                                                           Fund Performance* Q1 2011
                                                                                                                     Q1 2011     1 yr p.a    3 yr p.a    5 yr p.a    10 yr p.a
 Company                                     Sector                                        %
                                                                                                          15
 CRH                                         Industrials / Materials                       3.6
                                                                                                          12
 Sanofi-Aventis                               Healthcare                                    3.5
 Fortum                                      Telecoms / Utilities                          3.1              9

 Lockheed Martin                             Industrials / Materials                       2.8              6
 Solvay                                      Industrials / Materials                       2.6
                                                                                                            3
 DCC                                         Industrials / Materials                       2.5
 Wincor Nixdorf                              Information Technology                        2.5              0

 Svenska Handbkn                             Financials                                    2.5             -3
 Sasol                                       Energy                                        2.4                                                          CL/Setanta Equity Dividend
                                                                                                           -6
 Thai Beverage Public                        Consumer Staples                              2.4                                                          Average of High Yield Funds Peer Group


Portfolio Financials                           Q1 2011
                                                                                                          *Source: Moneymate. Peer Group Average (High Yield Equity Funds from Bloxhams, AIB, Eagle
 Dividend Yield                                      3.8%                                                 Star, Aviva and Friends First.

 P/E Ratio                                           11.8x
Source: Bloomberg & individual company reports. These figures are based on last years dividend in some cases.
The gross yield is before any withholding taxes on the individual shares. It is also before taking account of any exit tax that may apply.


Asset Distribution                                                     Equity Geographic Distribution                                        Equity Sectoral Distribution

                                                                                                                                                                              Consumer
                              Cash                                                               Japan     Ireland                                                           Discretionary
                                                                                                                                                    Telecoms/Utilities           6.6%
                              6.8%                                          Pacific & Emerging   4.4%       6.5%                                                                             Consumer
                                                                                                                                                          18.4%
                                                                                  Markets                                                                                                     Staples
                                                                                   11.5%                                UK                                                                    10.9%
                                                                                                                       19.1%
                                                 Equity                                                                                       Information
                                                 94.3%                                                                                                                                           Energy
                                                                                                                                               Technology
                                                                                                                                                                                                 11.1%
                                                                                                                                                  6.3%


                                                                                                                                                Industrials
                                                                                                                       USA                      & Materials                                  Financials
                                                                                 Europe
                                                                                                                      20.0%                       18.6%                                        14.2%
                                                                                 38.5%
                                                                                                                                                                         Healthcare
                                                                                                                                                                           13.8%


                                             Warning: Past performance is not a reliable guide to future performance.
                                                    The value of your investment may go down as well as up.

Important Information:
This fact sheet does not form part of any contract. The information contained in this document is based on current legislation and is, therefore, subject to change.
The contents are intended as a guideline only and should not be construed as an interpretation of the law. For full details of all our products, please refer to the
specific product policy conditions. You should always seek advice of an appropriately qualified professional. Setanta Asset Management Limited is regulated by the
Central Bank of Ireland. Canada Life Assurance (Ireland) Limited is regulated by the Central Bank of Ireland.
                                                                                                     10
Canada Life / Setanta Balanced Fund                                                                                                                       Quarter 1, 2011


Fund Description

The investment objective of the Balanced Fund is to secure                              picked within a global sector framework, with an emphasis
long-term capital growth. The fund seeks to achieve its                                 on the following key characteristics:
objective by investing primarily in a range of Irish and
international equities and bonds. The asset distribution of                                   superior financial track record
this fund is more conservative than a managed fund, having                                    competitive advantage and a sustainable business model
a lower proportion of its assets invested in equities; the                                    within their industry
target equity content is less than 50%.                                                       focused on profitability and can demonstrate an ability to
                                                                                              earn cash flow returns in excess of their cost of capital
The fund is managed by Setanta Asset Management Limited                                       over the business cycle
(“Setanta“). Setanta is a value investor in quality companies                                 do not carry excessive debt levels.
and builds the portfolio from the bottom up. Stocks are


Top 10 Holdings                                                                         Fund Performance to 31/03/11
                                                                                                   Q1 2011     1 yr p.a    3 yr p.a     5 yr p.a   10 yr p.a
 Company                              Sector                             %              %

 Exxon Mobil                          Energy                             2.4             6

                                                                                         5
 Pfizer                                Healthcare                         2.0
                                                                                         4
 General Dynamics                     Industrials & Materials            2.0
                                                                                         3
 CRH                                  Industrials & Materials            2.0
                                                                                         2
 Total                                Energy                             1.9
                                                                                         1
 Johnson & Johnson                    Healthcare                         1.7             0
 ENI                                  Energy                             1.7            -1

 Owens Illinois New                   Industrials & Materials            1.7            -2

 BP                                   Energy                             1.7            -3

 DCC                                  Industrials & Materials            1.7            -4


                                                                                                    Canada Life/Setanta Balanced

                                                                                                    Category Average Managed Balanced


                                                                                             Source: Moneymate. Performance is net of management fees.


Asset Distribution                                       Equity Geographic Distribution                                     Equity Sectoral Asset Distribution

                                                                                                                                           Telecoms/Utilities Consumer
                      Cash                                                      Japan    Ireland                                                 7.9%        Discretionary
                      0.6% Property                          Pacific & Emerging 6.1%      5.8%      UK                                                           9.9%
                             7.4%                                                                  10.2%                           Information
                                                                   Markets                                                                                                 Consumer
                                                                     7.6%                                                          Technology                               Staples
                                                                                                                                      12.4%                                 10.9%

Equity
47.2%                                                          Europe
                                                               21.0%                                                           Industrials                                    Energy
                                                                                                                               & Materials                                    15.5%
                                        Fixed Interest                                                                           16.6%
                                            44.7%
                                                                                                        USA
                                                                                                       49.4%
                                                                                                                                             Healthcare          Financials
                                                                                                                                               12.8%               14.1%


                                      Warning: Past performance is not a reliable guide to future performance.
                                             The value of your investment may go down as well as up.

Important Information:
This fact sheet does not form part of any contract. The information contained in this document is based on current legislation and is, therefore, subject to change.
The contents are intended as a guideline only and should not be construed as an interpretation of the law. For full details of all our products, please refer to the
specific product policy conditions. You should always seek advice of an appropriately qualified professional. Setanta Asset Management Limited is regulated by the
Central Bank of Ireland. Canada Life Assurance (Ireland) Limited is regulated by the Central Bank of Ireland.
                                                                                 11
Canada Life / Setanta Balanced Dividend Fund                                                                                                                   Quarter 1, 2011


Fund Description

The Balanced Dividend Fund is an actively managed balanced                                     dividend must be less than 80% of earnings
fund investing 66% in equities and 34% in fixed interest                                        company debt must be ‘investment grade‘ (if rated)
securities. The equity portion of the fund aims to hold c. 40                                  company gearing below 100%.
stocks that pay above average dividends. The fixed interest
portion of the fund invests in EU government bonds.                                      The ratio of debt to equity should be not more than 100%,
                                                                                         except for utility companies (water, electricity etc.) where
The fund does not target high dividend payers indiscriminately                           we use a hurdle of 200%, and for financials stock, where no
for the equity securities; a set of desired criteria is applied                          maximum is applied.
when filtering potential candidates for the fund. The desired
criteria are:                                                                            The maximum exposure to currencies other than the euro
                                                                                         is capped at 10% of the value of the fund. The Balanced
    dividend yield 20% in excess of the MSCI World Index                                 Dividend Fund is managed by Setanta Asset Management
    no cut in dividend in the last 5 years                                               Limited (“Setanta“) .
    market capitalisation of at least 500m (excluding Irish stocks)


Top 10 Holdings                                                                          Fund Performance* Q1 2011
                                                                                          %         Q1 2011     1 yr p.a     3 yr p.a      5 yr p.a   10 yr p.a
 Company                            Sector                                %
                                                                                         10
 CRH                                Industrials / Materials               3.6
 Sanofi-Aventis                      Healthcare                            3.5              8

 Fortum                             Telecoms / Utilities                  3.1              6
 Lockheed Martin                    Industrials / Materials               2.8
                                                                                           4
 Solvay                             Industrials / Materials               2.6
                                                                                           2
 DCC                                Industrials / Materials               2.5
 Wincor Nixdorf                     Information Technology                2.5              0

 Svenska Handbkn                    Financials                            2.5
                                                                                          -2
 Sasol                              Energy                                2.4
                                                                                          -4
 Thai Beverage Public               Consumer Staples                      2.4                             CL/Setanta Bal Dividend

                                                                                                          Category Average Managed Balanced

Portfolio Financials                 Q1 2011
                                                                                         *Source: Moneymate. Peer Group Average (High Yield Equity Funds from Bloxhams, AIB, Eagle
 Dividend Yield                           3.8%                                           Star, Aviva and Friends First.
                                                                                         Source: Bloomberg & individual company reports. These figures are based on last years dividend
 P/E Ratio                                11.8x                                          in some cases. The gross yield is before any withholding taxes on the individual shares. It is also
                                                                                         before taking account of any exit tax that may apply.


Asset Distribution                                      Equity Geographic Distribution                                        Equity Sectoral Distribution

                                                                                                                                                                 Consumer
                                                                                 Japan    Ireland                                                               Discretionary
                                                            Pacific & Emerging   4.4%                                                  Telecoms/Utilities           6.6%
                                                                                           6.5%
                                                                  Markets                                                                    18.4%                              Consumer
                                                                   11.5%                                                                                                         Staples
                                                                                                        UK                                                                       10.9%
                                                                                                       19.1%
                                                                                                                               Information
                                                                                                                                                                                    Energy
                                                                                                                                Technology
                                                                                                                                                                                    11.1%
                                                                                                                                   6.3%


                                                                                                                                    Industrials
                                                                 Europe                                USA                          & Materials                                 Financials
                                                                 38.5%                                20.0%                           18.6%                                       14.2%
                                                                                                                                                            Healthcare
                                                                                                                                                              13.8%


                                    Warning: Past performance is not a reliable guide to future performance.
                                           The value of your investment may go down as well as up.

Important Information:
This fact sheet does not form part of any contract. The information contained in this document is based on current legislation and is, therefore, subject to change.
The contents are intended as a guideline only and should not be construed as an interpretation of the law. For full details of all our products, please refer to the
specific product policy conditions. You should always seek advice of an appropriately qualified professional. Setanta Asset Management Limited is regulated by the
Central Bank of Ireland. Canada Life Assurance (Ireland) Limited is regulated by the Central Bank of Ireland.
                                                                                   12
Canada Life / Setanta European Equity Fund                                                                                                                   Quarter 1, 2011


Fund Description

The investment objective of the European Equity Fund is to                                   superior financial track record
secure long-term capital growth.                                                             competitive advantage and a sustainable business model
                                                                                             within their industry
The fund seeks to achieve its objective by investing in a                                    focused on profitability and can demonstrate an ability to
range of European equities.                                                                  earn cash flow returns in excess of their cost of capital
                                                                                             over the business cycle
It is an actively managed equity portfolio which holds c. 30-                                do not carry excessive debt levels.
50 European stocks. The fund is managed by Setanta Asset
Management Limited (“Setanta“). Setanta is a value investor
in quality companies and builds the portfolio from the bottom
up. Stocks are picked within a global sector framework, with
an emphasis on the following key characteristics:


Top 10 Holdings                                                                        Fund Performance to 31/03/11
                                                                                                  Q1 2011          1 yr p.a   3 yr p.a      5 yr p.a   10 yr p.a
 Company                            Sector                                 %           %

 DCC                                Industrials/Materials                  4.9         20

 BP                                 Energy                                 4.4
                                                                                       15
 C&C Group                          Consumer Staples                       4.4
 CRH                                Industrials/Materials                  4.2
                                                                                       10
 Solvay                             Industrials/Materials                  4.0
 Axel Springer                      Consumer Discretionary                 3.9          5
 Vodafone                           Telecoms / Utilities                   3.9
 Wincor Nixdorf                     Information/Technology                 3.8          0

 Diageo                             Consumer Staples                       3.8
 Total                              Energy                                 3.8         -5


                                                                                                      Canada Life/Setanta European Equity

                                                                                                      Category Average Advanced Europe Equity


                                                                                            Source: Moneymate. Performance is net of management fees.


Asset Distribution                                      Equity Geographic Distribution                                         Equity Sectoral Distribution

                                                                              Cash                                                                            Consumer
                         Cash                                                                                                                   Telecoms/
                         1.7%                                          Greece 2.0% Belgium                                                       Utilities   Discretionary
                                                                        3.0%        7.0% Czech Republic                                                         10.0%
                                                                                                                                                  15.9%                   Consumer
                                                                                             3.0%
                                                                                                                                                                           Staples
                                                                                                       Finland
                                                                                                                                Information                                 8.3%
                                                              UK                                        9.0%
                                                                                                                                Technology
                                                             27.0%                                                                  6.0%
                                                                                                          France
                                                                                                           8.0%                                                              Energy
                                                                                                                                                                             13.4%
                                                                                                       Germany
                                                            Norway                                                               Industrials
                                                                                                        8.0%
                                                             3.0%                                                                & Materials
                                                             Switzerland                                                           16.8%
                                                                6.0%     Italy              Ireland                                                                   Financials
                Equity                                                   6.0%               18.0%                                               Healthcare              18.9%
                98.3%                                                                                                                             10.6%


                                    Warning: Past performance is not a reliable guide to future performance.
                                           The value of your investment may go down as well as up.

Important Information:
This fact sheet does not form part of any contract. The information contained in this document is based on current legislation and is, therefore, subject to change.
The contents are intended as a guideline only and should not be construed as an interpretation of the law. For full details of all our products, please refer to the
specific product policy conditions. You should always seek advice of an appropriately qualified professional. Setanta Asset Management Limited is regulated by the
Central Bank of Ireland. Canada Life Assurance (Ireland) Limited is regulated by the Central Bank of Ireland.
                                                                                  13
Canada Life / Setanta Unitised With Profits Fund                                                                                                            Quarter 1, 2011


Fund Description

The Unitised With Profits Fund (UWP) operates like a                                          At maturity a terminal bonus may be applied if the underlying
unit-linked fund, except that investment return to                                           assets have outperformed the declared bonuses.
policyholders is smoothed and guaranteed not to fall.

Returns are distributed in the form of a bonus rate declared
by Canada Life based on various factors including the
performance of the underlying assets.

Returns are smoothed to the investor in that the bonus
rate will endeavour to reflect the performance of the assets
over the long term, allowing the investor to avoid short-term
volatility in the markets.


Top 10 Holdings                                                                              Annual Bonus History

 Company                          Sector                                 %                               Year                          Life

                                                                                                                                   Gross Version                Net Version
 Exxon Mobil                      Energy                                 2.4
                                                                                                        95 – 96                          -                           -
 Pfizer                            Healthcare                             2.1
                                                                                                        96 – 97                          -                           -
 General Dynamics                 Industrials & Materials                2.0                            97 – 98                          -                           -

 CRH                              Industrials & Materials                1.9                            98 – 99                          -                         6.5%

 Total                            Energy                                 1.9                            99 – 00                          -                         6.0%

                                                                                                        00 – 01                        6.0%                        5.0%
 ENI                              Energy                                 1.8
                                                                                                        01 – 02                        6.0%                        4.5%
 Johnson & Johnson                Healthcare                             1.8
                                                                                                        02 – 03                        5.0%                        3.5%
 BP                               Energy                                 1.8                            03 – 04                        2.0%                        0.0%

 Owens Illinois New               Industrials & Materials                1.7                            04 – 05                        1.0%                        0.0%

 DCC                              Industrials & Materials                1.7                            05 – 06                        1.0%                        0.0%

                                                                                                        06 – 07                        1.0%                        0.0%

                                                                                                        07 - 08                        1.0%                        0.0%

                                                                                                        08 - 09                        0.5%                        0.0%

                                                                                                        09 - 10                        0.0%                        0.0%

                                                                                                        10 - 11                        0.0%                        0.0%

                                                                                             Bonus rates are declared net of management charges


Asset Distribution                                      Equity Geographic Distribution                                        Equity Sectoral Distribution

                                                                                Japan                                                     Telecoms/Utilities Consumer
                      Property                                                           Ireland                                                             Discretionary
               Cash                                                             6.0%                                                            7.9%
                       2.0%                                Pacific & Emerging             5.8%                                                                   9.9%
               6.2%                                                                                    UK
                                                                 Markets                              10.3%                       Information                             Consumer
                                                                   8.6%                                                           Technology                               Staples
                                                                                                                                     12.1%                                 11.0%


   Equity                                                     Europe
   36.9%                               Fixed Interest
                                                              20.4%                                                           Industrials
                                           54.9%                                                                                                                              Energy
                                                                                                                              & Materials
                                                                                                                                                                              15.8%
                                                                                                                                16.4%


                                                                                                     USA
                                                                                                                                              Healthcare
                                                                                                    48.9%                                                       Financials
                                                                                                                                                12.6%
                                                                                                                                                                  14.3%


                                    Warning: Past performance is not a reliable guide to future performance.
                                           The value of your investment may go down as well as up.

Important Information:
This fact sheet does not form part of any contract. The information contained in this document is based on current legislation and is, therefore, subject to change.
The contents are intended as a guideline only and should not be construed as an interpretation of the law. For full details of all our products, please refer to the
specific product policy conditions. You should always seek advice of an appropriately qualified professional. Setanta Asset Management Limited is regulated by the
Central Bank of Ireland. Canada Life Assurance (Ireland) Limited is regulated by the Central Bank of Ireland.
                                                                                        14
Canada Life / Setanta Focus 15 Fund                                                                                                                                 Quarter 1, 2011


Fund Description

The Focus 15 Fund is an actively managed, concentrated                                               focused on profitability and can demonstrate an ability to
equity portfolio, which holds c. 15 international (ex Ireland)                                       earn cash flow returns in excess of their cost of capital
stocks. The Focus 15 Fund is managed by Setanta Asset                                                over the business cycle
Management Limited (“Setanta“). Setanta is a value                                                   do not carry excessive debt levels.
investor in quality companies. Setanta builds the portfolio
from the bottom up, using the stocks researched by the                                          Clearly, Focus 15 is likely to be more volatile than more
sector specialists, with an emphasis on the following key                                       broadly-based funds; it is therefore only suitable for those
characteristics:                                                                                investors with experience of the stock market.

    superior financial track record
    competitive advantage and a sustainable business model
    within their industry


Fund Holdings                                                                                   Fund Performance to 31/03/11
 Company                            Sector                                           %          %        Q1 2011      1 yr p.a      3 yr p.a      5 yr p.a    10 yr p.a

 Pfizer                              Healthcare                                       9.0        15
 Sysco                              Consumer Staples                                 8.2
                                                                                                12
 Everest Re Group                   Financials                                       7.7

 Tidewater                          Energy                                           7.0         9
 Steris                             Healthcare                                       7.0
                                                                                                 6
 Johnson & Johnson                  Healthcare                                       6.9

 Total                              Energy                                           6.8         3
 MI Developments                    Financials                                       6.8
                                                                                                 0
 Astellas Pharmaceutical            Healthcare                                       6.7

 Wincor Nixdorf                     Information Technology                           6.6        -3

 NTT Docomo                         Telecoms / Utilities                             6.1
                                                                                                -6
 Motor                              Consumer Discretionary                           5.9

 Belgacom                           Telecoms / Utilities                             4.0

 Nokia                              Information Technology                           3.1                   Canada Life/Setanta Focus 15

 OPAP                               Consumer Discretionary                           2.1                   Category Average Flexible Equity

 Komori                             Industrials & materials                          1.8
                                                                                                     Source: Moneymate. Performance is net of management fees.
 Cash                                                                                4.3


Asset Distribution                                            Equity Geographic Distribution                                          Equity Sectoral Distribution

                             Cash                                                                                                                                        Consumer
                             4.3%                                                                                                                    Telecoms/Utilities Discretionary
                                                                            Japan                                                                          10.7%            8.5%
                                                                            21.5%                                                                                                    Consumer
                                                                                                                                              Information                             Staples
                                                                                                                                              Technology                               8.6%
                                                                                                                                                 10.1%

                                                                 Pacific                                                               Industrials
                                                                                                                  USA
                                                               & Emerging                                                              & Materials                                      Energy
                                                                                                                 46.7%
                                                                Markets                                                                   1.9%                                          14.4%
                                                                  8.0%


                                                                            Europe                                                             Healthcare
                                                                            23.7%                                                                30.8%                           Financials
                    Equity                                                                                                                                                         15.1%
                    95.7%


                                    Warning: Past performance is not a reliable guide to future performance.
                                           The value of your investment may go down as well as up.

Important Information:
This fact sheet does not form part of any contract. The information contained in this document is based on current legislation and is, therefore, subject to change.
The contents are intended as a guideline only and should not be construed as an interpretation of the law. For full details of all our products, please refer to the
specific product policy conditions. You should always seek advice of an appropriately qualified professional. Setanta Asset Management Limited is regulated by the
Central Bank of Ireland. Canada Life Assurance (Ireland) Limited is regulated by the Central Bank of Ireland.
                                                                                           15
Canada Life / Setanta Irish Equity Fund                                                                                                                Quarter 1, 2011


Fund Description

The Irish Equity Fund is an actively managed equity                                        focused on profitability and can demonstrate an ability to
portfolio which aims to hold stocks quoted on the Irish                                    earn cash flow returns in excess of their cost of capital
stock exchange. The fund is managed by Setanta Asset                                       over the business cycle
Management Limited (“Setanta“). Setanta is a value investor                                do not carry excessive debt levels.
in quality companies. Setanta builds the portfolio from the
bottom up, picking stocks within a sector framework, with an                         The Irish Equity Fund is a relatively concentrated equity fund
emphasis on the following key characteristics:                                       with exposure to stocks from only one country and is likely to
                                                                                     be more volatile than more broadly-based funds.
    superior financial track record
    competitive advantage and a sustainable business model
    within their industry


Top 10 Holdings                                                                      Fund Performance to 31/03/11
                                                                                                Q1 2011      1 yr p.a      3 yr p.a    5 yr p.a   10 yr p.a
 Company                            Sector                              %            %

 DCC                                Industrials & Materials             9.3          20

 Total Produce                      Consumer Staples                    8.8          15

 Irish Continental                  Industrials & Materials             8.3          10

 Kingspan                           Industrials & Materials             7.8           5

 CRH                                Industrials & Materials             7.4           0

 Abbey                              Industrials & Materials             7.3           -5

 Dragon Oil                         Energy                              6.3          -10

 Grafton Group                      Industrials & Materials             6.2          -15

                                                                                     -20
 Kerry Group                        Consumer Staples                    6.2
                                                                                     -25
 Ryanair Holdings                   Industrials & Materials             6.2


                                                                                                  Canada Life/Setanta Irish Equity

                                                                                                  Category Average Irish Equity


                                                                                           Source: Moneymate. Performance is net of management fees.


Asset Distribution                                      Equity Geographic Distribution                                     Equity Sectoral Distribution

                                                                                                                                                       Consumer
                          Cash                                                                                                                        Discretionary
                          0.1%                                                                                                                            5.8%

                                                                                                                                                                        Consumer
                                                                                                                                                                         Staples
                                                                                                                                                                         25.3%


                                                                                                                              Industrials
                                                                                                                              & Materials
                                                                                                                                57.5%                                     Energy
                                                                                                                                                                           6.3%
                                                                                                                                                                       Financials
                                                                                                                                                                          1.1%
                                                                                                                                                          Healthcare
                 Equity
                                                                                                                                                            4.0%
                 99.9%


                                    Warning: Past performance is not a reliable guide to future performance.
                                           The value of your investment may go down as well as up.

Important Information:
This fact sheet does not form part of any contract. The information contained in this document is based on current legislation and is, therefore, subject to change.
The contents are intended as a guideline only and should not be construed as an interpretation of the law. For full details of all our products, please refer to the
specific product policy conditions. You should always seek advice of an appropriately qualified professional. Setanta Asset Management Limited is regulated by the
Central Bank of Ireland. Canada Life Assurance (Ireland) Limited is regulated by the Central Bank of Ireland.
                                                                                16
Canada Life / Setanta Property Fund                                                                                                                            Quarter 1, 2011


Fund Description

This fund invests in commercial properties - office, retail and                           The Property Fund is suitable for investors who wish to gain
warehousing. The fund is characterised by the quality of the                             investment exposure to the commercial property sector.
property that makes up the portfolio and the tenants that                                Investors should understand that property investment is by
occupy these properties.                                                                 its nature less liquid than other asset classes.

Currently, all of the properties are located in Ireland.


Sample Property Holdings                                                                 Fund Performance to 31/03/11
                                                                                                    Q1 2011      1 yr p.a     3 yr p.a     5 yr p.a   10 yr p.a
 OFFICE                                                                                   %

 Block C, Earlsfort Centre                                                               15

 Tenant - Office of Public Works                                                          10

 Fund Weighting - 13.2%                                                                   5

 RETAIL                                                                                   0

 45/46 Patrick Street, Cork                                                               -5
 Tenant - C&J Clarke International
                                                                                         -10
 Fund Weighting - 3.8%
                                                                                         -15
 INDUSTRIAL/WAREHOUSE
                                                                                         -20
 Swords Business Campus
                                                                                         -25
 Tenants - Air France, Client Logic, Eastern Health Board
 Fund Weighting - 10.2%
                                                                                                       Canada Life/Setanta Property

                                                                                                       Category Average Property


                                                                                               Source: Moneymate. Performance is net of management fees.


Asset Distribution                                      Geographic Distribution                                                Sectoral Distribution

                    Cash
                    9.5%                                       Rest of Ireland
                                                                  16.5%
                                                                                                                                         Office
                                                                                                                                         27.7%
                                                                                                                                                                       Retail
                                                                                                     Dublin city centre                                                41.7%
                                                           Cork
                                                                                                           44.4%
                                                          10.3%


                                                                                                                              Cash & Bonds
                                                                                                                                  9.5%


                           Property                               Suburban Dublin                                                                 Industrial
                            90.5%                                     28.8%                                                                         21.1%


                                      Warning: Past performance is not a reliable guide to future performance.
                                             The value of your investment may go down as well as up.

Important Information:
This fact sheet does not form part of any contract. The information contained in this document is based on current legislation and is, therefore, subject to change.
The contents are intended as a guideline only and should not be construed as an interpretation of the law. For full details of all our products, please refer to the
specific product policy conditions. You should always seek advice of an appropriately qualified professional. Setanta Asset Management Limited is regulated by the
Central Bank of Ireland. Canada Life Assurance (Ireland) Limited is regulated by the Central Bank of Ireland.
                                                                                    17
Canada Life / Setanta Strategic Growth Fund                                                                                                                      Quarter 1, 2011


Fund Description

The investment objective of the Strategic Growth Fund is to                                      superior financial track record
secure long-term capital growth. The fund seeks to achieve                                       competitive advantage and a sustainable business model
its objective by investing primarily in a range of Irish and                                     within their industry
international equities and bonds. The fund will hold between                                     focused on profitability and can demonstrate an ability to
50-80% of its assets in equities with the balance consisting                                     earn cash flow returns in excess of their cost of capital
of bonds, property and cash                                                                      over the business cycle
                                                                                                 do not carry excessive debt levels.
The fund is managed by Setanta Asset Management Limited
(“Setanta“). Setanta is a value investor in quality companies.
Setanta builds the portfolio from the bottom up, picking
stocks within a global sector framework, with an emphasis
on the following key characteristics:


Top 10 Holdings                                                                            Fund Performance to 31/03/11
                                                                                                         Q1 2011     1 yr p.a     3 yr p.a     5 yr p.a   10 yr p.a
 Company                                Sector                            %                %

 Exxon                                  Mobil Energy                      1.6              6

 CRH                                    Industrials & Materials           1.5              5

 DCC                                    Industrials & Materials           1.4              4

 Pfizer                                  Healthcare                        1.4              3
 Total                                  Energy                            1.4
                                                                                           2
 General Dynamics                       Industrials & Materials           1.3
                                                                                           1
 ENI                                    Energy                            1.2
                                                                                           0
 Johnson & Johnson                      Healthcare                        1.2
                                                                                           -1
 BP                                     Energy                            1.2
 Owens Illinois                         Industrials & Materials           1.1              -2

                                                                                           -3

                                                                                                          Canada Life/Setanta Strategic Growth G

                                                                                                          Category Average Managed Dynamic


                                                                                                Source: Moneymate. Performance is net of management fees.


Asset Distribution                                      Equity Geographic Distribution                                             Equity Sectoral Distribution

                                                                                   Japan                                                          Telecoms/Utilities Consumer
                     Cash   Property                                               6.0%        Ireland                                                  7.6%        Discretionary
                                                              Pacific & Emerging
                     6.4%     2.8%                                  Markets                     9.2%                                      Information                   9.7%
       Commodities                     Fixed Interest                                                                                                                           Consumer
                                                                      7.9%                                  UK                            Technology
          2.4%                             19.4%                                                                                                                                  Staples
                                                                                                           9.9%                              11.6%
                                                                                                                                                                                  11.3%
                                                              Europe
                                                              19.9%
                                                                                                                                     Industrials
                                                                                                                                                                                    Energy
                                                                                                                                     & Materials
                                                                                                                                                                                    15.7%
                                                                                                                                       18.3%

         Equity
         69.0%
                                                                                                                                                    Healthcare         Financials
                                                                                          USA                                                         12.4%              13.5%
                                                                                         47.1%


                                        Warning: Past performance is not a reliable guide to future performance.
                                               The value of your investment may go down as well as up.

Important Information:
This fact sheet does not form part of any contract. The information contained in this document is based on current legislation and is, therefore, subject to change.
The contents are intended as a guideline only and should not be construed as an interpretation of the law. For full details of all our products, please refer to the
specific product policy conditions. You should always seek advice of an appropriately qualified professional. Setanta Asset Management Limited is regulated by the
Central Bank of Ireland. Canada Life Assurance (Ireland) Limited is regulated by the Central Bank of Ireland.
                                                                                    18
Canada Life / Setanta Global Opportunity Fund                                                                                                             Quarter 1, 2011


Fund Description

The Global Opportunity Fund is an actively managed equity                                    superior financial track record
portfolio, which holds c. 100-140 global stocks. The                                         competitive advantage and a sustainable business model
investment objective of the Global Opportunity Fund is to                                    within their industry
secure long-term capital growth by investing in a range of                                   focused on profitability and can demonstrate an ability to
Irish and international equities.                                                            earn cash flow returns in excess of their cost of capital
                                                                                             over the business cycle
The fund is managed by Setanta Asset Management Limited                                      do not carry excessive debt levels.
(“Setanta“). The fund is the cornerstone of Setanta‘s
investment process. Setanta is a value investor in quality
companies and builds the portfolio from the bottom up.
Stocks are picked within a global sector framework, with an
emphasis on the following key characteristics:


Top 10 Holdings                                                                         Fund Performance to 31/03/11
                                                                                                  Q1 2011     1 yr p.a      3 yr p.a    5 yr p.a   10 yr p.a
 Company                            Sector                                %             %

 Exxon Mobil                        Energy                                2.4           10

 Pfizer                              Healthcare                            2.1            8
 General Dynamics                   Industrials & Materials               2.0
                                                                                         6
 CRH                                Industrials & Materials               1.9
                                                                                         4
 Total                              Energy                                1.9
 Johnson & Johnson                  Healthcare                            1.8            2

 ENI                                Energy                                1.7            0
 Owens Illinois                     Industrials & Materials               1.7
                                                                                        -2
 BP                                 Energy                                1.7
 DCC                                Industrials & Materials               1.7           -4


                                                                                                   Canada Life/Setanta Global Opportunity

                                                                                                   Category Average Flexible Equity


                                                                                             Source: Moneymate. Performance is net of management fees.


Asset Distribution                                      Equity Geographic Distribution                                       Equity Sectoral Distribution

                          Cash                                                  Japan   Ireland                                           Telecoms/Utilities Consumer
                          1.3%                                                                                                                  7.9%        Discretionary
                                                             Pacific & Emerging 6.1%     5.8%      UK                                                           9.9%
                                                                   Markets                        10.2%                           Information                             Consumer
                                                                     7.6%                                                         Technology                               Staples
                                                                                                                                     12.4%                                 10.9%


                                                              Europe
                                                              21.0%                                                                                                          Energy
                                                                                                                               Industrials
                                                                                                                               & Materials                                   15.5%
                                                                                                                                 16.6%
                                                                                                      USA
                                                                                                     49.4%
                 Equity                                                                                                                      Healthcare         Financials
                 98.7%                                                                                                                         12.8%              14.1%


                                    Warning: Past performance is not a reliable guide to future performance.
                                           The value of your investment may go down as well as up.

Important Information:
This fact sheet does not form part of any contract. The information contained in this document is based on current legislation and is, therefore, subject to change.
The contents are intended as a guideline only and should not be construed as an interpretation of the law. For full details of all our products, please refer to the
specific product policy conditions. You should always seek advice of an appropriately qualified professional. Setanta Asset Management Limited is regulated by the
Central Bank of Ireland. Canada Life Assurance (Ireland) Limited is regulated by the Central Bank of Ireland.
                                                                                  19
Canada Life Quadrivium Fund                                                                                                                       Quarter 1, 2011


Fund Description                                                                                       Fund Composition

The investment objective of the Canada Life Quadrivium Fund                                            The Quadrivium Fund invests in the following four asset classes:
is to secure long-term capital growth.
                                                                                                       High-Yield Equities
The fund seeks to achieve its objective by investing in four                                           The Canada Life Dividend Fund is an equity fund that
different asset classes – equities, bonds, property and                                                specifically targets stable blue chip quality companies with
commodities. By investing in Quadrivium investors can gain                                             the ability to pay consistently strong dividends.
access to a diversified portfolio invested across these four                                            The Dividend Fund is a pure equity portfolio of actively
asset classes. The fund provides exposure to international                                             managed companies with an average of 40 holdings.
shares, Irish & European commercial property, commodities
and fixed interest assets, all within one fund.                                                         Property
                                                                                                       Irish Commercial Property
                                                                                                       The Canada Life Property Fund invests in a range of
Asset Distribution                                                                                     commercial properties. The fund is currently fully invested
                                                                                                       in Irish commercial properties but will seek opportunities
                                  Fixed Interest
                                      8.1%
                                                                                                       outside Ireland where appropriate. The fund is managed by
                                                                                                       a team of property specialists at Canada Life European Real
              Commodities
                                                                                                       Estate, who have over 20 years of property experience and
                18.4%                                                                                  manage over €1.7 billion in property assets.

                                                              Dividend Fund                            European Property
                                                                  43.1%                                The Canada Life/Morgan Stanley European Property Fund
              European Property
                                                                                                       invests in a professionally managed portfolio of European
                   16.5%                                                                               property companies, and is managed by a team of property
                                         Irish Property
                                             13.9%                                                     experts at Morgan Stanley with over 40 years of collective
                                                                                                       experience of real estate markets. The fund invests in
 Asset Class                                               Current           Expected
                                                                                                       quoted European property companies through buying
                                                          Allocation          Range
                                                                                                       real estate securities. Real Estate securities are indirect
 Dividend Fund                                             43.1%           20% - 50%                   investments in property whose long-term returns depend on
 Irish Property                                            13.9%           10% - 25%                   the underlying real estate market.
 European Property                                         16.5%           10% - 25%
                                                           18.4%
                                                                                                       Commodities
 Commodities                                                                 0% - 25%
                                                                                                       The commodities allocation in the Quadrivium fund invests
 Fixed Interest                                             8.1%             0% - 25%                  in an Exchange Traded Fund (ETF) issued by ETF Securities.
                                                                                                       The ETFs All Commodities DJ-AIGCI is designed to track the
                                                                                                       Dow Jones-AIG Commodity sub-index. The Dow Jones-AIG
Fund Performance                                                                                       Commodity sub-index invests in a broadly diversified index
         Q1 2011   1 yr p.a   2 yr p.a   3 yr p.a
                                                                                                       that allows investors to track commodity futures returns
 %
                                                                                                       through a single fund. No related group of commodities (e.g
 25                                                                                                    energy, precious metals, livestock or grains) may constitute
 20
                                                                                                       more than 33% of the index and no single commodity may
                                                                                                       constitute less than 2% or more than 15% of the index.
 15                                                                                                    Commodities tend to behave differently to all other asset
                                                            Canada Life Quadrivium Fund
                                                                                                       classes and for this reason are used as a good diversifier in
 10
                                                                                                       multi-asset portfolios. The ETFs are issued by ETF Securities.
                                                            Diversified Funds Average
  5                                                         (Diversified Funds from Eagle Star,        ETF Securities invest the assets backing the ETF with AIG.
                                                            Irish Life & Canada Life)

  0
                                                                                                       Fixed Interest
 -5
                                                                                                       The Canada Life Fixed Interest Fund invests in government
                                                                                                       gilts predominantly from eurozone countries. Gilts, or bonds
-10                                                                                                    are essentially a form of debt. Governments and large
Source: Moneymate. Performance is net of management fees.
                                                                                                       corporations use them to raise money for capital expenditure.
This fund was launched on 22/10/07


                                            Warning: Past performance is not a reliable guide to future performance.
                                                   The value of your investment may go down as well as up.

Important Information:
This fact sheet does not form part of any contract. The information contained in this document is based on current legislation and is, therefore, subject to change.
The contents are intended as a guideline only and should not be construed as an interpretation of the law. For full details of all our products, please refer to the
specific product policy conditions. You should always seek advice of an appropriately qualified professional. Setanta Asset Management Limited is regulated by the
Central Bank of Ireland. Canada Life Assurance (Ireland) Limited is regulated by the Central Bank of Ireland.
                                                                                                  20
Canada Life / Setanta Cash Fund                                                                                                                                 Quarter 1, 2011


Fund Description

The Cash Fund seeks to provide modest returns in exchange                                            individual securities of ‘A‘ and for the portfolio an average
for relative capital security. The fund may invest in:                                               rating of ‘AA‘.

i) Euro denominated short-dated term deposits with banks                                             The maximum average duration of the fund is 4.5 months,
and/or eligible credit institutions on Canada Life‘s approved                                        and the maximum duration of any one asset is one year.
short-term borrowers list which have a minimum credit                                                The fund has a diversified exposure, with no more than 30%
rating of P-1 and which are authorised to carry on a banking                                         credit exposure to any one entity.
business in the State under Section 9 of the Central Bank
Act, 1971 and/or                                                                                     The fund is actively managed and consideration is given to
                                                                                                     the underlying credit worthiness of the financial institution,
(ii) Euro denominated bonds issued by governments or                                                 the return and the tenure of the deposit.
corporates subject to a minimum average credit rating of


Counterparty Exposure                                                                                Fund Performance to 31/03/11
                                                                                                                  Q1 2011     1 yr p.a    3 yr p.a   5 yr p.a   10 yr p.a
 Issuer                          % of Fund        Issuer                            % of Fund            %

 Ulster Bank                        19.4          Belgian Treasury Bill                3.3               2.0

 National Irish Bank                18.4          German Treasury Bill                 3.3

 French Treasury Bill                9.8          Bank of Ireland (G)                  2.3               1.5

 BNP                                 8.2          Allied Irish Bank (G)                2.0

 ACC Bank                            6.8          EBS Building Society (G)             1.9               1.0

 Dutch Treasury Bill                 6.2          Irish Life & Permanent (G)           1.8
                                                                                                         0.5
 Italian Treasury Bill               5.2          SPGB                                 1.2

 Dutch Commercial Paper              3.3          Cash                                 3.6
                                                                                                         0.0
 German Commercial Paper             3.3

Counterparty exposures (G) are covered by the Irish Government guarantee.
Other counterparty/credit exposures are covered by either other European National                       -0.5
Government Guarantees or have individually strong credit ratings.                                                                                Canada Life/Setanta Cash G

                                                                                                        -1.0                                     Category Average Money Market


                                                                                                             Source: Moneymate. Performance is net of management fees.


                                           Warning: Past performance is not a reliable guide to future performance.
                                                  The value of your investment may go down as well as up.

Important Information:
This fact sheet does not form part of any contract. The information contained in this document is based on current legislation and is, therefore, subject to change.
The contents are intended as a guideline only and should not be construed as an interpretation of the law. For full details of all our products, please refer to the
specific product policy conditions. You should always seek advice of an appropriately qualified professional. Setanta Asset Management Limited is regulated by the
Central Bank of Ireland. Canada Life Assurance (Ireland) Limited is regulated by the Central Bank of Ireland.
                                                                                                21
Canada Life / Setanta Fixed Interest Fund                                                                                                             Quarter 1, 2011


Fund Description

The Fixed Interest Fund invests predominantly in eurozone                             The fund has a minimum ‘A‘ credit rating investment level for
government bonds. It may also hold corporate bonds and                                individual securities. The minimum average credit rating for
bonds from non-eurozone countries. The fund is managed by                             the full portfolio is ‘AA‘. The duration of the portfolio can be
Setanta Asset Management Limited (“Setanta“).                                         between +/- two years of the index.

Setanta‘s general philosophy in relation to fixed income is                            Returns are likely to be modest and can be negative.
that performance in bond markets is primarily driven by the                           However, they are significantly less volatile than equity
directional (duration) calls and yield curve positioning. The                         returns.
fund takes relatively small currency or credit risk.


Top 10 Holdings                                                                       Fund Performance to 31/03/11
                                                                                                Q1 2011      1 yr p.a      3 yr p.a    5 yr p.a   10 yr p.a
 Company                               Country                             %          %

 Depfa ACS Bank                        Ireland                             5.2         4
                                                                                       3
 Buoni Poliennali Del Tes              Italy                               3.9
                                                                                       2
 EBS Mortgage Finance                  Ireland                             3.3         1

 Irish Life & Permanent                Ireland                             3.2         0
                                                                                      -1
 Buoni Poliennali Del Tes              Italy                               3.0
                                                                                      -2
 Buoni Poliennali Del Tes              Italy                               2.9        -3

 Buoni Poliennali Del Tes              Italy                               2.9        -4
                                                                                      -5
 Landwirtsch. Rentenbank               Germany                             2.7
                                                                                      -6
 Hellenic Republic I/L                 Greece                              2.7        -7

 Buoni Poliennali Del Tes              Italy                               2.5        -8


                                                                                                  Canada Life/Setanta Fixed Interest Fund

                                                                                                  Category Average Bonds


                                                                                           Source: Moneymate. Performance is net of management fees.


Asset Distribution                                       Country Weighting                                                   Yield Curve Positioning

                                                                        UK Finland SNAT Poland                               Duration              Fund      Benchmark
                                                                       1.0% 1.0% 2.0% 2.0%                                   (Yrs to Maturity)
               Covered                                            Greece                    France                                                 Weighting Weighting
                18%                                                6.0%                      7.0%
                                                            Portugal                                                         0-5                   27.1%      9.1%
                                                              3.0%                                  Italy
 Supranational
                                                          Netherlands                              27.0%
      2%
                                                             6.0%
                                                                                                                             5 - 10                50.6%      61.4%
                                                           Belgium
Govt. Agency                                                 5.0%                                                            10 - 15               21.8%      22.3%
    14%
                                                                                                                             15 - 30               0.1%       7.2%
 Govt. Guarantee                       Govt.                     Ireland
        4%                             62%                       17.0%
                                                                                               Spain                                               100%       100%
                                                                           Austria             15.0%
                                                                            3.0% Germany
                                                                                   4.0%


                                    Warning: Past performance is not a reliable guide to future performance.
                                           The value of your investment may go down as well as up.

Important Information:
This fact sheet does not form part of any contract. The information contained in this document is based on current legislation and is, therefore, subject to change.
The contents are intended as a guideline only and should not be construed as an interpretation of the law. For full details of all our products, please refer to the
specific product policy conditions. You should always seek advice of an appropriately qualified professional. Setanta Asset Management Limited is regulated by the
Central Bank of Ireland. Canada Life Assurance (Ireland) Limited is regulated by the Central Bank of Ireland.
                                                                                 22
Canada Life / SEI Manager-of-Managers Fund                                                                              Quarter 1, 2011


CL SEI Global Balanced Fund                                                                                                        P
                                                                                                                         Low     Medium   High


Investment Objective and Strategy                                  Fund Performance
The SEI Global Balanced Fund aims to provide long term               Q1 11           1 Yr         2 Yr p.a   3 Yr p.a   4 Yr p.a    5 Yr p.a
growth of capital with a moderate level of income by                 -1.1%           6.1%         21.2%       2.1%       -2.3%         -1.2%
investing in a range of SEI multi-manager equity and fixed
income funds. The fund is a globally diversified fund with         Top 10 Holdings %
approximately 70% invested in top tier equity funds and the        Apple Inc.                                                          1.62
remaining 30% invested in top tier fixed income funds.             JPMorgan Chase & Co.                                                1.12
                                                                   Chevron Corp.                                                       1.12
Asset Allocation                                                   Microsoft Corp.                                                     1.04

Equities                                             70%           Wells Fargo & Co.                                                   1.00

US Large Cap                                        28.00          QUALCOMM Inc.                                                       0.99

Global Developed Markets                            14.00          AT&T Inc.                                                           0.81

Europe Ex-UK                                        10.00          Pfizer Inc.                                                         0.80

UK                                                   6.00          ConocoPhillips                                                      0.78

Japan                                                5.00          Exxon Mobil Corp.                                                   0.77

Pacific Basin Ex-Japan                               3.50          Total                                                            10.04

Emerging Markets                                     3.50
                                                                   Fixed Income Managers %
                                                                   AllianceBernstein                                                   4.80
Fixed Income                                         30%
                                                                   First International Advisers                                        4.20
Global                                              15.00
                                                                   UBS Global Asset Management                                         2.40
Global Opportunistic                                15.00
                                                                   Wellington Management Company                                       3.60
Total                                               100%
                                                                   DB Advisers                                                         3.05
                                                                   Jennison Associates                                                 2.70
                                                                   Schroders Investment Management                                     2.33
                                                                   Wellington GRV                                                      3.27
                                                                   TCW Group                                                           3.65
List of Managers %
US Large Companies Equities                         28.00          UK Equities                                                         6.00
Aronson, Johnson, Ortiz                              4.43          Invesco Quantitative Strategies                                     1.16
Brown Investment Advisory                            2.86          Investec Asset Management                                           0.77
Delaware Investment Advisors                         2.57          Jupiter Investment Managers                                         1.22
Legg Mason - Growth Equity                           3.14          L.A. Capital Management                                             1.07
Legg Mason - Core Equity                             2.57          Mirabaud Asset Management                                           1.16
LSV Asset Management                                 4.43          Standard Life Investments                                           0.61
Neuberger Berman                                     2.86          Japanese Equities                                                   5.00
Quantitative Management Associates                   2.86          Acadian Asset Management                                            1.12
WestEnd Advisors                                     2.28          Analytic Investors Inc                                              1.02
Global Developed Markets Equities                   14.00          Capital International                                               1.28
Hexavest                                             3.46          JPMorgan Asset Management                                           1.58
Intech Investment Management                         2.89          Pacific Basin Ex-Japan Equities                                     3.50
Janus Capital Group                                  2.60          Capital International                                               0.98
Tradewinds                                           1.73          Lloyd George Investment Management                                  1.40
Wellington Management Co. Int. Value                 3.32          Maple-Brown Abbott Limited                                          1.12
Europe Ex-UK Equities                               10.00          Emerging Markets Equities                                           3.50
Acadian Asset Management                             3.67          Artisan Partners                                                    0.71
Metropole Gestion                                    1.74          JO Hambro Capital Management                                        0.36
TT International                                     2.55          Lazard Asset Management                                             0.50
Wellington Management Company                        2.04          Neuberger Berman                                                    0.50
                                                                   PanAgora Asset Management                                           0.71
                                                                   The Boston Company Asset Management                                 0.71


                                                              23
Canada Life / SEI Manager-of-Managers Fund                                                                   Quarter 1, 2011


CL SEI Global Developed Markets Equity Fund                                                                                     P
                                                                                                                Low   Medium    High


Investment Objective and Strategy                                     Fund Performance
The investment objective of the Global Developed Markets                 Q1 11           1 Yr   2 Yr p.a   3 Yr p.a     4 Yr p.a
Equity Fund is to achieve capital appreciation by investing
                                                                          -2.4%        5.7%     24.7%       -3.0%        -9.4%
primarily in equity securities of issuers located in developed
countries. Following a manager-of-managers approach, the
fund’s assets are diversified across specialist sub-advisers.

Fund Benchmark
MSCI World Index


Top 10 Holdings %                                                     Country Allocation %
 Exxon Mobil Corp.                                     1.28           United States                                       47.2
 Microsoft Corp.                                       1.11           Japan                                               11.1
 Eli Lilly & Co.                                       0.93           United Kingdom                                      8.0
 HSBC Holdings Plc                                     0.9            Canada                                              4.3
 General Electric Co.                                  0.83           Germany                                             4.0
 Pfizer Inc.                                           0.82           Switzerland                                         3.9
 International Business Machines Corp.                 0.81           France                                              3.9
 Wells Fargo & Co.                                     0.79           Australia                                           1.8
 Newmont Mining Corp.                                  0.74           Norway                                              1.6
 JPMorgan Chase & Co.                                  0.73           Hong Kong                                           1.6
 Total                                                 8.94           Other                                               12.6


Underlying Managers                                                   Sector Weighting %
 Hexavest                                              24.7           Financials                                          17.1
 Wellington Management Company International Value     23.7           Industrials                                         13.3
 Intech Investment Management                          20.6           Consumer Discretionary                              12.1
 Janus Capital Management                              18.6           Energy                                              10.2
 Tradewinds Global Investors                           12.4           Information Technology                              10.0
 Fund Total                                          100.00           Health Care                                         10.0
                                                                      Materials                                           9.8
                                                                      Consumer Staples                                    7.8
                                                                      Telecoms                                            5.9
                                                                      Utilities                                           3.9


Market Capitalisation Breakdown (USD) Weight (%)
 Greater than 50 Billion                               28.6
 Between 20 and 50 Billion                             25.7
 Between 10 and 20 Billion                             19.4
 Between 1 and 10 Billion                              24.6
 Less than 1 Billion                                   1.7


                                                                 24
Canada Life / SEI Manager-of-Managers Fund                                                                  Quarter 1, 2011


CL SEI European (Ex-UK) Equity Fund                                                                                            P
                                                                                                               Low   Medium    High


Investment Objective and Strategy                                    Fund Performance
The fund aims to achieve long-term capital growth and                   Q1 11           1 Yr   2 Yr p.a   3 Yr p.a     4 Yr p.a
income by investing in a broadly diversified portfolio of
                                                                         1.6%         7.7%     28.4%       -3.5%        -6.1%
European equity securities. Following a manager-of-managers
approach, the fund’s assets are diversified across specialist
sub-advisers.

Fund Benchmark
MSCI Europe EX-UK index


Top 10 Holdings %                                                    Country Allocation %
 BNP Paribas S.A.                                    2.6             France                                              26.1
 Total S.A.                                          2.4             Germany                                             21.6
 Basf SE                                             1.8             Switzerland                                         12.2
 Sanofi-Aventis S.A.                                 1.7             Sweden                                              8.6
 Novartis AG                                         1.5             Italy                                               6.8
 Daimler AG                                          1.4             Netherlands                                         4.9
 Sap AG                                              1.3             Norway                                              3.4
 Unicredit S.P
             .A.                                     1.3             Spain                                               3.3
 Heineken N.V.                                       1.3             Denmark                                             2.8
 Capgemini                                           1.2             Finland                                             2.5
 Total                                               16.4            Other                                               7.8


Underlying Managers                                                  Sector Weighting %
 Acadian Asset Management                            36.7            Industrials                                         21.7
 TT International                                    25.5            Financials                                          15.7
 Wellington Management Company                       20.4            Consumer Discretionary                              14.8
 Metropole Gestion                                   17.4            Consumer Staples                                    10.9
 Fund Total                                         100.00           Materials                                           10.5
                                                                     Information Technology                              7.9
                                                                     Health Care                                         7.8
                                                                     Energy                                              5.9
                                                                     Telecomm Services                                   2.7
                                                                     Utilities                                           2.2


Market Capitalisation Breakdown (USD) Weight (%)
 Greater than 50 Billion                             22.7
 Between 20 and 50 Billion                           12.8
 Between 10 and 20 Billion                           15.0
 Between 1 and 10 Billion                            43.2
 Less than 1 Billion                                 6.3


                                                                25
Canada Life / SEI Manager-of-Managers Fund                                                                   Quarter 1, 2011


CL SEI US Equity Fund                                                                                                           P
                                                                                                                Low   Medium    High


Investment Objective and Strategy                                     Fund Performance
The SEI US Large Companies Fund aims to provide long-                    Q1 11           1 Yr   2 Yr p.a   3 Yr p.a     4 Yr p.a
term capital growth and income by investing primarily in a
                                                                          -0.2%        7.2%     23.3%       2.7%         -4.1%
broadly diversified portfolio of US equity securities of large
companies. Following a manager-of-managers approach, the
fund’s assets are diversified across specialist sub-advisers.

Fund Benchmark
Russell 1000 Index


Top 10 Holdings %                                                     Sector Weighting %
 Apple Inc.                                            2.6            Information Technology                              24.6
 JPMorgan Chase & Co.                                  1.7            Financials                                          15.1
 Chevron Corp.                                         1.7            Health Care                                         13.3
 Qualcomm Inc.                                         1.7            Consumer Discretionary                              12.0
 Wells Fargo & Co.                                     1.5            Energy                                              10.8
 Microsoft Corp.                                       1.5            Industrials                                         9.3
 AT&T Inc.                                             1.3            Consumer Staples                                    6.4
 Conocophillips                                        1.2            Materials                                           3.1
 Pfizer Inc.                                           1.1            Telecomm Services                                   2.8
 Procter & Gamble Co.                                  1.1            Utilities                                           2.5
 Total                                                 15.6


Underlying Managers
 Aronson & Johnson & Ortiz                             15.8
 LSV Asset Management                                  15.8
 Legg Mason - Growth Equity                            11.2
 Brown Investment Advisory                             10.2
 Neuberger Berman                                      10.2
 Quantitative Management Associates                    10.2
 Delaware Investments                                  9.2
 Legg Mason - Value Equity                             9.2
 WestEnd Advisors                                      8.2
 Fund Total                                          100.00


Market Capitalisation Breakdown (USD) Weight (%)
 Greater than 50 Billion                               34.3
 Between 20 and 50 Billion                             26.1
 Between 10 and 20 Billion                             19.2
 Between 1 and 10 Billion                              20.2
 Less than 1 Billion                                   0.3


                                                                 26
Canada Life / SEI Manager-of-Managers Fund                                                               Quarter 1, 2011


CL SEI UK Equity Fund                                                                                                       P
                                                                                                            Low   Medium    High


Investment Objective and Strategy                                 Fund Performance
The SEI UK Equity Fund aims to achieve long-term capital             Q1 11           1 Yr   2 Yr p.a   3 Yr p.a     4 Yr p.a
growth and income by investing primarily in a broadly
                                                                      -2.6%        6.4%     28.7%       -2.0%        -9.0%
diversified portfolio of UK equity securities. Following a
manager-of managers approach, the fund’s assets are
diversified across specialist sub-advisers.

Fund Benchmark
FTSE All Share Index


Top 10 Holdings %                                                 Sector Weighting %
 Vodafone Group Plc                                   4.0         Financials                                          19.3
 Rio Tinto Plc                                        3.4         Industrials                                         15.4
 BP Plc                                               3.1         Energy                                              14.0
 BGGroup Plc                                          3.0         Materials                                           12.8
 HSBC Holdings Plc                                    2.7         Consumer Discretionary                              11.8
 Glaxosmithkline Plc                                  2.6         Consumer Staples                                    9.2
 Astrazeneca Plc                                      2.5         Health Care                                         6.2
 Royal Dutch Shell Plc (Cl B)                         2.4         Telecomm Services                                   5.4
 BHP Billiton Plc                                     2.3         Information Technology                              4.5
 Barclays Plc                                         2.0         Utilities                                           1.5
 Total                                                28.0


Underlying Managers
 Jupiter Asset Management                             20.4
 Invesco Asset Management                             19.4
 Mirabaud Investment Management                       19.4
 L.A Capital Management                               17.9
 Investec Asset Management                            12.8
 Standard Life Investments                            10.2
 Fund Total                                         100.00


Market Capitalisation Breakdown (USD) Weight (%)
 Greater than 50 Billion                              35.4
 Between 20 and 50 Billion                            11.7
 Between 10 and 20 Billion                            8.7
 Between 1 and 10 Billion                             40.1
 Less than 1 Billion                                  4.1


                                                             27
Canada Life / SEI Manager-of-Managers Fund                                                                       Quarter 1, 2011


CL SEI Pacific Basin (Ex-Japan) Equity Fund                                                                                         P
                                                                                                                    Low   Medium    High


Investment Objective and Strategy                                         Fund Performance
The SEI Pacific Basin (ex-Japan) Equity Fund aims to achieve                 Q1 11           1 Yr   2 Yr p.a   3 Yr p.a     4 Yr p.a
long-term growth of capital and income by investing primarily in
                                                                              -4.6%        7.1%     34.9%       7.6%          2.0%
a broadly diversified portfolio of Pacific Basin (ex-Japan) equity
securities. Following a manager-of-managers approach, the
fund’s assets are diversified across specialist sub-advisers.

Fund Benchmark
MSCI Pacific ex Japan Index


Top 10 Holdings %                                                         Country Allocation %
 BHP Billiton Ltd.                                        7.6             Australia                                           56.3
 Westpac Banking Corp.                                    4.4             Hong Kong                                           23.5
 National Australia Bank Ltd.                             4.3             Singapore                                           8.8
 Australia & New Zealand Banking Group Ltd.               4.1             China                                               4.0
 Rio Tinto Ltd.                                           3.5             United Kingdom                                      2.5
 DBS Group Holdings Ltd.                                  3.2             Korea                                               2.2
 Commonwealth Bank Of Australia                           2.3             Taiwan                                              1.3
 Wesfarmers Ltd.                                          1.9             Thailand                                            0.5
 Oil Search Ltd.                                          1.8             Malaysia                                            0.3
 Cheung Kong (Holdings) Ltd.                              1.8             New Zealand                                         0.3
 Total                                                   34.7             Canada                                              0.3


Underlying Managers                                                       Sector Weighting %
 Lloyd George Investments Management                     40.0             Financials                                          42.3
 Maple-Brown Abbott                                      32.0             Materials                                           16.8
 Capital International                                   28.0             Industrials                                         9.4
 Fund Total                                             100.00            Consumer Discretionary                              7.4
                                                                          Consumer Staples                                    7.1
                                                                          Energy                                              6.1
                                                                          Information Technology                              4.3
                                                                          Telecomm Services                                   3.0
                                                                          Health Care                                         2.5
                                                                          Utilities                                           1.2


Market Capitalisation Breakdown (USD) Weight (%)
 Greater than 50 Billion                                 28.7
 Between 20 and 50 Billion                               15.7
 Between 10 and 20 Billion                               21.2
 Between 1 and 10 Billion                                33.0
 Less than 1 Billion                                      1.5


                                                                     28
Canada Life / SEI Manager-of-Managers Fund                                                                    Quarter 1, 2011


CL SEI Japan Equity Fund                                                                                                         P
                                                                                                                 Low   Medium    High


Investment Objective and Strategy                                      Fund Performance
The investment objective of the SEI Japan Equity Fund is to               Q1 11           1 Yr   2 Yr p.a   3 Yr p.a     4 Yr p.a
achieve long-term growth of capital and income by investing
                                                                           -9.2%        -1.7%    14.8%       -2.9%        -10.5%
primarily in a broadly diversified portfolio of Japanese equity
securities. Following a manager-of-managers approach, the
fund’s assets are diversified across specialist sub-advisers.

Fund Benchmark
TOPIX


Top 10 Holdings %                                                      Sector Weighting %
 Sumitomo Mitsui Financial Group Inc.                   2.8            Industrials                                         23.0
 Toyota Motor Corp.                                     2.4            Financials                                          18.9
 Nippon Telegraph & Telephone Corp.                     2.0            Consumer Discretionary                              17.1
 Astellas Pharma Inc.                                   1.9            Information Technology                              15.7
 Sumitomo Corp.                                         1.9            Materials                                           6.1
 Mitsubishi UFJ Financial Group Inc.                    1.9            Health Care                                         5.9
 Nissan Motor Co. Ltd.                                  1.7            Consumer Staples                                    4.7
 Mitsui & Co. Ltd.                                      1.5            Telecomm Services                                   4.1
 Softbank Corp.                                         1.5            Energy                                              2.7
 Marubeni Corp.                                         1.5            Utilities                                           1.9
 Total                                                 19.0


Underlying Managers
 JPMorgan Asset Management                             31.6
 Capital International                                 25.5
 Acadian Asset Management                              22.5
 Analytic Investors                                    20.4
 Fund Total                                           100.00


Market Capitalisation Breakdown (USD) Weight (%)
 Greater than 50 Billion                                8.6
 Between 20 and 50 Billion                             17.8
 Between 10 and 20 Billion                             21.4
 Between 1 and 10 Billion                              44.6
 Less than 1 Billion                                    7.6


                                                                  29
Canada Life / SEI Manager-of-Managers Fund                                                                  Quarter 1, 2011


CL SEI Emerging Markets Equity Fund                                                                                            P
                                                                                                               Low   Medium    High


Investment Objective and Strategy                                    Fund Performance
The SEI Emerging Markets Equity Fund aims to achieve                    Q1 11           1 Yr   2 Yr p.a   3 Yr p.a     4 Yr p.a
capital appreciation by investing primarily in securities of
                                                                         -5.5%        8.7%     37.0%       4.8%          2.4%
emerging market issuers. Following a manager-of-managers
approach, the fund’s assets are diversified across specialist
sub-advisers.

Fund Benchmark
MSCI Emerging Markets Index


Top 10 Holdings %                                                    Country Allocation %
 Samsung Electronics Co. Ltd.                         3.0            Brazil                                              16.2
 Gazprom OaO ADS                                      1.3            China                                               15.8
 MTN Group Ltd.                                       1.3            Korea                                               12.7
 China Mobile Ltd.                                    1.1            Taiwan                                              10.4
 Taiwan Semiconductor Manufacturing Co. Ltd.          1.0            Russia                                              8.0
 Petrobras Petroleo Brasileiro (Ord)                  1.0            India                                               7.1
 HTC Corp.                                            0.9            South Africa                                        7.1
 Lukoil Holdings ADS                                  0.8            Mexico                                              3.6
 Hyundai Mobis Co. Ltd.                               0.8            Indonesia                                           2.7
 Standard Bank Group Ltd.                             0.8            Turkey                                              2.4
 Total                                                12.0           Other                                               14.0


Underlying Managers                                                  Sector Weighting %
 Artisan Partners                                     20.4           Financials                                          21.6
 PanAgora Asset Management                            20.4           Information Technology                              14.5
 The Boston Company Asset Management                  20.4           Energy                                              14.0
 Lazard Asset Management                              14.3           Materials                                           13.5
 Neuberger Berman                                     14.3           Consumer Discretionary                              10.4
 JO Hambro Capital Management                         10.2           Industrials                                         8.6
 Fund Total                                         100.00           Telecomm Services                                   7.3
                                                                     Consumer Staples                                    5.4
                                                                     Health Care                                         2.9
                                                                     Utilities                                           1.9


Market Capitalisation Breakdown (USD) Weight (%)
 Greater than 50 Billion                              11.2
 Between 20 and 50 Billion                            11.7
 Between 10 and 20 Billion                            8.3
 Between 1 and 10 Billion                             58.6
 Less than 1 Billion                                  10.2


                                                                30
Canada Life / SEI Manager-of-Managers Fund                                                                 Quarter 1, 2011


CL SEI Global Fixed Income Fund                                                                               P
                                                                                                              Low   Medium    High


Investment Objective and Strategy                                     Fund Performance
The SEI Global Fixed Income Fund aims to generate current                  Q1 11       1 Yr   2 Yr p.a   3 Yr p.a     4 Yr p.a
income and exhibit principal volatility similar to that of the
                                                                           -0.9%       0.8%    5.6%       0.6%          0.5%
global developed fixed income market as a whole. Following
a manager-of-managers approach, the fund’s assets are
diversified across specialist sub-advisers

Fund Benchmark
Lehman Global Aggregate Index


Top 10 Holdings %                                                     Country Allocation %
 BUNDESREPUB DEUT 3.50% 1/4/16                          2.2           Euro                                              27.9
 JAPAN-86 0.6% 09/20/14 /JPY/                           2.0           Japan                                             23.4
 JAPAN-113 2.1% 09/20/29 /JPY/                          1.6           USA                                               20.9
 JAPAN-112 2.1% 06/20/29 /JPY/                          1.5           Other                                             15.1
 US TREAS NTS 3.5% 05/15/20                             1.5           UK                                                8.7
 JAPAN-79 0.7% 12/20/13 /JPY/                           1.3           Canada                                            4.1
 EUROPEAN IN 3.875%10/15/16/EUR                         1.3
 JAPAN-304 1.3% 09/20/19 /JPY/                          1.2
 BONOS Y O 5.5% 04/30/21 /EUR/                          1.2
 JAPAN GOV 2.5% 12/21/20/JPY/                           1.1
 Total                                                 14.8


Underlying Managers                                                   Quality Allocation %
 AllianceBernstein                                    32.00           Treasury                                          82.8
 First International Advisors                         28.00           Agency                                            8.2
 Wellington Management Company                        24.00           Credit                                            6.5
 UBS Global Asset Management                          16.00           Collateralized                                    1.2
 Fund Total                                           100.00          Cash                                              1.3


Quality Exposure %
 Aaa and Treasury                                      53.4
 Aa                                                    32.9
 A                                                      5.9
 Baa                                                    4.4
 Ba and Below                                           3.3


                                                                 31
Canada Life / SEI Manager-of-Managers Fund                                                                 Quarter 1, 2011


CL SEI Global Opportunistic Fixed Income Fund                                                                 P
                                                                                                              Low   Medium   High


Investment Objective and Strategy                                     Fund Performance
The SEI Global Opportunistic Fixed Income Fund aims to                     Q1 11       1 Yr   2 Yr p.a   3 Yr p.a     4 Yr p.a
generate current income consistent with the preservation of
                                                                           -0.2%       2.7%    9.2%       2.6%          2.4%
capital by investing primarily in global fixed income markets.
Following a manager-of-managers approach, the fund’s
assets are diversified across specialist sub-advisers.

Fund Benchmark
Lehman Global Aggregate Hedged Index


Top 10 Holdings %                                                     Country Allocation %
 FGLMC PA90761 4.50% 01/01/40                          2.3            USA                                               59.3
 FREDDIE MAC GOLD POOL                                 1.1            Euro                                              26.4
 CANADA GOVT 3.75% 6/1/19 /CAD/                        1.1            UK                                                6.9
 US TREAS NTS 2.5% 03/31/15                            0.9            Canada                                            2.9
 BUNDESREP 2.5% 01/04/21 /EUR/                         0.8            Other                                             2.4
 FEDERAL NATL MTG ASSN FR 2.625%112014                 0.7            Japan                                             2.1
 FNMA PMA0023 5.00% 04/01/29                           0.7
 GENERAL ELEC C 5.625% 05/01/18                        0.7
 FGLMC PG12491 5.00% 01/01/22                          0.7
 FNMA PAD0470 5.00% 02/01/49                           0.6
 Total                                                 9.5


Underlying Managers                                                   Market Value Weighting %
 TCW Investment Management Company                     24.3           Treasury                                          12.5
 Wellington Management Company                         21.8           Agency                                            16.0
 DB Advisors                                           20.3           Credit                                            35.3
 Jennison Associates                                   18.0           Collateralized                                    37.7
 Schroders Investment Management                       15.6           Cash                                              -1.4
 Fund Total                                          100.00


Quality Exposure %
 Aaa and Treasury                                      54.1
 A                                                     17.1
 Baa                                                   14.3
 Aa                                                    12.0
 Ba and Below                                          2.5


                                                                 32
Canada Life / Morgan Stanley European Property Fund                                                                                              Quarter 1, 2011


Fund Description

The Canada Life/Morgan Stanley European Property Fund                                provides a highly efficient and cost-effective way of gaining
allows investors to access the potential returns available                           such exposure. As an asset class, real estate can provide
from the European commercial property market in one                                  important advantages to investors: historically low volatility
diversified fund. The fund invests in a professionally managed                        relative to equities, attractive returns and a low correlation
portfolio of European property companies and is managed by                           to other asset classes.
a team of property experts at Morgan Stanley with over 40
years of collective experience of real estate markets.

Real estate securities are indirect investments in property
whose long-term returns depend on the underlying real
estate market. Broad geographic and sector diversification
would be prohibitively expensive for a direct real estate
investor. However, an indirect real estate portfolio structure


Top 10 Holdings                                                                      Fund Performance to 31/03/11

 Company                                                      %                       Q1 2011                                                          4.4%
 Unibail-Rodamco SE                                           10.22                   1 Year                                                          12.2%
 Land Securities PLC                                          5.31                    2 Year p.a                                                      43.1%
 Klepierre                                                    5.27                    3 Year p.a                                                       -6.9%
 PSP Swiss Property AG                                        4.54                   Source: Moneymate. Performance is net of management fees.

 Icade                                                        4.54
 Hammerson PLC                                                4.46
 British Land Co. Ltd                                         4.07
 Gecina                                                       3.60
 Beni Stabili SPA                                             3.04
 Corio NV                                                     3.01
 Total                                                        48.06


Equity Geographic Distribution

                    Finland Switzerland
                    1.85%     6.37%
           Sweden
            4.67%                           UK
      Italy
     3.04%                                37.90%
  Belgium
   1.35%


      France
      30.42%                         Netherlands
                     Austria           7.06%
                     2.38% Cash & equivalents
                          Germany 1.94%
                            3.02%


      Warning: Past performance is not a reliable guide to future performance. The value of your investment may go down as
                well as up. The Canada Life/Morgan Stanley European Property Fund was launched on 30/7/07.


Important Information:
This fact sheet does not form part of any contract. The information contained in this document is based on current legislation and is, therefore, subject to change.
The contents are intended as a guideline only and should not be construed as an interpretation of the law. For full details of all our products, please refer to the
specific product policy conditions. You should always seek advice of an appropriately qualified professional. Canada Life Assurance (Ireland) Limited is regulated
by the Central Bank of Ireland.
                                                                                33
Canada Life / Merrion Managed Fund                                                                                                                     Quarter 1, 2011


Fund Description

The Canada Life/Merrion Managed Fund is managed by
Merrion Investment Managers. The fund is designed to
provide balanced long-term growth by actively managing the
distribution of the portfolio between cash, bonds, equities
and property according to economic conditions.

The fund maintains an average market weight in property
through its exposure to Canada Life’s Property Fund while
the remainder of the fund is invested in Merrion Investment
Manager’s Managed Fund thus providing broad diversification
in quality equities, bonds, property and cash.


Top 10 Holdings                                                                          Fund Performance to 31/03/11

 Canada Life/Merrion Managed Fund                             %                                   Q1 2011        1 yr p.a     3 yr p.a
                                                                                         %

 iShares MSCI World                                           3.0                         5

 iShares MSCI Emerging Markets                                1.7                         4
 Financial Select Sector SPDR                                 1.3                         3
 Siemens                                                      1.2
                                                                                          2
 Microsoft                                                    1.1
                                                                                          1
 CRH                                                          1.1
                                                                                          0
 iShares MSCI Pacific ex Japan                                 1.1
                                                                                         -1
 iShares MSCI Japan                                           1.0
 ChevronTexaco                                                1.0                        -2

 iShares MSCI Asia ex Japan                                   1.0                        -3

                                                                                                    Canada Life/Merrion Managed Fund

                                                                                                    Category Average Managed Dynamic


                                                                                         The Canada Life/Merrion Managed Fund was launched on 1/10/07. Source: Moneymate.
                                                                                         Performance is net of management fees.


Asset Distribution                                        Equity Geographic Distribution                                    Equity Sectoral Distribution

                        Property
                                                                          Ireland                                                                  Utilities Consumer
                         5.0%    Cash                                                    Pacific Basin                                     Telecoms 1.8% Discretionary
                                                                           7.5%
                                 11.6%                                                       9.7%                                            3.5%              8.3%
                                                                   UK                                                            Information                        Consumer
                                                                  12.4%                                                           Technology                          Staples
                                                                                                         Japan                      11.4%                              5.7%
                                         Fixed Interest                                                  8.0%
                                             11.1%                                                                                                                       Energy
                                                                                                                                                                         13.7%
                                                                                                                             Industrials
                                                                                                                               26.9%
   Equities
    72.3%                                                        US                                  Europe
                                                                34.7%                                27.7%
                                                                                                                                                                 Financials
                                                                                                                                                 Healthcare        20.5%
                                                                                                                                                   8.2%


                                    Warning: Past performance is not a reliable guide to future performance.
                                           The value of your investment may go down as well as up.

Important Information:
This fact sheet does not form part of any contract. The information contained in this document is based on current legislation and is, therefore, subject to change.
The contents are intended as a guideline only and should not be construed as an interpretation of the law. For full details of all our products, please refer to the
specific product policy conditions. You should always seek advice of an appropriately qualified professional. Merrion Capital Investment Managers Limited (trading
as Merrion Investment Managers is regulated by the Central Bank of Ireland. Canada Life Assurance (Ireland) Limited is regulated by the Central Bank of Ireland.

                                                                                    34
Pension Funds


  35
Canada Life / Setanta Pension Unitised With Profits Fund                                                                                                Quarter 1, 2011


Fund Description

The Unitised With Profits Fund (UWP) operates like a                                       At maturity a terminal bonus may be applied if the underlying
unit-linked fund, except that investment return to                                        assets have outperformed the declared bonuses.
policyholders is smoothed and guaranteed not to fall.
                                                                                          The With-Profits Fund is a low-risk fund.
Returns are distributed in the form of a bonus rate declared
by Canada Life based on various factors including the
performance of the underlying assets.

Returns are smoothed to the investor in that the bonus
rate will endeavour to reflect the performance of the assets
over the long term, allowing the investor to avoid short-term
volatility in the markets.


Top 10 Holdings                                                                           Annual Bonus History
 Company                          Sector                                 %                                    Year                                     Pension
                                                                                                             95 – 96                                     9.0%
 Exxon Mobil                      Energy                                 2.4
                                                                                                             96 – 97                                     9.0%
 Pfizer                            Healthcare                             2.1
                                                                                                             97 – 98                                     9.0%
 General Dynamics                 Industrials & Materials                2.0
                                                                                                             98 – 99                                     9.0%
 CRH                              Industrials & Materials                1.9                                 99 – 00                                     8.0%

 Total                             Energy                                1.9                                 00 – 01                                     7.0%

 ENI                               Energy                                1.8                                 01 – 02                                     6.25%

                                                                                                             02 – 03                                     5.25%
 Johnson & Johnson                 Healthcare                            1.8
                                                                                                             03 – 04                                     3.75%
 BP                                Energy                                1.8
                                                                                                             04 – 05                                     3.0%
 Owens Illinois New                Industrials & Materials               1.7
                                                                                                             05 – 06                                     3.0%
 DCC                               Industrials & Materials               1.7                                 06 – 07                                     3.0%

                                                                                                             07 - 08                                     3.0%

                                                                                                             08 - 09                                     2.75%

                                                                                                             09 - 10                                     1.0%

                                                                                                             10 - 11                                     0.0%

                                                                                          Bonus rates are declared net of management charges


Asset Distribution                                      Equity Geographic Distribution                                     Equity Sectoral Distribution

                                                                                 Japan                                                  Telecoms/Utilities Consumer
                       Property                                                           Ireland                                                          Discretionary
                Cash                                                             6.0%                                                         7.9%
                        2.0%                                Pacific & Emerging             5.8%                                                                9.9%
                6.2%                                                                                  UK
                                                                  Markets                            10.3%                      Information                             Consumer
                                                                    8.6%                                                        Technology                               Staples
                                                                                                                                   12.1%                                 11.0%


    Equity                                                     Europe
    36.9%                              Fixed Interest
                                                               20.4%                                                        Industrials
                                           54.9%                                                                                                                           Energy
                                                                                                                            & Materials
                                                                                                                                                                           15.8%
                                                                                                                              16.4%


                                                                                                     USA                                  Healthcare
                                                                                                    48.9%                                                     Financials
                                                                                                                                            12.6%
                                                                                                                                                                14.3%


                                    Warning: Past performance is not a reliable guide to future performance.
                                           The value of your investment may go down as well as up.

Important Information:
This fact sheet does not form part of any contract. The information contained in this document is based on current legislation and is, therefore, subject to change.
The contents are intended as a guideline only and should not be construed as an interpretation of the law. For full details of all our products, please refer to the
specific product policy conditions. You should always seek advice of an appropriately qualified professional. Setanta Asset Management Limited is regulated by the
Central Bank of Ireland. Canada Life Assurance (Ireland) Limited is regulated by the Central Bank of Ireland.
                                                                                     36
Canada Life / Setanta Pension Balanced Dividend Fund                                                                                                                          Quarter 1, 2011


Fund Description

The Balanced Dividend Fund is an actively managed balanced                                                      dividend must be less than 80% of earnings
fund investing 66% in equities and 34% in fixed interest                                                         company debt must be ‘investment grade‘ (if rated)
securities. The equity portion of the fund aims to hold c. 40                                                   company gearing below 100%.
stocks that pay above average dividends. The fixed interest
portion of the fund invests in EU government bonds.                                                       The ratio of debt to equity should be not more than 100%,
                                                                                                          except for utility companies (water, electricity etc.) where
The fund does not target high dividend payers indiscriminately                                            we use a hurdle of 200%, and for financial stocks, where no
for the equity securities; a set of desired criteria is applied                                           maximum is applied.
when filtering potential candidates for the fund. The desired
criteria are:                                                                                             The maximum exposure to currencies other than the euro
                                                                                                          is capped at 10% of the value of the fund. The Balanced
     dividend yield 20% in excess of the MSCI World Index                                                 Dividend Fund is managed by Setanta Asset Management
     no cut in dividend in the last 5 years                                                               Limited (“Setanta“) .
     market capitalisation of at least 500m (excluding Irish stocks)


Top 10 Holdings                                                                                           Fund Performance to 31/03/11
                                                                                                                    Q1 2011         1 yr p.a      3 yr p.a       5 yr p.a
 Company                                     Sector                                        %
                                                                                                          10
 CRH                                         Industrials / Materials                       3.6
                                                                                                           8
 Sanofi-Aventis                               Healthcare                                    3.5
                                                                                                           6
 Fortum                                      Telecoms / Utilities                          3.1
 Lockheed Martin                             Industrials / Materials                       2.8             4

 Solvay                                      Industrials / Materials                       2.6             2

 DCC                                         Industrials / Materials                       2.5             0

 Wincor Nixdorf                              Information Technology                        2.5             -2
 Svenska Handbkn                             Financials                                    2.5
                                                                                                           -4
 Sasol                                       Energy                                        2.4
                                                                                                           -6
 Thai Beverage Public                        Consumer Staples                              2.4

Portfolio Financials
                                                                                                                      Canada Life/Setanta Pension Dividend
                                               Q1 2011
                                                                                                                      Category Average Managed Balanced
 Dividend Yield                                      3.8%
 P/E Ratio                                           11.8x                                                Performance Source: Moneymate & Bloomberg (Benchmark).

Source: Bloomberg & individual company reports. These figures are based on last years dividend in some cases.
The gross yield is before any withholding taxes on the individual shares. It is also before taking account of any exit tax that may apply.


Asset Distribution                                                     Equity Geographic Distribution                                          Equity Sectoral Distribution

                                                                                                                                                                                 Consumer
                                                                                                  Japan   Ireland                                                               Discretionary
                                                                            Pacific & Emerging    4.4%     6.5%                                        Telecoms/Utilities           6.6%
                                                                                  Markets                                                                    18.4%                              Consumer
                                                                                   11.5%                                                                                                         Staples
                                                                                                                        UK                                                                       10.9%
                                                                                                                       19.1%

                                                                                                                                                Information
                                                                                                                                                                                                    Energy
                                                                                                                                                 Technology
                                                                                                                                                                                                    11.1%
                                                                                                                                                    6.3%


                                                                                                                                                   Industrials
                                                                                  Europe                               USA                         & Materials                                  Financials
                                                                                  38.5%                               20.0%                          18.6%                                        14.2%
                                                                                                                                                                            Healthcare
                                                                                                                                                                              13.8%


                                             Warning: Past performance is not a reliable guide to future performance.
                                                    The value of your investment may go down as well as up.

Important Information:
This fact sheet does not form part of any contract. The information contained in this document is based on current legislation and is, therefore, subject to change.
The contents are intended as a guideline only and should not be construed as an interpretation of the law. For full details of all our products, please refer to the
specific product policy conditions. You should always seek advice of an appropriately qualified professional. Setanta Asset Management Limited is regulated by the
Central Bank of Ireland. Canada Life Assurance (Ireland) Limited is regulated by the Central Bank of Ireland.
                                                                                                     37
Canada Life / Setanta Pension Global Equity Fund                                                                                                             Quarter 1, 2011


Fund Description

The Global Equity Fund is an actively managed equity                                        superior financial track record
portfolio, which holds c. 100-140 global stocks. The                                        competitive advantage and a sustainable business model
investment objective of the Global Equity Fund is to secure                                 within their industry
long-term capital growth by investing in a range of Irish and                               focused on profitability and can demonstrate an ability to
international equities.                                                                     earn cash flow returns in excess of their cost of capital
                                                                                            over the business cycle
The fund is managed by Setanta Asset Management Limited                                     do not carry excessive debt levels.
(“Setanta“). The fund is the cornerstone of Setanta‘s
investment process. Setanta is a value investor in quality
companies and builds the portfolio from the bottom up.
Stocks are picked within a global sector framework, with an
emphasis on the following key characteristics:


Top 10 Holdings                                                                        Fund Performance to 31/03/11
                                                                                       %         Q1 2011      1 yr p.a     3 yr p.a        5 yr p.a   10 yr p.a
 Company                            Sector                               %
                                                                                        8
 Exxon Mobil                        Energy                               2.4
 Pfizer                              Healthcare                           2.1            6

 General Dynamics                   Industrials & Materials              2.0
 CRH                                Industrials & Materials              1.9            4

 Total                              Energy                               1.9
                                                                                        2
 Johnson & Johnson                  Healthcare                           1.8
 ENI                                Energy                               1.7
                                                                                        0
 Owens Illinois                     Industrials & Materials              1.7
 BP                                 Energy                               1.7           -2
 DCC                                Industrials & Materials              1.7
                                                                                                   Canada Life/Setanta Pension Global Equity

                                                                                                   Category Average Flexible Equity


                                                                                       Performance Source: Moneymate & Bloomberg (Benchmark).


Asset Distribution                                      Equity Geographic Distribution                                       Equity Sectoral Distribution

                          Cash                                                                                                                Telecoms/Utilities Consumer
                                                                               Japan   Ireland                                                                  Discretionary
                          1.3%                                                                                                                      7.9%
                                                            Pacific & Emerging 6.1%     5.8%      UK                                                                9.9%
                                                                  Markets                        10.2%                                Information                             Consumer
                                                                    7.6%                                                              Technology                               Staples
                                                                                                                                         12.4%                                 10.9%


                                                              Europe
                                                              21.0%                                                             Industrials                                      Energy
                                                                                                                                & Materials                                      15.5%
                                                                                                                                  16.6%
                                                                                                     USA
                                                                                                    49.4%
                                                                                                                                                Healthcare          Financials
                 Equity
                                                                                                                                                  12.8%               14.1%
                 98.7%


                                    Warning: Past performance is not a reliable guide to future performance.
                                           The value of your investment may go down as well as up.

Important Information:
This fact sheet does not form part of any contract. The information contained in this document is based on current legislation and is, therefore, subject to change.
The contents are intended as a guideline only and should not be construed as an interpretation of the law. For full details of all our products, please refer to the
specific product policy conditions. You should always seek advice of an appropriately qualified professional. Setanta Asset Management Limited is regulated by the
Central Bank of Ireland. Canada Life Assurance (Ireland) Limited is regulated by the Central Bank of Ireland.
                                                                                  38
Canada Life / Setanta Pension Equity Dividend Fund                                                                                                                               Quarter 1, 2011


Fund Description

The Equity Dividend Fund is an actively managed equity                                                         company debt must be ‘investment grade‘ (if rated)
portfolio which aims to hold c. 40 stocks that pay above                                                       company gearing below 100%.
average dividends. The fund does not target high dividend
payers indiscriminately; a set of desired criteria is applied                                             The ratio of debt to equity should be not more than 100%,
when filtering potential candidates for the fund. The desired                                              except for utility companies (water, electricity etc.) where
criteria are:                                                                                             we use a hurdle of 200%, and for financial stocks, where no
                                                                                                          maximum is applied.
     dividend yield 20% in excess of the MSCI World Index
     no cut in dividend in the last five years                                                             The maximum exposure to currencies other than the euro is
     market capitalisation of at least 500m (excluding Irish                                              capped at 10% of the value of the fund. The Equity Dividend
     stocks)                                                                                              Fund is managed by Setanta Asset Management Limited
     dividend must be less than 80% of earnings                                                           (“Setanta“) .


Top 10 Holdings                                                                                           Fund Performance to 31/03/11
                                                                                                                     Q1 2011       1 yr p.a      3 yr p.a       5 yr p.a
 Company                                     Sector                                        %
                                                                                                          15
 CRH                                         Industrials / Materials                       3.6
                                                                                                          12
 Sanofi-Aventis                               Healthcare                                    3.5
                                                                                                           9
 Fortum                                      Telecoms / Utilities                          3.1
 Lockheed Martin                             Industrials / Materials                       2.8             6

 Solvay                                      Industrials / Materials                       2.6             3

 DCC                                         Industrials / Materials                       2.5             0

 Wincor Nixdorf                              Information Technology                        2.5            -3
 Svenska Handbkn                             Financials                                    2.5
                                                                                                          -6
 Sasol                                       Energy                                        2.4
                                                                                                          -9
 Thai Beverage Public                        Consumer Staples                              2.4
                                                                                                                      Canada Life/Setanta Pension Equity Dividend
Portfolio Financials                           Q1 2011
                                                                                                                      Category Average Flexible Equity
 Dividend Yield                                      3.8%
 P/E Ratio                                           11.8x                                                Performance Source: Moneymate & Bloomberg (Benchmark).

Source: Bloomberg & individual company reports. These figures are based on last years dividend in some cases.
The gross yield is before any withholding taxes on the individual shares. It is also before taking account of any exit tax that may apply.


Asset Distribution                                                     Equity Geographic Distribution                                           Equity Sectoral Distribution

                                                                                                                                                                                   Consumer
                                Cash                                                              Japan    Ireland
                                                                            Pacific & Emerging                                                                                    Discretionary
                                6.8%                                                              4.4%      6.5%                                         Telecoms/Utilities
                                                                                  Markets                                                                                             6.6%
                                                                                                                                                               18.4%                              Consumer
                                                                                   11.5%                                 UK                                                                        Staples
                                                                                                                        19.1%                                                                      10.9%
                                                  Equity
                                                  94.3%                                                                                          Information
                                                                                                                                                                                                      Energy
                                                                                                                                                  Technology
                                                                                                                                                                                                      11.1%
                                                                                                                                                     6.3%


                                                                                                                                                    Industrials
                                                                                  Europe                                USA                         & Materials                                   Financials
                                                                                  38.5%                                20.0%                          18.6%                                         14.2%
                                                                                                                                                                              Healthcare
                                                                                                                                                                                13.8%


                                             Warning: Past performance is not a reliable guide to future performance.
                                                    The value of your investment may go down as well as up.

Important Information:
This fact sheet does not form part of any contract. The information contained in this document is based on current legislation and is, therefore, subject to change.
The contents are intended as a guideline only and should not be construed as an interpretation of the law. For full details of all our products, please refer to the
specific product policy conditions. You should always seek advice of an appropriately qualified professional. Setanta Asset Management Limited is regulated by the
Central Bank of Ireland. Canada Life Assurance (Ireland) Limited is regulated by the Central Bank of Ireland.
                                                                                                     39
Canada Life / Setanta Pension Focus 15 Fund                                                                                                                       Quarter 1, 2011


Fund Description

The Focus 15 Fund is an actively managed, concentrated                                                focused on profitability and can demonstrate an ability to
equity portfolio, which holds c. 15 international (ex-Ireland)                                        earn cash flow returns in excess of their cost of capital
stocks. The Focus 15 Fund is managed by Setanta Asset                                                 over the business cycle
Management Limited (“Setanta“). Setanta is a value investor                                           do not carry excessive debt levels.
in quality companies. Setanta builds the portfolio from
the bottom up, using the stocks researched by the sector                                         Clearly, Focus 15 is likely to be more volatile than more
specialists, who apply the following key characteristics:                                        broadly-based funds; it is therefore only suitable for those
                                                                                                 investors with experience of the stock market.
    superior financial track record
    competitive advantage and a sustainable business model
    within their industry


Fund Holdings                                                                                    Fund Performance to 31/03/11
 Company                             Sector                                           %                  Q1 2011      1 yr p.a     3 yr p.a      5 yr p.a   10 yr p.a
                                                                                                 %
 Pfizer                               Healthcare                                       9.0        18
 Sysco                               Consumer Staples                                 8.2
                                                                                                 15
 Everest Re Group                    Financials                                       7.7

 Tidewater                           Energy                                           7.0        12
 Steris                              Healthcare                                       7.0
                                                                                                  9
 Johnson & Johnson                   Healthcare                                       6.9

 Total                               Energy                                           6.8         6
 MI Developments                     Financials                                       6.8
                                                                                                  3
 Astellas Pharmaceutical             Healthcare                                       6.7

 Wincor Nixdorf                      Information Technology                           6.6         0

 NTT Docomo                          Telecoms / Utilities                             6.1
                                                                                                 -3
 Motor                               Consumer Discretionary                           5.9

 Belgacom                            Telecoms / Utilities                             4.0                  Canada Life/Setanta Pension Focus 15

 Nokia                               Information Technology                           3.1
                                                                                                           Category Average Flexible Equity
 OPAP                                Consumer Discretionary                           2.1

 Komori                              Industrials & materials                          1.8        Performance Source: Moneymate & Bloomberg (Benchmark).

 Cash                                                                                 4.3


Asset Distribution                                             Equity Geographic Distribution                                        Equity Sectoral Distribution

                              Cash                                                                                                                                   Consumer
                              4.3%                                                                                                               Telecoms/Utilities Discretionary
                                                                             Japan                                                                     10.7%            8.5%
                                                                             21.5%                                                                                               Consumer
                                                                                                                                          Information                             Staples
                                                                                                                                          Technology                               8.6%
                                                                                                                                             10.1%
                                                                                                                                      Industrials
                                                                  Pacific                                        USA                  & Materials                                   Energy
                                                                & Emerging                                      46.7%                    1.9%                                       14.4%
                                                                 Markets
                                                                   8.0%


                                                                             Europe                                                           Healthcare
                                                                             23.7%                                                              30.8%                        Financials
                     Equity                                                                                                                                                    15.1%
                     95.7%


                                     Warning: Past performance is not a reliable guide to future performance.
                                            The value of your investment may go down as well as up.

Important Information:
This fact sheet does not form part of any contract. The information contained in this document is based on current legislation and is, therefore, subject to change.
The contents are intended as a guideline only and should not be construed as an interpretation of the law. For full details of all our products, please refer to the
specific product policy conditions. You should always seek advice of an appropriately qualified professional. Setanta Asset Management Limited is regulated by the
Central Bank of Ireland. Canada Life Assurance (Ireland) Limited is regulated by the Central Bank of Ireland.

                                                                                            40
Canada Life / Setanta Pension Irish Equity Fund                                                                                                              Quarter 1, 2011


Fund Description

The Irish Equity Fund is an actively managed equity                                        focused on profitability and can demonstrate an ability to
portfolio which aims to hold stocks quoted on the Irish                                    earn cash flow returns in excess of their cost of capital
stock exchange. The fund is managed by Setanta Asset                                       over the business cycle
Management Limited (“Setanta“). Setanta is a value investor                                do not carry excessive debt levels.
in quality companies. Setanta builds the portfolio from the
bottom up, picking stocks within a sector framework, with an                         The Irish Equity Fund is a relatively concentrated equity fund
emphasis on the following key characteristics:                                       with exposure to stocks from only one country and is likely to
                                                                                     be more volatile than more broadly-based funds.
    superior financial track record
    competitive advantage and a sustainable business model
    within their industry


Top 10 Holdings                                                                      Fund Performance to 31/03/11
                                                                                      %           01 2011         1 yr p.a        3 yr p.a        5 yr p.a    10 yr p.a
 Company                            Sector                              %
                                                                                      20
 DCC                                Industrials & Materials             9.3
                                                                                      15
 Total Produce                      Consumer Staples                    8.8
                                                                                      10
 Irish Continental                  Industrials & Materials             8.3
                                                                                       5
 Kingspan                           Industrials & Materials             7.8
                                                                                       0
 CRH                                Industrials & Materials             7.4
                                                                                      -5
 Abbey                              Industrials & Materials             7.3
                                                                                     -10
 Dragon Oil                         Energy                              6.3
                                                                                     -15
 Grafton Group                      Industrials & Materials             6.2
                                                                                     -20
 Kerry Group                        Consumer Staples                    6.2
                                                                                     -25
 Ryanair Holdings                   Industrials & Materials             6.2
                                                                                                   Canada Life/Setanta Irish Equity (Core Fund)

                                                                                                   ISEQ Index


                                                                                     Performance Source: Unit prices from CLFIS UK Limited (Fund), MSCI (90% local, 10% Euro) &
                                                                                     Bloomberg (Benchmark). Setanta fund returns are shown net of management charges. Valuation
                                                                                     Statistics Source: Style Research. Performance is net of management fees.


Asset Distribution                                      Equity Sectoral Distribution

                                                                                 Consumer
                          Cash                                                  Discretionary
                          0.1%                                                      5.8%

                                                                                                   Consumer
                                                                                                    Staples
                                                                                                    25.3%


                                                         Industrials
                                                         & Materials
                                                           57.5%                                     Energy
                                                                                                      6.3%
                                                                                                  Financials
                                                                                                     1.1%
                 Equity                                                              Healthcare
                 99.9%                                                                 4.0%


                                    Warning: Past performance is not a reliable guide to future performance.
                                           The value of your investment may go down as well as up.

Important Information:
This fact sheet does not form part of any contract. The information contained in this document is based on current legislation and is, therefore, subject to change.
The contents are intended as a guideline only and should not be construed as an interpretation of the law. For full details of all our products, please refer to the
specific product policy conditions. You should always seek advice of an appropriately qualified professional. Setanta Asset Management Limited is regulated by the
Central Bank of Ireland. Canada Life Assurance (Ireland) Limited is regulated by the Central Bank of Ireland.
                                                                                41
Canada Life / Setanta Pension Managed Fund                                                                                                                       Quarter 1, 2011


Fund Description

The investment objective of the Pension Managed Fund is to                                       superior financial track record
secure long-term capital growth. The fund seeks to achieve                                       competitive advantage and a sustainable business model
its objective by investing primarily in a range of Irish and                                     within their industry
international equities and bonds. The fund will hold between                                     focused on profitability and can demonstrate an ability to
50-80% of its assets in equities with the balance consisting                                     earn cash flow returns in excess of their cost of capital
of bonds, property and cash                                                                      over the business cycle
                                                                                                 do not carry excessive debt levels.
The fund is managed by Setanta Asset Management Limited
(“Setanta“). Setanta is a value investor in quality companies.
Setanta builds the portfolio from the bottom up, picking
stocks within a global sector framework, with an emphasis
on the following key characteristics:


Top 10 Holdings                                                                            Fund Performance to 31/03/11
                                                                                                     Q1 2011       1 yr p.a    3 yr p.a      5 yr p.a   10 yr p.a
 Company                                 Sector                           %                %

 Exxon                                   Mobil Energy                     1.6               6

 CRH                                     Industrials & Materials          1.5               5

 DCC                                     Industrials & Materials          1.4               4

 Pfizer                                   Healthcare                       1.4               3

 Total                                   Energy                           1.4               2
 General Dynamics                        Industrials & Materials          1.3
                                                                                            1
 ENI                                     Energy                           1.2
                                                                                            0
 Johnson & Johnson                       Healthcare                       1.2
                                                                                           -1
 BP                                      Energy                           1.2
                                                                                           -2
 Owens Illinois                          Industrials & Materials          1.1

                                                                                                         Canada Life/Setanta Pension Managed

                                                                                                         Average Managed Fund (Mercer Survey)


                                                                                           Performance Source: Mercer Managed Fund Survey.


Asset Distribution                                        Equity Geographic Distribution                                         Equity Sectoral Distribution

                                                                                   Japan
                                                                                   6.0%                                                           Telecoms/Utilities Consumer
                              Property                        Pacific & Emerging               Ireland                                                              Discretionary
                       Cash                                                                                                                             7.6%
                                2.8%                                Markets                     9.2%                                                                    9.7%
                       6.4%                                                                                                               Information
         Commodities                     Fixed Interest               7.9%                                 UK                                                                   Consumer
                                                                                                                                          Technology
            2.4%                             19.4%                                                        9.9%                                                                    Staples
                                                                                                                                             11.6%
                                                                                                                                                                                  11.3%
                                                              Europe
                                                              19.9%

                                                                                                                                   Industrials
                                                                                                                                                                                    Energy
                                                                                                                                   & Materials
                                                                                                                                                                                    15.7%
                                                                                                                                     18.3%

          Equity
          69.0%
                                                                                          USA                                                       Healthcare         Financials
                                                                                         47.1%                                                        12.4%              13.5%


                                         Warning: Past performance is not a reliable guide to future performance.
                                                The value of your investment may go down as well as up.

Important Information:
This fact sheet does not form part of any contract. The information contained in this document is based on current legislation and is, therefore, subject to change.
The contents are intended as a guideline only and should not be construed as an interpretation of the law. For full details of all our products, please refer to the
specific product policy conditions. You should always seek advice of an appropriately qualified professional. Setanta Asset Management Limited is regulated by the
Central Bank of Ireland. Canada Life Assurance (Ireland) Limited is regulated by the Central Bank of Ireland.
                                                                                    42
Canada Life / Setanta Passive Equity Fund                                                                                                               Quarter 1, 2011


Fund Description

This fund invests in the shares of a large number of
companies from around the world. The companies are
chosen simply by reference to their size. There is no attempt
to select the “winners”/avoid the “losers”, hence the
description “passive”. Effectively the fund owns a slice of
most of the companies quoted on the world’s major stock
markets and its value will rise and fall in line with world
share prices.


Top 10 Holdings                                                                      Fund Performance to 31/03/11

                                      Sector                           %                     Q1 2011       1 yr p.a        3 yr p.a          5 yr p.a
 Company                                                                             %

 Exxon Mobil Corp                     Energy                           1.7            8

 Apple                                Information Technology           1.3
                                                                                      6
 Chevron Corp                         Industrials/Materials            0.9
 General Electric Co                  Industrials/Materials            0.8
                                                                                      4
 IBM Corp                             Information Technology           0.8
 Nestle                               Consumer Staples                 0.8            2
 Microsoft Corp                       Information Technology           0.8
 HSBC Holdings (GB)                   Financials                       0.7            0

 AT&T                                 Telecoms/Utilities               0.7
 JPMorgan Chase & Co                  Financials                       0.7           -2


                                                                                     -4                   Canada Life/Setanta Passive Equity

                                                                                                          Category Average Flexible Equity


                                                                                     Source: Moneymate. Performance is net of management fees.


Equity Geographic Distribution

                         Ireland
                 Japan              UK
                          0.1%
                 10.0%             9.7%
 Pacific & Emerging
       Markets
         6.1%


    Europe
    19.5%


                                    USA
                                   54.5%


                                      Warning: Past performance is not a reliable guide to future performance.
                                             The value of your investment may go down as well as up.

Important Information:
This fact sheet does not form part of any contract. The information contained in this document is based on current legislation and is, therefore, subject to change.
The contents are intended as a guideline only and should not be construed as an interpretation of the law. For full details of all our products, please refer to the
specific product policy conditions. You should always seek advice of an appropriately qualified professional. Setanta Asset Management Limited is regulated by the
Central Bank of Ireland. Canada Life Assurance (Ireland) Limited is regulated by the Central Bank of Ireland.
                                                                                43
Canada Life / Setanta Pension Property Fund                                                                                                                     Quarter 1, 2011


Fund Description

This fund invests in commercial properties - office, retail and                            The Property Fund is suitable for investors who wish to gain
warehousing. The fund is characterised by the quality of the                              investment exposure to the commercial property sector.
property that makes up the portfolio and the tenants that                                 Investors should understand that property investment is by
occupy these properties.                                                                  its nature less liquid than other asset classes.

Currently, all of the properties are located in Ireland.


Sample Property Holdings                                                                  Fund Performance to 31/03/11

 OFFICE                                                                                    %      Q1 2011      1 yr p.a     3 yr p.a        5 yr p.a    10 yr p.a

                                                                                           10
 Block C, Earlsfort Centre
 Tenant - Office of Public Works                                                             5

 Fund Weighting - 13.2%
                                                                                            0
 RETAIL
 45/46 Patrick Street, Cork                                                                -5

 Tenant - C&J Clarke International
                                                                                          -10
 Fund Weighting - 3.8%
 INDUSTRIAL/WAREHOUSE                                                                     -15

 Swords Business Campus
                                                                                          -20
 Tenants - Air France, Client Logic, Eastern Health Board
 Fund Weighting - 10.2%                                                                              Canada Life/Setanta Pension Property

                                                                                                     Category Average Property


                                                                                          Source: Moneymate


Asset Distribution                                      Geographic Distribution                                              Sectoral Distribution

                    Cash                                        Rest of Ireland
                    9.5%                                           16.5%
                                                                                                                                        Office
                                                                                                                                        27.7%
                                                                                                                                                                         Retail
                                                                                                    Dublin city centre                                                   41.7%
                                                            Cork
                                                                                                          44.4%
                                                           10.3%


                                                                                                                                 Cash & Bonds
                                                                                                                                     9.5%


                                                                   Suburban Dublin                                                                     Industrial
                           Property                                    28.8%                                                                             21.1%
                            90.5%


                                      Warning: Past performance is not a reliable guide to future performance.
                                             The value of your investment may go down as well as up.

Important Information:
This fact sheet does not form part of any contract. The information contained in this document is based on current legislation and is, therefore, subject to change.
The contents are intended as a guideline only and should not be construed as an interpretation of the law. For full details of all our products, please refer to the
specific product policy conditions. You should always seek advice of an appropriately qualified professional. Setanta Asset Management Limited is regulated by the
Central Bank of Ireland. Canada Life Assurance (Ireland) Limited is regulated by the Central Bank of Ireland.
                                                                                     44
Canada Life Pension Consensus Fund                                                                                                                  Quarter 1, 2011


Fund Description

The investment objective of the Consensus Fund is to secure                          The stock selection within each market is index stock
long-term capital growth. The fund is designed to eliminate                          selection which means the weighting in each stock
individual manager selection risk while achieving average                            represented within the relevant index is replicated.
managed fund returns over the long term.
                                                                                     The Consensus Fund is a medium-risk fund.
It seeks to achieve its objective by investing in accordance
with the average asset distribution of Irish Investment
Managers Group Pension Managed Funds.


Asset Distribution                                                                   Fund Performance to 31/03/11

                              Cash                                                   %       Q1 2011      1 yr p.a     3 yr p.a    5 yr p.a   10 yr p.a
                              6.9%
                                        Property                                      6
                                         2.9%
                                                                                      5

                                               Fixed Interest                         4
                                                   15.1%
                                                                                      3

    Equity                                                                            2
    75.2%
                                                                                      1

                                                                                      0

                                                                                     -1

                                                                                     -2

                                                                                     -3
 Equity Geographic Distribution

                      Japan   Ireland                                                           Canada Life/Setanta Pension Consensus

 Pacific & Emerging   4.5%     6.7%
                                            UK                                                  Average Managed Fund (Mercer Survey)
       Markets
                                           13.3%
        14.5%
                                                                                     Source: Moneymate & Mercer Pooled Fund Survey (Benchmark).


       Europe                                USA
       27.4%                                33.5%


                                           Warning: Past performance is not a reliable guide to future performance.
                                                  The value of your investment may go down as well as up.

Important Information:
This fact sheet does not form part of any contract. The information contained in this document is based on current legislation and is, therefore, subject to change.
The contents are intended as a guideline only and should not be construed as an interpretation of the law. For full details of all our products, please refer to the
specific product policy conditions. You should always seek advice of an appropriately qualified professional. Setanta Asset Management Limited is regulated by the
Central Bank of Ireland. Canada Life Assurance (Ireland) Limited is regulated by the Central Bank of Ireland.
                                                                                45
Canada Life Quadrivium Fund                                                                                                                       Quarter 1, 2011


Fund Description                                                                                       Fund Composition

The investment objective of the Canada Life Quadrivium Fund                                            The Quadrivium Fund invests in the following four asset classes:
is to secure long-term capital growth.
                                                                                                       High-Yield Equities
The fund seeks to achieve its objective by investing in four                                           The Canada Life Dividend Fund is an equity fund that
different asset classes – equities, bonds, property and                                                specifically targets stable blue chip quality companies with
commodities. By investing in Quadrivium investors can gain                                             the ability to pay consistently strong dividends.
access to a diversified portfolio invested across these four                                            The Dividend Fund is a pure equity portfolio of actively
asset classes. The fund provides exposure to international                                             managed companies with an average of 40 holdings.
shares, Irish & European commercial property, commodities
and fixed interest assets, all within one fund.                                                         Property
                                                                                                       Irish Commercial Property
                                                                                                       The Canada Life Property Fund invests in a range of
Asset Distribution                                                                                     commercial properties. The fund is currently fully invested
                                                                                                       in Irish commercial properties but will seek opportunities
                                  Fixed Interest
                                      8.1%                                                             outside Ireland where appropriate. The fund is managed by
                                                                                                       a team of property specialists at Canada Life European Real
              Commodities                                                                              Estate, who have over 20 years of property experience and
                18.4%                                                                                  manage over €1.7 billion in property assets.

                                                              Dividend Fund                            European Property
                                                                  43.1%
                                                                                                       The Canada Life/Morgan Stanley European Property Fund
              European Property
                                                                                                       invests in a professionally managed portfolio of European
                   16.5%                                                                               property companies, and is managed by a team of property
                                         Irish Property
                                             13.9%                                                     experts at Morgan Stanley with over 40 years of collective
                                                                                                       experience of real estate markets. The fund invests in
 Asset Class                                               Current           Expected
                                                          Allocation          Range                    quoted European property companies through buying
                                                                                                       real estate securities. Real Estate securities are indirect
 Dividend Fund                                             43.1%            20% - 50%                  investments in property whose long-term returns depend on
 Irish Property                                            13.9%            10% - 25%                  the underlying real estate market.
 European Property                                         16.5%            10% - 25%
 Commodities                                               18.4%             0% - 25%
                                                                                                       Commodities
                                                                                                       The commodities allocation in the Quadrivium fund invests
 Fixed Interest                                             8.1%             0% - 25%                  in an Exchange Traded Fund (ETF) issued by ETF Securities.
                                                                                                       The ETFs All Commodities DJ-AIGCI is designed to track the
                                                                                                       Dow Jones-AIG Commodity sub-index. The Dow Jones-AIG
Fund Performance                                                                                       Commodity sub-index invests in a broadly diversified index
         Q1 2011   1 Yr p.a   2 yr p.a   3 yr p.a
                                                                                                       that allows investors to track commodity futures returns
 %
                                                                                                       through a single fund. No related group of commodities (e.g
 25                                                                                                    energy, precious metals, livestock or grains) may constitute
 20
                                                                                                       more than 33% of the index and no single commodity may
                                                                                                       constitute less than 2% or more than 15% of the index.
 15                                                                                                    Commodities tend to behave differently to all other asset
                                                                                                       classes and for this reason are used as a good diversifier in
 10                                                         Canada Life Quadrivium Fund
                                                                                                       multi-asset portfolios. The ETFs are issued by ETF Securities.
                                                            Diversified Funds Average
  5                                                         (Diversified Funds from Eagle Star,        ETF Securities invest the assets backing the ETF with AIG.
                                                            Irish Life & Canada Life)

  0
                                                                                                       Fixed Interest
 -5                                                                                                    The Canada Life Fixed Interest Fund invests in government
                                                                                                       gilts predominantly from eurozone countries. Gilts, or bonds
-10                                                                                                    are essentially a form of debt. Governments and large
Source: Moneymate. Performance is net of management fees.
                                                                                                       corporations use them to raise money for capital expenditure.
This fund was launched on 22/10/07


                                            Warning: Past performance is not a reliable guide to future performance.
                                                   The value of your investment may go down as well as up.

Important Information:
This fact sheet does not form part of any contract. The information contained in this document is based on current legislation and is, therefore, subject to change.
The contents are intended as a guideline only and should not be construed as an interpretation of the law. For full details of all our products, please refer to the
specific product policy conditions. You should always seek advice of an appropriately qualified professional. Setanta Asset Management Limited is regulated by the
Central Bank of Ireland. Canada Life Assurance (Ireland) Limited is regulated by the Central Bank of Ireland.
                                                                                                  46
Canada Life / Setanta Pension Fixed Interest Fund                                                                                                         Quarter 1, 2011


Fund Description

The Fixed Interest Fund invests predominantly in eurozone                             The fund has a minimum ‘A‘ credit rating investment level for
government bonds. It may also hold corporate bonds and                                individual securities. The minimum average credit rating for
bonds from non-eurozone countries. The fund is managed by                             the full portfolio is ‘AA‘. The duration of the portfolio can be
Setanta Asset Management Limited (“Setanta“).                                         between +/- two years of the index.

Setanta‘s general philosophy in relation to fixed income is                            Returns are likely to be modest and can be negative.
that performance in bond markets is primarily driven by the                           However, they are significantly less volatile than equity
directional (duration) calls and yield curve positioning. The                         returns.
fund takes relatively small currency or credit risk.


Top 10 Holdings                                                                       Fund Performance to 31/03/11
                                                                                      %        Q1 2011         1 yr p.a        3 yr p.a        5 yr p.a     10 yr p.a
 Company                               Country                            %            5

 Depfa ACS Bank                        Ireland                            5.2          4
                                                                                       3
 Buoni Poliennali Del Tes              Italy                              3.9
                                                                                       2
 EBS Mortgage Finance                  Ireland                            3.3          1

 Irish Life & Permanent                Ireland                            3.2          0
                                                                                      -1
 Buoni Poliennali Del Tes              Italy                              3.0
                                                                                      -2
 Buoni Poliennali Del Tes              Italy                              2.9         -3

 Buoni Poliennali Del Tes              Italy                              2.9         -4
                                                                                      -5
 Landwirtsch. Rentenbank               Germany                            2.7
                                                                                      -6
 Hellenic Republic I/L                 Greece                             2.7         -7

 Buoni Poliennali Del Tes              Italy                              2.5

                                                                                                 Canada Life/ Setanta Pension Fixed Interest

                                                                                                 Category Average Bonds


                                                                                      Source: Moneymate. Performance is net of management fees.


Asset Distribution                                       Country Weighting                                                  Yield Curve Positioning

                                                                       UK Finland SNAT Poland                               Duration                 Fund      Benchmark
                                                                      1.0% 1.0% 2.0% 2.0%                                   (Yrs to Maturity)
               Covered                                           Greece                    France                                                    Weighting Weighting
                18%                                               6.0%                      7.0%
                                                           Portugal                                                         0-5                      27.1%              9.1%
                                                             3.0%                                  Italy
 Supranational
                                                         Netherlands                              27.0%
      2%
                                                            6.0%
                                                                                                                            5 - 10                   50.6%              61.4%
                                                          Belgium
Govt. Agency                                                5.0%                                                            10 - 15                  21.8%              22.3%
    14%
                                                                                                                            15 - 30                  0.1%               7.2%
 Govt. Guarantee                       Govt.                    Ireland
        4%                             62%                      17.0%
                                                                                             Spain                                                   100%               100%
                                                                          Austria            15.0%
                                                                           3.0% Germany
                                                                                  4.0%


                                    Warning: Past performance is not a reliable guide to future performance.
                                           The value of your investment may go down as well as up.

Important Information:
This fact sheet does not form part of any contract. The information contained in this document is based on current legislation and is, therefore, subject to change.
The contents are intended as a guideline only and should not be construed as an interpretation of the law. For full details of all our products, please refer to the
specific product policy conditions. You should always seek advice of an appropriately qualified professional. Setanta Asset Management Limited is regulated by the
Central Bank of Ireland. Canada Life Assurance (Ireland) Limited is regulated by the Central Bank of Ireland.

                                                                                 47
Canada Life / Setanta Pension Cash Fund                                                                                                                            Quarter 1, 2011


Fund Description

The Cash Fund seeks to provide modest returns in exchange                                            individual securities of ‘A‘ and for the portfolio an average
for relative capital security. The fund may invest in:                                               rating of ‘AA‘.

i) Euro denominated short-dated term deposits with banks                                             The maximum average duration of the fund is 4.5 months,
and/or eligible credit institutions on Canada Life‘s approved                                        and the maximum duration of any one asset is one year.
short-term borrowers list which have a minimum credit                                                The fund has a diversified exposure, with no more than 30%
rating of P-1 and which are authorised to carry on a banking                                         credit exposure to any one entity.
business in the State under Section 9 of the Central Bank
Act, 1971 and/or                                                                                     The fund is actively managed and consideration is given to
                                                                                                     the underlying credit worthiness of the financial institution,
(ii) Euro denominated bonds issued by governments or                                                 the return and the tenure of the deposit.
corporates subject to a minimum average credit rating of


Counterparty Exposure                                                                                Fund Performance to 31/03/11
 Issuer                          % of Fund        Issuer                            % of Fund                       Q1 2011     1 yr p.a     3 yr p.a   5 yr p.a   10 yr p.a
                                                                                                        %
 Ulster Bank                        19.4          Belgian Treasury Bill                3.3              3.0
 National Irish Bank                18.4          German Treasury Bill                 3.3

 French Treasury Bill                9.8          Bank of Ireland (G)                  2.3              2.5

 BNP                                 8.2          Allied Irish Bank (G)                2.0
                                                                                                        2.0
 ACC Bank                            6.8          EBS Building Society (G)             1.9

 Dutch Treasury Bill                 6.2          Irish Life & Permanent (G)           1.8              1.5

 Italian Treasury Bill               5.2          SPGB                                 1.2
                                                                                                        1.0
 Dutch Commercial Paper              3.3          Cash                                 3.6

 German Commercial Paper             3.3
                                                                                                        0.5

Counterparty exposures (G) are covered by the Irish Government guarantee.
Other counterparty/credit exposures are covered by either other European National                       0.0
Government Guarantees or have individually strong credit ratings.
                                                                                                                      Canada Life/Setanta Cash Fund

                                                                                                                      Category Average Money Market


                                                                                                              Source: Moneymate. Performance is net of management fees.


                                           Warning: Past performance is not a reliable guide to future performance.
                                                  The value of your investment may go down as well as up.

Important Information:
This fact sheet does not form part of any contract. The information contained in this document is based on current legislation and is, therefore, subject to change.
The contents are intended as a guideline only and should not be construed as an interpretation of the law. For full details of all our products, please refer to the
specific product policy conditions. You should always seek advice of an appropriately qualified professional. Setanta Asset Management Limited is regulated by the
Central Bank of Ireland. Canada Life Assurance (Ireland) Limited is regulated by the Central Bank of Ireland.
                                                                                                48
Canada Life / SEI Manager-of-Managers Fund                                                                        Quarter 1, 2011


CL SEI Global Balanced Fund                                                                                                 P
                                                                                                                    Low    Medium   High


Investment Objective and Strategy                                  Fund Performance
                                                                      Q1 11            1 Yr          2 Yr p.a   3 Yr p.a      4 Yr p.a
The SEI Global Balanced Fund aims to provide long term
growth of capital with a moderate level of income by                   -1.2%           5.7%          20.9%       1.9%          -2.5%
investing in a range of SEI multi-manager equity and fixed
income funds. The fund is a globally diversified fund with         Top 10 Holdings %
approximately 70% invested in top tier equity funds and the        Apple Inc.                                                   1.62
remaining 30% invested in top tier fixed income funds.             JPMorgan Chase & Co.                                         1.12
                                                                   Chevron Corp.                                                1.12
Asset Allocation                                                   Microsoft Corp.                                              1.04

Equities                                             70%           Wells Fargo & Co.                                            1.00

US Large Cap                                        28.00          QUALCOMM Inc.                                                0.99

Global Developed Markets                            14.00          AT&T Inc.                                                    0.81

Europe Ex-UK                                        10.00          Pfizer Inc.                                                  0.80

UK                                                   6.00          ConocoPhillips                                               0.78

Japan                                                5.00          Exxon Mobil Corp.                                            0.77

Pacific Basin Ex-Japan                               3.50          Total                                                      10.04

Emerging Markets                                     3.50
                                                                   Fixed Income Managers %
                                                                   AllianceBernstein                                            4.80
Fixed Income                                         30%
                                                                   First International Advisers                                 4.20
Global                                              15.00
                                                                   UBS Global Asset Management                                  2.40
Global Opportunistic                                15.00
                                                                   Wellington Management Company                                3.60
Total                                               100%
                                                                   DB Advisers                                                  3.05
                                                                   Jennison Associates                                          2.70
                                                                   Schroders Investment Management                              2.33
                                                                   Wellington GRV                                               3.27

List of Managers %                                                 TCW Group                                                    3.65


US Large Companies Equities                         28.00          UK Equities                                                  6.00
Aronson, Johnson, Ortiz                              4.43          Invesco Quantitative Strategies                              1.16
Brown Investment Advisory                            2.86          Investec Asset Management                                    0.77
Delaware Investment Advisors                         2.57          Jupiter Investment Managers                                  1.22
Legg Mason - Growth Equity                           3.14          L.A. Capital Management                                      1.07
Legg Mason - Core Equity                             2.57          Mirabaud Asset Management                                    1.16
LSV Asset Management                                 4.43          Standard Life Investments                                    0.61
Neuberger Berman                                     2.86          Japanese Equities                                            5.00
Quantitative Management Associates                   2.86          Acadian Asset Management                                     1.12
WestEnd Advisors                                     2.28          Analytic Investors Inc                                       1.02
Global Developed Markets Equities                   14.00          Capital International                                        1.28
Hexavest                                             3.46          JPMorgan Asset Management                                    1.58
Intech Investment Management                         2.89          Pacific Basin Ex-Japan Equities                              3.50
Janus Capital Group                                  2.60          Capital International                                        0.98
Tradewinds                                           1.73          Lloyd George Investment Management                           1.40
Wellington Management Co. Int. Value                 3.32          Maple-Brown Abbott Limited                                   1.12
Europe Ex-UK Equities                               10.00          Emerging Markets Equities                                    3.50
Acadian Asset Management                             3.67          Artisan Partners                                             0.71
Metropole Gestion                                    1.74          JO Hambro Capital Management                                 0.36
TT International                                     2.55          Lazard Asset Management                                      0.50
Wellington Management Company                        2.04          Neuberger Berman                                             0.50
                                                                   PanAgora Asset Management                                    0.71
                                                                   The Boston Company Asset Management                          0.71


                                                              49
Canada Life / SEI Manager-of-Managers Fund                                                                   Quarter 1, 2011


CL SEI Global Developed Markets Equity Fund                                                                                     P
                                                                                                                Low   Medium    High


Investment Objective and Strategy                                     Fund Performance
The investment objective of the Global Developed Markets                 Q1 11           1 Yr   2 Yr p.a   3 Yr p.a     4 Yr p.a
Equity Fund is to achieve capital appreciation by investing
                                                                          -2.4%        6.2%     25.1%       -2.6%        -9.0%
primarily in equity securities of issuers located in developed
countries. Following a manager-of-managers approach, the
fund’s assets are diversified across specialist sub-advisers.

Fund Benchmark
MSCI World Index


Top 10 Holdings %                                                     Country Allocation %
 Exxon Mobil Corp.                                     1.28           United States                                       47.2
 Microsoft Corp.                                       1.11           Japan                                               11.1
 Eli Lilly & Co.                                       0.93           United Kingdom                                      8.0
 HSBC Holdings Plc                                     0.9            Canada                                              4.3
 General Electric Co.                                  0.83           Germany                                             4.0
 Pfizer Inc.                                           0.82           Switzerland                                         3.9
 International Business Machines Corp.                 0.81           France                                              3.9
 Wells Fargo & Co.                                     0.79           Australia                                           1.8
 Newmont Mining Corp.                                  0.74           Norway                                              1.6
 JPMorgan Chase & Co.                                  0.73           Hong Kong                                           1.6
 Total                                                 8.94           Other                                               12.6


Underlying Managers                                                   Sector Weighting %
 Hexavest                                              24.7           Financials                                          17.1
 Wellington Management Company International Value     23.7           Industrials                                         13.3
 Intech Investment Management                          20.6           Consumer Discretionary                              12.1
 Janus Capital Management                              18.6           Energy                                              10.2
 Tradewinds Global Investors                           12.4           Information Technology                              10.0
 Fund Total                                          100.00           Health Care                                         10.0
                                                                      Materials                                           9.8
                                                                      Consumer Staples                                    7.8
                                                                      Telecoms                                            5.9
                                                                      Utilities                                           3.9


Market Capitalisation Breakdown (USD) Weight (%)
 Greater than 50 Billion                               28.6
 Between 20 and 50 Billion                             25.7
 Between 10 and 20 Billion                             19.4
 Between 1 and 10 Billion                              24.6
 Less than 1 Billion                                   1.7


                                                                 50
Canada Life / SEI Manager-of-Managers Fund                                                                  Quarter 1, 2011


CL SEI European (Ex-UK) Equity Fund                                                                                            P
                                                                                                               Low   Medium    High


Investment Objective and Strategy                                    Fund Performance
The fund aims to achieve long-term capital growth and                   Q1 11           1 Yr   2 Yr p.a   3 Yr p.a     4 Yr p.a
income by investing in a broadly diversified portfolio of
                                                                         1.7%         8.3%     28.9%       -3.1%        -5.6%
European equity securities. Following a manager-of-managers
approach, the fund’s assets are diversified across specialist
sub-advisers.

Fund Benchmark
MSCI Europe EX-UK index


Top 10 Holdings %                                                    Country Allocation %
 BNP Paribas S.A.                                    2.6             France                                              26.1
 Total S.A.                                          2.4             Germany                                             21.6
 Basf SE                                             1.8             Switzerland                                         12.2
 Sanofi-Aventis S.A.                                 1.7             Sweden                                              8.6
 Novartis AG                                         1.5             Italy                                               6.8
 Daimler AG                                          1.4             Netherlands                                         4.9
 Sap AG                                              1.3             Norway                                              3.4
 Unicredit S.P
             .A.                                     1.3             Spain                                               3.3
 Heineken N.V.                                       1.3             Denmark                                             2.8
 Capgemini                                           1.2             Finland                                             2.5
 Total                                               16.4            Other                                               7.8


Underlying Managers                                                  Sector Weighting %
 Acadian Asset Management                            36.7            Industrials                                         21.7
 TT International                                    25.5            Financials                                          15.7
 Wellington Management Company                       20.4            Consumer Discretionary                              14.8
 Metropole Gestion                                   17.4            Consumer Staples                                    10.9
 Fund Total                                         100.00           Materials                                           10.5
                                                                     Information Technology                              7.9
                                                                     Health Care                                         7.8
                                                                     Energy                                              5.9
                                                                     Telecomm Services                                   2.7
                                                                     Utilities                                           2.2


Market Capitalisation Breakdown (USD) Weight (%)
 Greater than 50 Billion                             22.7
 Between 20 and 50 Billion                           12.8
 Between 10 and 20 Billion                           15.0
 Between 1 and 10 Billion                            43.2
 Less than 1 Billion                                 6.3


                                                                51
Canada Life / SEI Manager-of-Managers Fund                                                                   Quarter 1, 2011


CL SEI US Equity Fund                                                                                                           P
                                                                                                                Low   Medium    High


Investment Objective and Strategy                                     Fund Performance
The SEI US Large Companies Fund aims to provide long-                    Q1 11           1 Yr   2 Yr p.a   3 Yr p.a     4 Yr p.a
term capital growth and income by investing primarily in a
                                                                          -0.1%        7.7%     23.8%       3.1%         -3.7%
broadly diversified portfolio of US equity securities of large
companies. Following a manager-of-managers approach, the
fund’s assets are diversified across specialist sub-advisers.

Fund Benchmark
Russell 1000 Index


Top 10 Holdings %                                                     Sector Weighting %
 Apple Inc.                                            2.6            Information Technology                              24.6
 JPMorgan Chase & Co.                                  1.7            Financials                                          15.1
 Chevron Corp.                                         1.7            Health Care                                         13.3
 Qualcomm Inc.                                         1.7            Consumer Discretionary                              12.0
 Wells Fargo & Co.                                     1.5            Energy                                              10.8
 Microsoft Corp.                                       1.5            Industrials                                         9.3
 AT&T Inc.                                             1.3            Consumer Staples                                    6.4
 Conocophillips                                        1.2            Materials                                           3.1
 Pfizer Inc.                                           1.1            Telecomm Services                                   2.8
 Procter & Gamble Co.                                  1.1            Utilities                                           2.5
 Total                                                 15.6


Underlying Managers
 Aronson & Johnson & Ortiz                             15.8
 LSV Asset Management                                  15.8
 Legg Mason - Growth Equity                            11.2
 Brown Investment Advisory                             10.2
 Neuberger Berman                                      10.2
 Quantitative Management Associates                    10.2
 Delaware Investments                                  9.2
 Legg Mason - Value Equity                             9.2
 WestEnd Advisors                                      8.2
 Fund Total                                          100.00


Market Capitalisation Breakdown (USD) Weight (%)
 Greater than 50 Billion                               34.3
 Between 20 and 50 Billion                             26.1
 Between 10 and 20 Billion                             19.2
 Between 1 and 10 Billion                              20.2
 Less than 1 Billion                                   0.3


                                                                 52
Canada Life / SEI Manager-of-Managers Fund                                                               Quarter 1, 2011


CL SEI UK Equity Fund                                                                                                       P
                                                                                                            Low   Medium    High


Investment Objective and Strategy                                 Fund Performance
The SEI UK Equity Fund aims to achieve long-term capital             Q1 11           1 Yr   2 Yr p.a   3 Yr p.a     4 Yr p.a
growth and income by investing primarily in a broadly
                                                                      -2.5%        6.9%     28.8%       -1.7%        -8.7%
diversified portfolio of UK equity securities. Following a
manager-of managers approach, the fund’s assets are
diversified across specialist sub-advisers.

Fund Benchmark
FTSE All Share Index


Top 10 Holdings %                                                 Sector Weighting %
 Vodafone Group Plc                                   4.0         Financials                                          19.3
 Rio Tinto Plc                                        3.4         Industrials                                         15.4
 BP Plc                                               3.1         Energy                                              14.0
 BGGroup Plc                                          3.0         Materials                                           12.8
 HSBC Holdings Plc                                    2.7         Consumer Discretionary                              11.8
 Glaxosmithkline Plc                                  2.6         Consumer Staples                                    9.2
 Astrazeneca Plc                                      2.5         Health Care                                         6.2
 Royal Dutch Shell Plc (Cl B)                         2.4         Telecomm Services                                   5.4
 BHP Billiton Plc                                     2.3         Information Technology                              4.5
 Barclays Plc                                         2.0         Utilities                                           1.5
 Total                                                28.0


Underlying Managers
 Jupiter Asset Management                             20.4
 Invesco Asset Management                             19.4
 Mirabaud Investment Management                       19.4
 L.A Capital Management                               17.9
 Investec Asset Management                            12.8
 Standard Life Investments                            10.2
 Fund Total                                         100.00


Market Capitalisation Breakdown (USD) Weight (%)
 Greater than 50 Billion                              35.4
 Between 20 and 50 Billion                            11.7
 Between 10 and 20 Billion                            8.7
 Between 1 and 10 Billion                             40.1
 Less than 1 Billion                                  4.1


                                                             53
Canada Life / SEI Manager-of-Managers Fund                                                                       Quarter 1, 2011


CL SEI Pacific Basin (Ex-Japan) Equity Fund                                                                                         P
                                                                                                                    Low   Medium    High


Investment Objective and Strategy                                         Fund Performance
The SEI Pacific Basin (ex-Japan) Equity Fund aims to achieve                 Q1 11           1 Yr   2 Yr p.a   3 Yr p.a     4 Yr p.a
long-term growth of capital and income by investing primarily in
                                                                              -4.5%        7.7%     35.6%       8.1%          2.7%
a broadly diversified portfolio of Pacific Basin (ex-Japan) equity
securities. Following a manager-of-managers approach, the
fund’s assets are diversified across specialist sub-advisers.

Fund Benchmark
MSCI Pacific ex Japan Index


Top 10 Holdings %                                                         Country Allocation %
 BHP Billiton Ltd.                                        7.6             Australia                                           56.3
 Westpac Banking Corp.                                    4.4             Hong Kong                                           23.5
 National Australia Bank Ltd.                             4.3             Singapore                                           8.8
 Australia & New Zealand Banking Group Ltd.               4.1             China                                               4.0
 Rio Tinto Ltd.                                           3.5             United Kingdom                                      2.5
 DBS Group Holdings Ltd.                                  3.2             Korea                                               2.2
 Commonwealth Bank Of Australia                           2.3             Taiwan                                              1.3
 Wesfarmers Ltd.                                          1.9             Thailand                                            0.5
 Oil Search Ltd.                                          1.8             Malaysia                                            0.3
 Cheung Kong (Holdings) Ltd.                              1.8             New Zealand                                         0.3
 Total                                                   34.7             Canada                                              0.3


Underlying Managers                                                       Sector Weighting %
 Lloyd George Investments Management                     40.0             Financials                                          42.3
 Maple-Brown Abbott                                      32.0             Materials                                           16.8
 Capital International                                   28.0             Industrials                                         9.4
 Fund Total                                             100.00            Consumer Discretionary                              7.4
                                                                          Consumer Staples                                    7.1
                                                                          Energy                                              6.1
                                                                          Information Technology                              4.3
                                                                          Telecomm Services                                   3.0
                                                                          Health Care                                         2.5
                                                                          Utilities                                           1.2


Market Capitalisation Breakdown (USD) Weight (%)
 Greater than 50 Billion                                 28.7
 Between 20 and 50 Billion                               15.7
 Between 10 and 20 Billion                               21.2
 Between 1 and 10 Billion                                33.0
 Less than 1 Billion                                      1.5


                                                                     54
Canada Life / SEI Manager-of-Managers Fund                                                                    Quarter 1, 2011


CL SEI Japan Equity Fund                                                                                                         P
                                                                                                                 Low   Medium    High


Investment Objective and Strategy                                      Fund Performance
The investment objective of the SEI Japan Equity Fund is to               Q1 11           1 Yr   2 Yr p.a   3 Yr p.a     4 Yr p.a
achieve long-term growth of capital and income by investing
                                                                           -9.2%        -1.2%    15.3%       -2.5%        -10.0%
primarily in a broadly diversified portfolio of Japanese equity
securities. Following a manager-of-managers approach, the
fund’s assets are diversified across specialist sub-advisers.

Fund Benchmark
TOPIX


Top 10 Holdings %                                                      Sector Weighting %
 Sumitomo Mitsui Financial Group Inc.                   2.8            Industrials                                         23.0
 Toyota Motor Corp.                                     2.4            Financials                                          18.9
 Nippon Telegraph & Telephone Corp.                     2.0            Consumer Discretionary                              17.1
 Astellas Pharma Inc.                                   1.9            Information Technology                              15.7
 Sumitomo Corp.                                         1.9            Materials                                           6.1
 Mitsubishi UFJ Financial Group Inc.                    1.9            Health Care                                         5.9
 Nissan Motor Co. Ltd.                                  1.7            Consumer Staples                                    4.7
 Mitsui & Co. Ltd.                                      1.5            Telecomm Services                                   4.1
 Softbank Corp.                                         1.5            Energy                                              2.7
 Marubeni Corp.                                         1.5            Utilities                                           1.9
 Total                                                 19.0


Underlying Managers
 JPMorgan Asset Management                             31.6
 Capital International                                 25.5
 Acadian Asset Management                              22.5
 Analytic Investors                                    20.4
 Fund Total                                           100.00


Market Capitalisation Breakdown (USD) Weight (%)
 Greater than 50 Billion                                8.6
 Between 20 and 50 Billion                             17.8
 Between 10 and 20 Billion                             21.4
 Between 1 and 10 Billion                              44.6
 Less than 1 Billion                                    7.6


                                                                  55
Canada Life / SEI Manager-of-Managers Fund                                                                  Quarter 1, 2011


CL SEI Emerging Markets Equity Fund                                                                                            P
                                                                                                               Low   Medium    High


Investment Objective and Strategy                                    Fund Performance
The SEI Emerging Markets Equity Fund aims to achieve                    Q1 11           1 Yr   2 Yr p.a   3 Yr p.a     4 Yr p.a
capital appreciation by investing primarily in securities of
                                                                         -5.3%        9.2%     37.5%       5.3%          3.4%
emerging market issuers. Following a manager-of-managers
approach, the fund’s assets are diversified across specialist
sub-advisers.

Fund Benchmark
MSCI Emerging Markets Index


Top 10 Holdings %                                                    Country Allocation %
 Samsung Electronics Co. Ltd.                         3.0            Brazil                                              16.2
 Gazprom OaO ADS                                      1.3            China                                               15.8
 MTN Group Ltd.                                       1.3            Korea                                               12.7
 China Mobile Ltd.                                    1.1            Taiwan                                              10.4
 Taiwan Semiconductor Manufacturing Co. Ltd.          1.0            Russia                                              8.0
 Petrobras Petroleo Brasileiro (Ord)                  1.0            India                                               7.1
 HTC Corp.                                            0.9            South Africa                                        7.1
 Lukoil Holdings ADS                                  0.8            Mexico                                              3.6
 Hyundai Mobis Co. Ltd.                               0.8            Indonesia                                           2.7
 Standard Bank Group Ltd.                             0.8            Turkey                                              2.4
 Total                                                12.0           Other                                               14.0


Underlying Managers                                                  Sector Weighting %
 Artisan Partners                                     20.4           Financials                                          21.6
 PanAgora Asset Management                            20.4           Information Technology                              14.5
 The Boston Company Asset Management                  20.4           Energy                                              14.0
 Lazard Asset Management                              14.3           Materials                                           13.5
 Neuberger Berman                                     14.3           Consumer Discretionary                              10.4
 JO Hambro Capital Management                         10.2           Industrials                                         8.6
 Fund Total                                         100.00           Telecomm Services                                   7.3
                                                                     Consumer Staples                                    5.4
                                                                     Health Care                                         2.9
                                                                     Utilities                                           1.9


Market Capitalisation Breakdown (USD) Weight (%)
 Greater than 50 Billion                              11.2
 Between 20 and 50 Billion                            11.7
 Between 10 and 20 Billion                            8.3
 Between 1 and 10 Billion                             58.6
 Less than 1 Billion                                  10.2


                                                                56
Canada Life / SEI Manager-of-Managers Fund                                                                 Quarter 1, 2011


CL SEI Global Fixed Income Fund                                                                               P
                                                                                                              Low   Medium    High


Investment Objective and Strategy                                     Fund Performance
The SEI Global Fixed Income Fund aims to generate current                  Q1 11       1 Yr   2 Yr p.a   3 Yr p.a     4 Yr p.a
income and exhibit principal volatility similar to that of the
                                                                           -0.8%       1.4%    6.1%       1.1%          0.6%
global developed fixed income market as a whole. Following
a manager-of-managers approach, the fund’s assets are
diversified across specialist sub-advisers

Fund Benchmark
Lehman Global Aggregate Index


Top 10 Holdings %                                                     Country Allocation %
 BUNDESREPUB DEUT 3.50% 1/4/16                          2.2           Euro                                              27.9
 JAPAN-86 0.6% 09/20/14 /JPY/                           2.0           Japan                                             23.4
 JAPAN-113 2.1% 09/20/29 /JPY/                          1.6           USA                                               20.9
 JAPAN-112 2.1% 06/20/29 /JPY/                          1.5           Other                                             15.1
 US TREAS NTS 3.5% 05/15/20                             1.5           UK                                                8.7
 JAPAN-79 0.7% 12/20/13 /JPY/                           1.3           Canada                                            4.1
 EUROPEAN IN 3.875%10/15/16/EUR                         1.3
 JAPAN-304 1.3% 09/20/19 /JPY/                          1.2
 BONOS Y O 5.5% 04/30/21 /EUR/                          1.2
 JAPAN GOV 2.5% 12/21/20/JPY/                           1.1
 Total                                                 14.8


Underlying Managers                                                   Quality Allocation %
 AllianceBernstein                                    32.00           Treasury                                          82.8
 First International Advisors                         28.00           Agency                                            8.2
 Wellington Management Company                        24.00           Credit                                            6.5
 UBS Global Asset Management                          16.00           Collateralized                                    1.2
 Fund Total                                           100.00          Cash                                              1.3


Quality Exposure %
 Aaa and Treasury                                      53.4
 Aa                                                    32.9
 A                                                      5.9
 Baa                                                    4.4
 Ba and Below                                           3.3


                                                                 57
Canada Life / SEI Manager-of-Managers Fund                                                                 Quarter 1, 2011


CL SEI Global Opportunistic Fixed Income Fund                                                                 P
                                                                                                              Low   Medium   High


Investment Objective and Strategy                                     Fund Performance
The SEI Global Opportunistic Fixed Income Fund aims to                     Q1 11       1 Yr   2 Yr p.a   3 Yr p.a     4 Yr p.a
generate current income consistent with the preservation of
                                                                           -0.1%       3.2%    9.6%       3.1%          2.7%
capital by investing primarily in global fixed income markets.
Following a manager-of-managers approach, the fund’s
assets are diversified across specialist sub-advisers.

Fund Benchmark
Lehman Global Aggregate Hedged Index


Top 10 Holdings %                                                     Country Allocation %
 FGLMC PA90761 4.50% 01/01/40                          2.3            USA                                               59.3
 FREDDIE MAC GOLD POOL                                 1.1            Euro                                              26.4
 CANADA GOVT 3.75% 6/1/19 /CAD/                        1.1            UK                                                6.9
 US TREAS NTS 2.5% 03/31/15                            0.9            Canada                                            2.9
 BUNDESREP 2.5% 01/04/21 /EUR/                         0.8            Other                                             2.4
 FEDERAL NATL MTG ASSN FR 2.625%112014                 0.7            Japan                                             2.1
 FNMA PMA0023 5.00% 04/01/29                           0.7
 GENERAL ELEC C 5.625% 05/01/18                        0.7
 FGLMC PG12491 5.00% 01/01/22                          0.7
 FNMA PAD0470 5.00% 02/01/49                           0.6
 Total                                                 9.5


Underlying Managers                                                   Market Value Weighting %
 TCW Investment Management Company                     24.3           Treasury                                          12.5
 Wellington Management Company                         21.8           Agency                                            16.0
 DB Advisors                                           20.3           Credit                                            35.3
 Jennison Associates                                   18.0           Collateralized                                    37.7
 Schroders Investment Management                       15.6           Cash                                              -1.4
 Fund Total                                          100.00


Quality Exposure %
 Aaa and Treasury                                      54.1
 A                                                     17.1
 Baa                                                   14.3
 Aa                                                    12.0
 Ba and Below                                          2.5


                                                                 58
Canada Life / Morgan Stanley Pension European Property Fund                                                                                      Quarter 1, 2011


Fund Description

The Canada Life/Morgan Stanley European Property Fund                                provides a highly efficient and cost-effective way of gaining
allows investors to access the potential returns available                           such exposure. As an asset class, real estate can provide
from the European commercial property market in one                                  important advantages to investors: historically low volatility
diversified fund. The fund invests in a professionally managed                        relative to equities, attractive returns and a low correlation to
portfolio of European property companies and is managed by                           other asset classes.
a team of property experts at Morgan Stanley with over 40
years of collective experience of real estate markets.

Real estate securities are indirect investments in property
whose long-term returns depend on the underlying real
estate market. Broad geographic and sector diversification
would be prohibitively expensive for a direct real estate
investor. However, an indirect real estate portfolio structure


Top 10 Holdings                                                                      Fund Performance to 31/03/11

 Company                                                      %                       Q1 2011                                                          4.4%
 Unibail-Rodamco SE                                           10.22                   1 Year                                                          11.7%
 Land Securities PLC                                          5.31                    2 Year p.a                                                      42.6%
 Klepierre                                                    5.27                    3 Year p.a                                                       -7.5%
 PSP Swiss Property AG                                        4.54                   Source: Moneymate. Performance is net of management fees.

 Icade                                                        4.54
 Hammerson PLC                                                4.46
 British Land Co. Ltd                                         4.07
 Gecina                                                       3.60
 Beni Stabili SPA                                             3.04
 Corio NV                                                     3.01
 Total                                                        48.06


Equity Geographic Distribution

                    Finland Switzerland
                    1.85%     6.37%
           Sweden
            4.67%                           UK
      Italy
     3.04%                                37.90%
  Belgium
   1.35%


      France
      30.42%                         Netherlands
                     Austria           7.06%
                     2.38% Cash & equivalents
                          Germany 1.94%
                            3.02%


      Warning: Past performance is not a reliable guide to future performance. The value of your investment may go down as
                well as up. The Canada Life/Morgan Stanley European Property Fund was launched on 30/7/07.


Important Information:
This fact sheet does not form part of any contract. The information contained in this document is based on current legislation and is, therefore, subject to change.
The contents are intended as a guideline only and should not be construed as an interpretation of the law. For full details of all our products, please refer to the
specific product policy conditions. You should always seek advice of an appropriately qualified professional. Canada Life Assurance (Ireland) Limited is regulated
by the Central Bank of Ireland.
                                                                                59
Canada Life / BlackRock Pension Managed Fund                                                                                                               Quarter 1, 2011


Fund Description

The Canada Life/Blackrock Pensions Managed Fund invests                                   The Global Allocation Fund seeks to maximise total return.
in both bonds and equities worldwide. The fund follows an                                 The fund invests globally in equity, debt, and short-term
asset allocation policy, which seeks to maximise returns                                  securities of both corporate and governmental issuers, with
while managing the risk in euro terms. The Canada Life/                                   no prescribed limits. The fund generally will seek to invest
Blackrock Pensions Managed Fund invests 100% in the                                       in securities that are, in the opinion of the investment
Blackrock Global Allocation Fund, which is run by Blackrock                               advisor, undervalued. The fund may also invest in the equity
Investment Managers. Blackrock Investment Managers                                        securities of small and emerging growth companies. The
is one of the world’s largest investment management                                       fund may also invest a portion of its debt portfolio in high-
organisations.                                                                            yield fixed income transferable securities. Currency exposure
                                                                                          is flexibly managed.


Top 10 Holdings                                                                           Fund Performance to 31/03/11
                                                                                          %        Q1 2011        1 yr p.a      3 yr p.a        5 yr p.a
 Company                                                                     %
                                                                                          12
 SPDR Gold Trust                                                             1.4
                                                                                          10
 Exxon Mobil                                                                 1.3
                                                                                           8
 Apple                                                                       1.0
                                                                                           6
 Microsoft                                                                   0.8
                                                                                           4
 Petrobras                                                                   0.8
                                                                                           2
 Chevron Corp                                                                0.7
                                                                                           0
 General Electric                                                            0.7
                                                                                          -2
 International Business Machines Corp.                                       0.7
                                                                                          -4
 AT&T                                                                        0.6
                                                                                          -6
 Bristol-Myers Squibb                                                        0.6
 Total                                                                       8.6                     Canada Life/BlackRock Pension Managed Fund

                                                                                                     Average Managed Fund (Mercer Survey)


Asset Distribution                                      Regional Distribution                                                Equity Sectoral Distribution
                                                                          Asia/Pacific                                                     Consumer
                                                                        (ex Japan) Equity Asia/Pacifc                                                   Other
                                                                                                                                          Discretionary
                                                                              2.7%       (ex Japan) Bonds                                               2.4%
                             Cash                                                              2.1%                                 Consumer 5.9%                   Energy
                             7.3%                                 Europe Bonds                                                        Staples
                                                                       4.8%                      Japan Bonds                                                        16.5%
                                                                                                     0.3%                              6.0%
  Fixed Income                                                Japan Equity
      25.9%                                                      6.2%                                                          Industrials
                                                                                                          North America           8.6%
                                                       Emerging Market                                        Equity
                                                           Bonds                                                                                                             Financials
                                                                                                              38.8%
                                                            6.8%                                                                                                               13.9%
                                                                 Cash                                                          Healthcare
                                                                 7.3%                                                            9.9%

                                      Equity                 Europe Equity
                                                                                                                                                                         Materials
                                      66.8%                      8.5%                                                         Utilities / Telecoms                        13.1%
                                                                                                                                      11.0%
                                                                    Emerging Market Equity North America Bonds                                        Information
                                                                           10.7%                  11.8%                                                Technology
                                                                                                                                                         12.7%


                                    Warning: Past performance is not a reliable guide to future performance.
                                           The value of your investment may go down as well as up.

Important Information:
This fact sheet does not form part of any contract. The information contained in this document is based on current legislation and is, therefore, subject to change.
The contents are intended as a guideline only and should not be construed as an interpretation of the law. For full details of all our products, please refer to
the specific product policy conditions. You should always seek advice of an appropriately qualified professional. BlackRock Investment Managers (UK) Limited is
authorised and regulated by the Central Bank of Ireland. Canada Life Assurance (Ireland) Limited is regulated by the Central Bank of Ireland.
                                                                                     60
Canada Life / Merrion Managed Fund                                                                                                                       Quarter 1, 2011


Fund Description

The Canada Life/Merrion Managed Fund is managed by
Merrion Investment Managers. The fund is designed to
provide balanced long term growth by actively managing the
distribution of the portfolio between cash, bonds, equities
and property according to economic conditions.

The fund maintains an average market weight in property
through its exposure to Canada Life’s Property Fund while
the remainder of the fund is invested in Merrion Investment
Managers’ Managed Fund thus providing broad diversification
in quality equities, bonds, property and cash.


Top 10 Holdings                                                                       Fund Performance to 31/03/11
                                                                                                  Q1 2011           1 yr p.a            3 yr p.a
 Canada Life/Merrion Managed Fund                             %                       %
                                                                                       6
 iShares MSCI World                                           3.0
                                                                                       5
 iShares MSCI Emerging Markets                                1.7
                                                                                       4
 Financial Select Sector SPDR                                 1.3
                                                                                       3
 Siemens                                                      1.2
                                                                                       2
 Microsoft                                                    1.1
                                                                                       1
 CRH                                                          1.1
                                                                                       0
 iShares MSCI Pacific ex Japan                                 1.1
                                                                                      -1
 iShares MSCI Japan                                           1.0
                                                                                      -2
 ChevronTexaco                                                1.0
                                                                                      -3
 iShares MSCI Asia ex Japan                                   1.0
                                                                                                 Canada Life/Merrion Managed Fund

                                                                                                 Average Managed Fund (Mercer Survey)


                                                                                      The Canada Life/Merrion Managed Fund was launched on 1/10/07. Source: Merrion & Mercer
                                                                                      Pooled Fund Survey. Performance is net of management fees.


Asset Distribution                                        Equity Geographic Distribution                                 Equity Sectoral Distribution

                        Property                                           Ireland                                                               Utilities Consumer
                         5.0%                                                          Pacific Basin                                     Telecoms 1.8% Discretionary
                                 Cash                                       7.5%
                                                                                           9.7%                                            3.5%              8.3%
                                 11.6%                              UK                                                         Information                        Consumer
                                                                   12.4%                                                        Technology
                                                                                                       Japan                                                        Staples
                                                                                                                                  11.4%                              5.7%
                                                                                                       8.0%
                                         Fixed Interest
                                             11.1%                                                                                                                      Energy
                                                                                                                                                                        13.7%
                                                                                                                          Industrials
                                                                                                                            26.9%
   Equities
    72.3%                                                          US                              Europe
                                                                  34.7%                            27.7%
                                                                                                                                                                Financials
                                                                                                                                                   Healthcare     20.5%
                                                                                                                                                     8.2%


                                    Warning: Past performance is not a reliable guide to future performance.
                                           The value of your investment may go down as well as up.

Important Information:
This fact sheet does not form part of any contract. The information contained in this document is based on current legislation and is, therefore, subject to change.
The contents are intended as a guideline only and should not be construed as an interpretation of the law. For full details of all our products, please refer to the
specific product policy conditions. You should always seek advice of an appropriately qualified professional. Merrion Capital Investment Managers Limited (trading
as Merrion Investment Managers) is regulated by the Central Bank of Ireland. Canada Life Assurance (Ireland) Limited is regulated by the Central Bank of Ireland.
                                                                                 61
March 2011 Fund Performance as of 31/03/11
Life Investment Funds (Gross Tax Basis)
 Name                                                                     1 Month        3 Month        YTD         1 Year      3 yr p.a.     5 yr p.a.     7 yr p.a.   10 yr p.a.
 Canada Life/Setanta Life UWP Fund                                         0.00%         0.00%      0.00%           0.00%         0.18%        0.50%         0.65%        1.74%
 Canada Life/SEI US Equity Fund                                            -2.87%        -0.24%     -0.24%          7.22%         2.70%           --            --           --
 Canada Life/SEI UK Equity Fund                                            -5.19%        -2.60%     -2.60%          6.43%        -2.02%           --            --           --
 Canada Life/SEI Pacific Basin Equity Fund                                 -1.41%        -4.66%     -4.66%          7.12%         7.62%           --            --           --
 Canada Life/SEI Japan Equity Fund                                         -11.02%       -9.22%     -9.22%         -1.72%        -2.89%           --            --           --
 Canada Life/SEI Global Opportunistic Fixed Income Fund                    -0.18%        -0.18%     -0.18%          2.68%         2.65%           --            --           --
 Canada Life/SEI Global Fixed Income Fund                                  -0.19%        -0.96%     -0.96%          0.88%         0.62%           --            --           --
 Canada Life/SEI Global Equity Fund                                        -3.78%        -2.41%    -2.41%           5.68%        -3.01%           --            --           --
 Canada Life/SEI Global Balanced Fund                                      -2.16%        -1.09%    -1.09%           6.06%         2.16%        -1.26%           --           --
 Canada Life/SEI European Equity Fund                                      -1.21%        1.61%      1.61%           7.75%        -3.55%           --            --           --
 Canada Life/SEI Emerging Markets Equity Fund                              2.22%         -5.52%    -5.52%           8.71%        4.86%            --            --           --
 Canada Life Quadrivium Fund                                               -0.60%        1.34%      1.34%           8.34%        -3.09%           --            --           --
 Canada Life/Morgan Stanley European Property Fund                         -0.16%        4.36%      4.36%          11.67%        -7.50%           --            --           --
 Canada Life/Merrion Managed Fund                                          -2.64%        -2.74%    -2.74%           1.32%        -1.23%           --            --           --
 Canada Life/Setanta Equity Dividend Distributing Fund                     -0.62%        3.07%      3.07%           6.16%        -2.79%        -5.10%        0.27%           --
 Canada Life/Setanta Equity Dividend Non Distributing Fund                 -0.67%        3.06%      3.06%          10.79%        2.28%         -0.46%        4.93%           --
 Canada Life/Setanta Balanced Dividend Non Distributing Fund               -0.62%        1.64%      1.64%           6.61%        3.76%         1.36%         4.61%           --
 Canada Life/Setanta Balanced Dividend Distributing Fund                   -0.60%        1.57%      1.57%           2.19%        -1.01%        -3.07%        0.16%           --
 Canada Life/Setanta Strategic Growth Fund                                 -1.96%        0.00%      0.00%           2.46%        0.46%         -1.67%        2.74%        0.57%
 Canada Life Property Fund                                                 0.09%         -1.60%    -1.60%          -4.81%       -19.30%       -11.42%        -4.53%       -1.09%
 Canada Life/Setanta Irish Equity Fund                                     -4.15%        -3.21%    -3.21%           4.53%        -8.07%        -8.10%        0.54%        1.07%
 Canada Life/Setanta Global Opportunity Fund                               -2.68%        -0.32%    -0.32%           4.66%        2.40%         -0.99%        4.26%        0.58%
 Canada Life/Setanta Focus 15 Fund                                         -3.49%        -1.13%    -1.13%          10.88%        11.18%        3.43%         6.52%        -0.15%
 Canada Life/Setanta Fixed Interest Fund                                   -0.59%        -0.93%    -0.93%          -7.26%        1.25%         0.97%         1.58%        2.69%
 Canada Life/Setanta European Equity Fund                                  -4.20%        -0.80%    -0.80%          2.19%         -0.36%        -2.45%        4.18%        -0.10%
 Canada Life/Setanta Cash Fund                                             -0.07%        -0.14%    -0.14%          -0.61%        0.69%         1.32%         1.13%        1.32%
 Canada Life/Setanta Balanced Fund                                         -1.54%        -0.67%    -0.67%          -1.18%        -0.78%        -2.06%        1.60%        0.85%
These funds relate only to unit linked investment policies that commenced after 01/01/2001.


Life Investment Funds (Net Tax Basis)
 Name                                             1 Month        3 Month           YTD         1 Year         3 yr p.a.      5 yr p.a.      7 yr p.a.     10 yr p.a.    15 yr p.a.
 Canada Life With Profit Fund                       0.00%         0.00%         0.00%          0.00%           0.00%          0.00%          0.00%         0.79%            --
 Canada Life SSGA Master Client                    -2.50%         -1.25%        -1.25%         1.28%          -1.15%         -3.48%          0.84%         0.81%         4.57%
 Canada Life SSGA Managed                          -2.51%         -1.25%        -1.25%         1.28%          -1.15%         -3.48%          0.84%         0.81%         4.58%
 Canada Life Property Fund                          0.06%         -1.30%        -1.30%        -4.42%          -15.94%        -9.35%         -3.25%         -0.33%        4.95%
 Canada Life Pacific Equity Fund                   -0.91%         -2.89%        -2.89%        10.89%           6.25%          4.59%          6.65%         5.08%         3.26%
 Canada Life Money Fund                            -0.05%         -0.07%        -0.07%        -0.25%           0.79%          1.32%          1.16%         1.28%         1.72%
 Canada Life Managed Fund                          -1.76%         -0.29%        -0.29%         1.97%           0.76%         -0.85%          2.76%         1.20%         4.80%
 Canada Life Leading Companies Fund                -2.20%         -0.14%        -0.14%         4.59%           1.96%         -0.71%          3.53%         0.75%         4.64%
 Canada Life Irish Equity Fund                     -3.41%         -3.12%        -3.12%         4.24%          -6.82%         -6.74%          0.99%         1.56%         5.62%
 Canada Life International Equity Fund             -2.20%         -0.27%        -0.27%         5.23%           2.47%         -0.22%          3.75%         0.54%         4.52%
 Canada Life High Growth Managed Fund              -2.22%         -0.12%        -0.12%         4.58%           1.96%         -0.72%          3.53%         0.75%         4.58%
 Canada Life Growth Managed Fund                   -1.75%         -0.29%        -0.29%         1.98%           0.76%         -0.85%          2.77%         1.20%         4.80%
 Canada Life Gilt Fund                             -0.51%         -0.76%        -0.76%        -5.63%           1.38%          1.14%          1.65%         2.57%         4.01%
 Canada Life Gilt & Bond Fund                      -0.51%         -0.78%        -0.78%        -5.64%           1.39%          1.14%          1.65%         2.68%         4.07%
 Canada Life Focus 15 Fund                         -2.83%         -0.89%        -0.89%         9.22%           8.79%          2.63%          5.01%         -0.09%           --
 Canada Life European Equity Fund                  -3.41%         -0.77%        -0.77%        2.17%           -0.41%         -1.93%          3.24%         0.04%         4.62%
 Canada Life Cash Fund                             -0.07%         -0.11%        -0.11%        -0.27%           0.79%          1.32%          1.16%         1.31%         1.76%
 Canada Life Balanced Equity Fund                  -2.20%         -0.13%        -0.13%        4.59%            1.97%         -0.71%          3.53%         0.75%         4.65%


                                                                                         62
March 2011 Fund Performance as of 31/03/11
Pension Funds
Name                                                          1 Month      3 Month           YTD        1 Year        3 yr p.a.   5 yr p.a.     7 yr p.a.    10 yr p.a.   15 yr p.a.
Canada Life/Setanta MM Pension Overseas Fund                   -2.63%       -0.28%        -0.28%        5.89%          4.23%        0.31%         4.96%          0.04%      5.31%
Canada Life/SEI US Equity Fund                                 -2.92%       -0.12%        -0.12%        7.71%          3.15%           --             --           --          --
Canada Life/SEI UK Equity Fund                                 -5.11%       -2.56%        -2.56%        6.94%         -1.69%           --             --           --          --
Canada Life/SEI Pacific Basin Equity Fund                      -1.30%       -4.49%        -4.49%        7.73%          8.11%           --             --           --          --
Canada Life/SEI Japanese Equity Fund                          -11.08%       -9.19%        -9.19%        -1.23%        -2.52%           --             --           --          --
Canada Life/SEI Global Fixed Income Fund                       -0.10%       -0.86%        -0.86%        1.37%          1.08%           --             --           --          --
Canada Life/SEI Global Equity Fund                             -3.84%       -2.37%        -2.37%        6.21%         -2.62%           --             --           --          --
Canada Life/SEI Global Balanced Fund                           -2.29%       -1.21%        -1.21%        5.71%          1.90%           --             --           --          --
Canada Life/SEI European Equity Fund                           -1.18%        1.70%        1.70%         8.29%         -3.14%           --             --           --          --
Canada Life/SEI Emerging Markets Fund                          2.26%        -5.35%        -5.35%        9.21%          5.29%           --             --           --          --
Canada Life Quadrivium Fund                                    -0.55%        1.47%        1.47%         9.11%         -2.37%           --             --           --          --
Canada Life/Morgan Stanley European Property Fund              -0.16%        4.44%        4.44%        12.19%         -6.98%           --             --           --          --
Canada Life/Merrion Managed Fund                               -2.60%       -2.60%        -2.60%        1.85%         -0.18%           --             --           --          --
Canada Life/SEI Global Opportunistic Fixed Income              -0.09%       -0.09%        -0.09%        3.19%          3.09%           --             --           --          --
Canada Life/SSGA Pension Managed                               -3.27%       -1.55%        -1.55%        2.03%         -1.54%        -3.66%        1.23%          0.99%      5.22%
Canada Life/Setanta With Profit Fund                           0.00%         0.00%        0.00%         0.00%          1.26%         1.94%        2.24%          3.08%      4.83%
Canada Life/Setanta Pension Money Fund                         0.02%         0.07%        0.07%         0.21%          1.44%         2.08%        1.89%          2.07%      2.73%
Canada Life/Setanta Pension Managed Fund                       -1.82%        0.23%        0.23%         3.16%          1.62%        -0.38%        4.04%          2.07%      5.93%
Canada Life/Setanta Pension Equity Fund                        -2.62%       -0.11%        -0.11%        5.47%          3.13%        -0.26%        5.02%          1.37%      5.63%
Canada Life/Setanta Pension Fixed Interest Fund                -0.54%       -0.76%        -0.76%        -6.55%         2.06%         1.77%        2.38%          3.48%      5.33%
Canada Life/Setanta Consensus Fund                             -2.31%       -0.76%        -0.76%        4.38%         -0.91%        -2.66%        2.21%          0.59%         --
Canada Life/Setanta Pension Property Fund                      0.12%        -1.47%        -1.47%        -4.16%        -18.55%     -10.65%        -3.73%          -0.29%     6.07%
Canada Life/Setanta Passive Equity Fund                        -3.91%       -1.30%        -1.30%        6.43%          2.10%        -2.35%        2.08%            --          --
Canada Life/KBI Pension Managed Fund                           -1.84%       -0.64%        -0.64%        4.00%         -2.44%        -3.52%        1.91%          -0.06%        --
Canada Life/Setanta Pension Focus 15 Fund                      -3.32%       -0.89%        -0.89%       11.96%         12.20%         4.41%        7.54%          0.85%         --
Canada Life/Setanta Equity Dividend Fund                       -0.55%        3.29%        3.29%        11.64%          3.03%         0.29%        5.71%            --          --
Canada Life/Setanta Balanced Dividend Fund                     -0.54%        1.84%        1.84%         7.37%          4.52%         2.09%        5.34%            --          --
Canada Life/Blackrock Pension Managed Fund                     0.41%         3.47%        3.47%         9.94%          1.70%         4.49%        6.24%            --          --


Indices and Measures
Name                                       1 Month         3 Month           YTD             1 year       3 yr p.a.        5 yr p.a.        7 yr p.a.      10 yr p.a.     15 yr p.a.
ISEQ Overall Return                         0.30%           2.95%           2.95%            -6.50%        -20.62%         -16.00%           -5.41%         -3.69%         3.78%
Irish Inflation                             0.00%           0.00%           0.00%            0.00%         -1.93%           0.80%            1.37%          2.05%          2.37%
FTSE 100 Share Index (TR)                   1.74%           2.84%           2.84%            8.04%          4.78%           3.88%            8.32%          4.18%          6.65%
DJ EURO STOXX(50) TR                        -0.63%          6.37%           6.37%            2.71%         -4.34%           -2.15%           3.65%          -0.87%         6.60%
S&P 500 TR                                  2.15%           6.45%           6.45%            15.36%         1.33%           2.73%            4.45%          3.46%             --
MSCI The World Index (Gross TR)             0.29%           4.43%           4.43%            9.21%         -0.23%           0.73%            4.87%          2.74%          5.58%
Japan NIKKEI 225                            -9.72%          -5.09%          -5.09%         -13.66%         -8.46%          -10.66%           -2.61%         -2.88%         -5.18%
Hong K. Hang Seng Bank                      1.73%           3.33%           3.33%            10.52%         0.95%           8.53%            9.42%          6.43%          5.33%


                      All prices and performances are illustrated as at effective date 31st March 2011. Performance is illustrated on an offer-to-offer basis.
                      Warning: Past performance is not a reliable guide to future performance. The value of your investment may go down as well as up
                  This document does not form part of any contract. E&OE. Canada Life Assurance (Ireland) Limited is regulated by the Central Bank of Ireland.


                                                                                        63
Our Investment Partners
We partner with only the best investment fund managers to provide a full range of investment options for our clients.


Setanta Asset Management                                          Morgan Stanley
Setanta Asset Management Limited (“Setanta”) is the primary       Morgan Stanley Investment Management (MSIM) is a client-centric
asset manager for Canada Life in Ireland and other European       organisation dedicated to providing investment and risk-management
countries. Setanta was established in Dublin in 1998 and has      solutions to investors worldwide. With over three decades of asset
grown steadily since then, now managing €5.1bn (December          management experience, Morgan Stanley’s investment strategies span
2010) in assets for the Great-West Lifeco Inc group of            the risk/return spectrum across geographies, investment styles and asset
companies with clients in Ireland, Germany and Canada as          classes, including equity, fixed income, alternatives and private markets.
well other third-party institutions.                              MSIM comprises a community of specialised investment boutiques, each
                                                                  with a unique talent pool of experienced investment professionals backed by
Setanta specialises in active global equity management,           the broad reach, access and resources of Morgan Stanley.
investing in stocks on a fundamental basis, with a focus on
value and quality. Setanta has an experienced investment          As of 30th September, 2010, MSIM had more than 740 investment
team, who choose stocks within a global sector framework.         professionals worldwide who managed and supervised US$265 billion in
The team has a strong track record in its core global equity      assets for institutional and intermediary investors around the globe. With
style, and in other regional, country and specialist styles.      53 offices in 23 countries, Morgan Stanley is able to provide in-depth
                                                                  local knowledge and expertise while channelling the strengths of its global
Setanta offers investment on a segregated and on a pooled         presence and resources to deliver targeted investment solutions.
basis. It is the investment manager for a range of unit-linked
funds, which Canada Life policyholders in Ireland and Europe
may invest in. In addition Setanta has a number of specialist
                                                                  www.morganstanley.com
mutual funds available for professional investors, offering a
global equity, high-yield, covered call strategy, and a similar   Merrion Investment Managers
strategy which invests in companies which meet certain            In 2007, Canada Life announced the launch of the Canada Life/Merrion
ethical restrictions.                                             Managed fund and is delighted to welcome Merrion Investment Managers as
                                                                  a partner. Merrion Investment Managers, formerly Oppenheim Investment
www.setanta-asset.com                                             Managers, have built a reputation upon a proven approach to investment
                                                                  management that has delivered consistently strong performance - not only
                                                                  in years when markets have risen but also during periods when markets
SEI Investments (SEI)                                             have fallen. Merrion Investment Managers’ focus is on controlling risk, while
In 2005, SEI partnered with Canada Life and together              obtaining the maximum return available within the market.
introduced the Manager-of-Managers concept in Ireland
launching the SEI Manager-of-Manager Global Balanced Fund.        Merrion Investment Managers’ only business is asset management meaning
                                                                  that they are totally focused on delivering exceptional investment returns to
In 2006, Canada Life added another nine SEI Manager-of-           their clients.
Managers funds to our investment platform.

SEI Investments is a global leader in Manager-of-Managers
                                                                  www.merrion-investments.ie
with €129 billion (December 2010) under management
worldwide. It is one of the world’s leading providers of multi    BlackRock
manager investment products through their Manager-of-             BlackRock is one of the world’s preeminent asset management firms and
Managers offering, and has a strong track record of growth        a premier provider of global investment management, risk management
in Europe with a presence in the UK, Italy, Germany, The          and advisory services to institutional, intermediary and individual investors
Netherlands and France.                                           around the world. BlackRock offers a range of solutions - from rigorous
                                                                  fundamental and quantitative active management approaches aimed at
The Manager-of-Managers concept is a sophisticated                maximizing outperformance to highly efficient indexing strategies designed to
investment approach, which builds up a portfolio of the best      gain broad exposure to the world’s capital markets.
specialist investment managers around the world, rather
than a portfolio of individual stocks and bonds. The Manager-     BlackRock is a truly global enterprise that combines the benefits of world-
of-Managers, SEI, is responsible for the selection and            wide reach with localised service. Blackrock manages assets for clients
performance of the investment managers.                           in North and South America, Europe, Asia, Australia and the Middle East
                                                                  and Africa. Headquartered in New York, the firm employs more than 8,500
Through this partnership, Canada Life can offer clients a         talented professionals and maintains offices in 24 countries around the
greater chance of achieving more consistent long-term returns     world. Blackrock’s client base includes corporate, public, union and industry
with controlled risk.                                             pension plans; insurance companies; third-party mutual funds; endowments;
                                                                  foundations; charities; corporations; official institutions; banks; and
www.seic.com                                                      individuals worldwide.

                                                                  As of 30th September, 2010, BlackRock’s assets under management total
                                                                  US$3.45 trillion across equity, fixed income, cash management, alternative
                                                                  investment, real estate and advisory strategies.


                                                                  www.blackrock.co.uk


                                                                      64
For further information on Canada Life investment products please contact:

                                                          Michael Hayes
                           Investment Development Manager, Canada Life
                                                      Tel: 01 210 2757
                                     Email: michael.hayes@canadalife.ie
Canada Life House, Temple Road, Blackrock, Co. Dublin.
Tel: 01 210 2000       Fax: 01 210 2020             Web: www.canadalife.ie            Email: customerservices@canadalife.ie

                                         This information is correct at the time of going to print.
      Canada Life Assurance (Ireland) Limited and The Canada Life Assurance Company are regulated by the Central Bank of Ireland.

Investment Edge Quarter 1 2011

  • 1.
  • 2.
    Canada Life isa leading provider of life, pensions and investments with over 100 years’ experience serving the financial planning needs of our customers in the Irish market. We receive consistently high financial ratings from the independent rating agencies including a AA* rating from Standard & Poor’s. We only partner with the best investment managers to offer a broad range of choice to Irish investors. And we are backed by strength. Our parent is Great-West Life, one of the world’s leading life assurance companies, making us one of the largest and strongest life and pension companies operating in the Irish market today. * The financial rating shown for the Canada Life Assurance Company is provided by Standard & Poor’s. Standard & Poor’s is a rating agency which provides ratings on the financial strength of companies. This information is correct at the time of going to print.
  • 3.
    Introduction Welcome to the second quarter edition of Investment Edge. The second quarter was a mixed bag for markets and overall the MSCI World Index fell by 0.9% in Euro terms during the period. Equity markets initially started 2011 where they had left off last year by extending the rally that began last summer on the back of strong corporate earnings and positive economic momentum. By late February, equities began what many commentators believed was an overdue correction prompted by increasing political unrest in the Middle East and rising inflation concerns. The pullback intensified following the massive earthquake and tsunami in Japan in mid-March. Markets regained some ground in the second half of March as the economic impact of the earthquake in Japan was not expected to have a significant effect on global growth and there was some further positive US economic data. Developed equity markets broadly outperformed emerging equity markets; however, that trend began to reverse late in the quarter. Sector performance varied throughout the quarter and finished with energy being the only sector to produce a gain during the quarter benefiting from robust demand and tensions in the Middle East. At home another round of stress tests of Irish banks commissioned by the Central Bank of Ireland revealed new capital requirements of €24 billion, and led to the new government following up with plans to restructure the industry including plans to merge AIB with EBS and to have 2 main banking pillars. The government also changed their pre election stance on their intention to impose losses on bank senior bondholders, providing some respite for financial institutions and investors that hold the debt. The total cost of the bank bailout to date is estimated to be €70 billion. European markets performed well during the quarter and despite the recent downgrades of debt in Ireland, Portugal and Spain, equity markets in peripheral Europe out-performed the broader European index. Out- performance was driven by the unexpected progress made by eurozone leaders in addressing the structure of bailout mechanisms and repayment conditions of existing loans. Robust fourth-quarter earnings reports, accommodative monetary policy and improving economic momentum drove strong performance by US equity markets as well. Equity markets in Russia and Canada, whose economies are leveraged to higher energy prices, also out-performed. Japanese equities, which had been outperforming since early November on a weaker yen and an improving economy, dropped dramatically in the days following the earthquake and tsunami. They finished the quarter well behind the global benchmark. As we moved into April the European Central Bank increased interest rates for the first time since July 2008 in response to an increase in eurozone inflation. The quarter percentage point interest rate hike was entirely expected, and the focus has now shifted to discerning what the bank’s next move will be. While some form of correction has been expected as markets have now increased by over 70% since the trough of March 2009 conditions still seem relatively positive for equity markets. However, there are some risks to this favourable environment including an escalation of Middle East tensions that forces oil prices higher, a policy error by central banks in increasing interest rates too quickly, the end of quantitative easing in June and its impact on the US economy and a hard economic landing in emerging economies. In the Spotlight section of this issue we focus on the importance of dividends as a major component of stock returns to long term investors. We highlight our successful Canada Life/ Setanta Dividend Fund which follows a value investing philosophy and looks for companies paying above average dividends. The case for dividend based investing is a strong one and dividend payouts are expected to increase this year as many companies distribute more of their surplus cash from improving earnings. Michael Hayes Investment Development Manager Warning: Past performance is not a reliable guide to future performance. The value of your investment may go down as well as up. Canada Life Assurance (Ireland) Limited and The Canada Life Assurance Company are regulated by the Central Bank of Ireland. This quarterly publication is intended for Financial Advisors only.
  • 5.
    Index Market Commentary 4 Spotlight - The importance of dividends 6 Fund Fact Sheets 9 Life Investment Funds 9 Pension Funds 35 Fund Performance 62 Our Investment Partners 64
  • 6.
    Market Commentary Q12011 Financial markets in the first quarter were buffeted by a couple of the destabilising ‘known unknowns’: the tragic natural disaster in Japan and the wave of political unrest/change sweeping across the Arab world. These macro uncertainties proved enough to all but stifle, but not significantly reverse, the strong flow into ‘risk’ assets such as equities which has characterised investor behaviour for much of the last two years. The MSCI Developed World index returned -0.9% for the quarter. Fuelled by the exceptionally easy stance of official monetary policy, the surge in global stock markets since the trough of March 2009 has now extended to 71% (in Euro terms). While there has certainly been a strong economic and consequent earnings recovery over this period, some pause to reflect on what this substantial rally in stock prices means for current valuation levels seems timely. After all, for value investors such as us owning/buying the stock of a company with, for example, the MSCI World Equity Index at a price 1334.9 today is a very different value proposition from owning/buying that stock at the trough price level of 697.5 in March 2009. In broad terms, valuation is now somewhat above long-term ‘fair value’ – though still well below the extreme levels scaled at the height of the technology boom in 2000 or prior to the great crash in 1929. As stock prices rally, it is becoming more difficult to buy stocks at prices below our estimation of their intrinsic worth. I hasten to add, that this should in no way be taken as suggesting that we are making any forecast on the direction of stock prices more generally. We are merely highlighting that as we analyse our stock opportunities on a case by case basis to arrive at a sensible appraisal of their value, the sharp appreciation of stock prices over the last two years is now making value more difficult to find. European Government bonds lagged most assets over the quarter. The BofA ML Sovereign 5Yr+ index returned -1.4% during the quarter. Despite political upheaval in the Middle East & North Africa and the natural disasters in Japan, investors continued to allocate to riskier assets. Consensus points to global growth remaining strong over the year, with liquidity deemed ample and offering some comfort to investors. Within Europe, the sovereign debt crisis continues. However, there are signs of some containment as Spanish and Italian bond spreads narrowed to core Europe. Portugal is expected to enter a bailout scenario, with many hopeful this is the line in the sand. Ireland continues to try and get a handle on the socialisation of the banking crisis, with some signs of foreign sentiment changing towards our pariah status (S&P rating lowered, but now stable outlook). The Euro strengthened by approx. 6% against the USD during the quarter, from 1.34 to 1.42. The best performing region over the period (in euro terms) was MSCI Europe ex UK (+1.9%). Japanese equities fell by approx. 15% when the Earthquake and Tsunami hit in mid March, and although stocks did recover, the return for the quarter was still negative (-10.1%). The best performing global industrial sector was clearly energy, unsurprising given the rising oil price. The weakest sector over the quarter was consumer staples. Brent Oil continued to rise during the quarter reaching $118/bbl by end March – the highest level since October 2008. Growth in manufacturing together with the cold weather in Europe and the US helped to increase demand in 2010. However, political upheaval in North Africa and the Middle East drove the price above $100/bbl in 2011. The DJ UBS Spot Commodity index rose by 5.1% during the last quarter, bringing the gains for the year to 17.0% MSCI World Q1. 2011 Source: MSCI Net Total Returns (in €) 01.01.11 – 31.03.11 4
  • 7.
    Asset Class ReturnsQ1. 2011 Global Equities Euro Bonds Property Euro Cash % 3 2 1 0.3% 0 -1 -0.7% -0.9% -2 -1.4% -3 Source: MSCI World, Merrill Lynch (EMU +5yrs), Average Property Fund Mercer Survey, 3 Month Interbank Deposit (all in €) 01.01.11 – 31.03.11 Regional Returns Q1. 2011 % 15 10 5 1.9% 0.0% 0.6% 0 -5 -1.9% -0.9% -2.9% -10 -10.1% -15 MSCI World UK Europe ex UK USA Japan Pacific ex Ireland Index Japan Source: MSCI Regional Indices Total Return, ISEQ, (in €), 01.01.11 – 31.03.11 Sector Returns Q1. 2011 % 9 7.6% 6 3 0 -1.2% -1.1% -0.7% -3 -1.6% -3.3% -3.2% -6 -4.0% -9 Financials Consumer Healthcare Consumer Information Industrials & Energy Telecoms / Discretionary Staple Technology Materials Utilities Source: MSCI Global Sector Performances Total Return (in €), 01.01.11 – 31.03.11 5
  • 8.
    Spotlight - Theimportance of dividends By Michael Hayes, Investment Development Manager, Canada Life 2010 was another good year for investors with many major markets recording significant gains to Albert Einstein once said of compound interest that ‘It is the greatest mathematical discovery of all time’. While the veracity of this statement has long been questioned there can be no doubt about the importance of dividends as a percentage of overall equity returns. The same logic attributed to compound interest also applies to the reinvestment of dividends. In a recent research study ‘The quest for yield’ (2011) by Elroy Dimson, Paul Marsh and Roy Staunton of the London Business School, the role of dividends is examined in some detail. In the study, $1 invested in 1900 in US equities grew in capital value to $217 by the end of 2010 for an annualised gain of 5%. However, according to the study if dividends had been reinvested in US equities, $1 would have been worth $21,766 or an annualised return of 9.4%. Thus, reinvesting income can lead to a return 100 times larger than the return from capital gains alone. This is not specific just to the US but is true for all equity markets researched in the study. The study also demonstrates that the longer the investment horizon, the more important is dividend income as ‘for the seriously long term investor, the value of a portfolio corresponds closely to the present value of dividends’. As well as the importance of dividends as a percentage of overall return the study found that high yielding stocks also out-performed lower yielding stocks. The study broke down data in respect of US returns from 1927 into US stocks that rank each year in the highest or lowest yielding 30% of dividend paying-companies, the middle 40% and stocks that pay no dividends at all. Non-dividend paying stocks gave the lowest total return of 8.4% per year, while low-yield stocks returned 9.1% and high yielders gave the best return at 11.2%. The longest data timeline provided in the study of the yield effect was done in the UK and goes back to 1900. In the study, the 100 largest UK stocks are ranked by their dividend yield and divided 50:50 into higher and lower yielding stocks. The capitalisation weighted returns on those two portfolios are calculated over the following year and that process is repeated every year. The results show that an investment of £1 in 1900 would have grown to £5,122 in the lower yielding strategy by the end of 2010, an annualised return of 8%. However, the same initial investment allocated to high yield stocks would have grown to £100,160 which is almost 20 times greater and equivalent to an annual return of 10.9% per year. As before, the study found that same effect has been evident in every other country reviewed except New Zealand which is a small market. According to the study the same results applied when different countries were compared to each other based on dividend yield. At the start of each year 19 countries were ranked by their dividend yield at the old year end. The countries were assigned to quintiles each one made of four countries with the middle quintile containing three markets. Each portfolio had an equal amount invested in each country and all income was reinvested. Portfolios were held for one year and the 19 countries were then re-ranked and the portfolios were rebalanced and this was repeated each year. The results found that over the full 111 years from 1900 an investment of $1 in the lowest yielding countries would have grown to $370 by the end of 2010, a return of 5.5%. But the same initial investment allocated to the highest yielding countries vastly out-performed as it would have grown to an end 2010 value of more than $1 million, some 2700 times as much or a return of 13.4% per annum. The study also looked at four sub-periods of 25 years each and the first 10 years of the 21st century with high yielding stocks out-performing every time. While this strategy would have required a disciplined rebalancing regime, it does highlight the yield effect. The study also found that higher yielding strategies not only had higher returns but also at lower levels of risk. 6
  • 9.
    The Canada Life/Setanta Dividend Fund The Canada Life/Setanta Dividend Fund is an actively managed equity portfolio which invests in stocks that have paid above average dividends since 2003. Setanta Asset Management Limited (‘Setanta’), Canada Life’s primary investment manager follows a value investing philosophy. The Canada Life/ Setanta Dividend Fund (the ‘Fund’) distils this philosophy, placing particular emphasis on the significant proportion of cumulative total return that dividends typically represent. High yield investment fits neatly with Setanta’s value philosophy for a number of reasons. A high dividend yield is generally considered to be a classical indicator of value and typically corresponds to other respected value metrics. That said, a high dividend yield alone is not enough for a stock to merit consideration for investment. In addition the stock must trade below Setanta’s assessment of intrinsic value and the company will ideally exhibit strong competitive advantages. Setanta believes that a strong balance sheet, a central tenet of value investing, is important for a company that aspires to pay a sustainable and upwardly-trending dividend. Cash flow should closely reflect accounting earnings, indicating that profits are real and not reflective of an accountant’s vivid imagination. Robust cash flows typically ensure that a dividend is well covered and a company’s payout viable. These factors help to protect an investment during the difficult times a company inevitably encounters, through an economic cycle. They also ensure that the Fund, in accordance with value investing principles, emphasises a high probability of long-term capital preservation. Setanta takes a common sense approach to risk so that investment decisions are based on the characteristics of each stock. By design, the Fund is well diversified, holding 45 stocks across nineteen countries and five continents. Stocks are currently drawn from ten broad economic sectors, while no stock has a greater weight than 5% of the fund. Sector concentration is a function of the value opportunities available, subject to reasonable diversification. Although subject to change, the largest sector is telecoms which currently represents 15% of the fund. Upon investment the fund managers typically expect to hold a stock for 4-5 years, but are not bound to a maximum holding period. Setanta pays no heed to classical ‘risk’ metrics and agree with Warren Buffett, who said: “The risk that matters is not beta or volatility, but the possibility of loss or injury from an investment.” The rationale for dividend based investing is clear and dividend payouts are expected to increase this year as many companies distribute more of their surplus cash from improved earnings. Dividends have historically contributed the majority of overall returns and to date there is no historical evidence that this will change in the future. Dividends are the foundations on which long term equity returns are built. For more information on Canada Life’s fund performance, please visit www.canadalife.ie Warning: The value of your investment may go down as well as up. Past performance is not a reliable guide to future performance. The Canada Life Assurance Company and Canada Life Assurance (Ireland) Limited are regulated by the Central Bank of Ireland. This article does not constitute advice or an advertisement and does not form part of any contract. 7
  • 10.
  • 11.
  • 12.
    Canada Life /Setanta Equity Dividend Fund Quarter 1, 2011 Fund Description The Equity Dividend Fund is an actively managed equity company debt must be ‘investment grade‘ (if rated) portfolio which aims to hold c. 40 stocks that pay above company gearing below 100%. average dividends. The fund does not target high dividend payers indiscriminately; a set of desired criteria is applied The ratio of debt to equity should be not more than 100%, when filtering potential candidates for the fund. The desired except for utility companies (water, electricity etc.) where criteria are: we use a hurdle of 200%, and for financial stocks, where no maximum is applied. dividend yield 20% in excess of the MSCI World Index no cut in dividend in the last five years The maximum exposure to currencies other than the euro is market capitalisation of at least 500m (excluding Irish capped at 10% of the value of the fund. The Equity Dividend stocks) Fund is managed by Setanta Asset Management Limited dividend must be less than 80% of earnings (“Setanta“) . Top 10 Holdings Fund Performance* Q1 2011 Q1 2011 1 yr p.a 3 yr p.a 5 yr p.a 10 yr p.a Company Sector % 15 CRH Industrials / Materials 3.6 12 Sanofi-Aventis Healthcare 3.5 Fortum Telecoms / Utilities 3.1 9 Lockheed Martin Industrials / Materials 2.8 6 Solvay Industrials / Materials 2.6 3 DCC Industrials / Materials 2.5 Wincor Nixdorf Information Technology 2.5 0 Svenska Handbkn Financials 2.5 -3 Sasol Energy 2.4 CL/Setanta Equity Dividend -6 Thai Beverage Public Consumer Staples 2.4 Average of High Yield Funds Peer Group Portfolio Financials Q1 2011 *Source: Moneymate. Peer Group Average (High Yield Equity Funds from Bloxhams, AIB, Eagle Dividend Yield 3.8% Star, Aviva and Friends First. P/E Ratio 11.8x Source: Bloomberg & individual company reports. These figures are based on last years dividend in some cases. The gross yield is before any withholding taxes on the individual shares. It is also before taking account of any exit tax that may apply. Asset Distribution Equity Geographic Distribution Equity Sectoral Distribution Consumer Cash Japan Ireland Discretionary Telecoms/Utilities 6.6% 6.8% Pacific & Emerging 4.4% 6.5% Consumer 18.4% Markets Staples 11.5% UK 10.9% 19.1% Equity Information 94.3% Energy Technology 11.1% 6.3% Industrials USA & Materials Financials Europe 20.0% 18.6% 14.2% 38.5% Healthcare 13.8% Warning: Past performance is not a reliable guide to future performance. The value of your investment may go down as well as up. Important Information: This fact sheet does not form part of any contract. The information contained in this document is based on current legislation and is, therefore, subject to change. The contents are intended as a guideline only and should not be construed as an interpretation of the law. For full details of all our products, please refer to the specific product policy conditions. You should always seek advice of an appropriately qualified professional. Setanta Asset Management Limited is regulated by the Central Bank of Ireland. Canada Life Assurance (Ireland) Limited is regulated by the Central Bank of Ireland. 10
  • 13.
    Canada Life /Setanta Balanced Fund Quarter 1, 2011 Fund Description The investment objective of the Balanced Fund is to secure picked within a global sector framework, with an emphasis long-term capital growth. The fund seeks to achieve its on the following key characteristics: objective by investing primarily in a range of Irish and international equities and bonds. The asset distribution of superior financial track record this fund is more conservative than a managed fund, having competitive advantage and a sustainable business model a lower proportion of its assets invested in equities; the within their industry target equity content is less than 50%. focused on profitability and can demonstrate an ability to earn cash flow returns in excess of their cost of capital The fund is managed by Setanta Asset Management Limited over the business cycle (“Setanta“). Setanta is a value investor in quality companies do not carry excessive debt levels. and builds the portfolio from the bottom up. Stocks are Top 10 Holdings Fund Performance to 31/03/11 Q1 2011 1 yr p.a 3 yr p.a 5 yr p.a 10 yr p.a Company Sector % % Exxon Mobil Energy 2.4 6 5 Pfizer Healthcare 2.0 4 General Dynamics Industrials & Materials 2.0 3 CRH Industrials & Materials 2.0 2 Total Energy 1.9 1 Johnson & Johnson Healthcare 1.7 0 ENI Energy 1.7 -1 Owens Illinois New Industrials & Materials 1.7 -2 BP Energy 1.7 -3 DCC Industrials & Materials 1.7 -4 Canada Life/Setanta Balanced Category Average Managed Balanced Source: Moneymate. Performance is net of management fees. Asset Distribution Equity Geographic Distribution Equity Sectoral Asset Distribution Telecoms/Utilities Consumer Cash Japan Ireland 7.9% Discretionary 0.6% Property Pacific & Emerging 6.1% 5.8% UK 9.9% 7.4% 10.2% Information Markets Consumer 7.6% Technology Staples 12.4% 10.9% Equity 47.2% Europe 21.0% Industrials Energy & Materials 15.5% Fixed Interest 16.6% 44.7% USA 49.4% Healthcare Financials 12.8% 14.1% Warning: Past performance is not a reliable guide to future performance. The value of your investment may go down as well as up. Important Information: This fact sheet does not form part of any contract. The information contained in this document is based on current legislation and is, therefore, subject to change. The contents are intended as a guideline only and should not be construed as an interpretation of the law. For full details of all our products, please refer to the specific product policy conditions. You should always seek advice of an appropriately qualified professional. Setanta Asset Management Limited is regulated by the Central Bank of Ireland. Canada Life Assurance (Ireland) Limited is regulated by the Central Bank of Ireland. 11
  • 14.
    Canada Life /Setanta Balanced Dividend Fund Quarter 1, 2011 Fund Description The Balanced Dividend Fund is an actively managed balanced dividend must be less than 80% of earnings fund investing 66% in equities and 34% in fixed interest company debt must be ‘investment grade‘ (if rated) securities. The equity portion of the fund aims to hold c. 40 company gearing below 100%. stocks that pay above average dividends. The fixed interest portion of the fund invests in EU government bonds. The ratio of debt to equity should be not more than 100%, except for utility companies (water, electricity etc.) where The fund does not target high dividend payers indiscriminately we use a hurdle of 200%, and for financials stock, where no for the equity securities; a set of desired criteria is applied maximum is applied. when filtering potential candidates for the fund. The desired criteria are: The maximum exposure to currencies other than the euro is capped at 10% of the value of the fund. The Balanced dividend yield 20% in excess of the MSCI World Index Dividend Fund is managed by Setanta Asset Management no cut in dividend in the last 5 years Limited (“Setanta“) . market capitalisation of at least 500m (excluding Irish stocks) Top 10 Holdings Fund Performance* Q1 2011 % Q1 2011 1 yr p.a 3 yr p.a 5 yr p.a 10 yr p.a Company Sector % 10 CRH Industrials / Materials 3.6 Sanofi-Aventis Healthcare 3.5 8 Fortum Telecoms / Utilities 3.1 6 Lockheed Martin Industrials / Materials 2.8 4 Solvay Industrials / Materials 2.6 2 DCC Industrials / Materials 2.5 Wincor Nixdorf Information Technology 2.5 0 Svenska Handbkn Financials 2.5 -2 Sasol Energy 2.4 -4 Thai Beverage Public Consumer Staples 2.4 CL/Setanta Bal Dividend Category Average Managed Balanced Portfolio Financials Q1 2011 *Source: Moneymate. Peer Group Average (High Yield Equity Funds from Bloxhams, AIB, Eagle Dividend Yield 3.8% Star, Aviva and Friends First. Source: Bloomberg & individual company reports. These figures are based on last years dividend P/E Ratio 11.8x in some cases. The gross yield is before any withholding taxes on the individual shares. It is also before taking account of any exit tax that may apply. Asset Distribution Equity Geographic Distribution Equity Sectoral Distribution Consumer Japan Ireland Discretionary Pacific & Emerging 4.4% Telecoms/Utilities 6.6% 6.5% Markets 18.4% Consumer 11.5% Staples UK 10.9% 19.1% Information Energy Technology 11.1% 6.3% Industrials Europe USA & Materials Financials 38.5% 20.0% 18.6% 14.2% Healthcare 13.8% Warning: Past performance is not a reliable guide to future performance. The value of your investment may go down as well as up. Important Information: This fact sheet does not form part of any contract. The information contained in this document is based on current legislation and is, therefore, subject to change. The contents are intended as a guideline only and should not be construed as an interpretation of the law. For full details of all our products, please refer to the specific product policy conditions. You should always seek advice of an appropriately qualified professional. Setanta Asset Management Limited is regulated by the Central Bank of Ireland. Canada Life Assurance (Ireland) Limited is regulated by the Central Bank of Ireland. 12
  • 15.
    Canada Life /Setanta European Equity Fund Quarter 1, 2011 Fund Description The investment objective of the European Equity Fund is to superior financial track record secure long-term capital growth. competitive advantage and a sustainable business model within their industry The fund seeks to achieve its objective by investing in a focused on profitability and can demonstrate an ability to range of European equities. earn cash flow returns in excess of their cost of capital over the business cycle It is an actively managed equity portfolio which holds c. 30- do not carry excessive debt levels. 50 European stocks. The fund is managed by Setanta Asset Management Limited (“Setanta“). Setanta is a value investor in quality companies and builds the portfolio from the bottom up. Stocks are picked within a global sector framework, with an emphasis on the following key characteristics: Top 10 Holdings Fund Performance to 31/03/11 Q1 2011 1 yr p.a 3 yr p.a 5 yr p.a 10 yr p.a Company Sector % % DCC Industrials/Materials 4.9 20 BP Energy 4.4 15 C&C Group Consumer Staples 4.4 CRH Industrials/Materials 4.2 10 Solvay Industrials/Materials 4.0 Axel Springer Consumer Discretionary 3.9 5 Vodafone Telecoms / Utilities 3.9 Wincor Nixdorf Information/Technology 3.8 0 Diageo Consumer Staples 3.8 Total Energy 3.8 -5 Canada Life/Setanta European Equity Category Average Advanced Europe Equity Source: Moneymate. Performance is net of management fees. Asset Distribution Equity Geographic Distribution Equity Sectoral Distribution Cash Consumer Cash Telecoms/ 1.7% Greece 2.0% Belgium Utilities Discretionary 3.0% 7.0% Czech Republic 10.0% 15.9% Consumer 3.0% Staples Finland Information 8.3% UK 9.0% Technology 27.0% 6.0% France 8.0% Energy 13.4% Germany Norway Industrials 8.0% 3.0% & Materials Switzerland 16.8% 6.0% Italy Ireland Financials Equity 6.0% 18.0% Healthcare 18.9% 98.3% 10.6% Warning: Past performance is not a reliable guide to future performance. The value of your investment may go down as well as up. Important Information: This fact sheet does not form part of any contract. The information contained in this document is based on current legislation and is, therefore, subject to change. The contents are intended as a guideline only and should not be construed as an interpretation of the law. For full details of all our products, please refer to the specific product policy conditions. You should always seek advice of an appropriately qualified professional. Setanta Asset Management Limited is regulated by the Central Bank of Ireland. Canada Life Assurance (Ireland) Limited is regulated by the Central Bank of Ireland. 13
  • 16.
    Canada Life /Setanta Unitised With Profits Fund Quarter 1, 2011 Fund Description The Unitised With Profits Fund (UWP) operates like a At maturity a terminal bonus may be applied if the underlying unit-linked fund, except that investment return to assets have outperformed the declared bonuses. policyholders is smoothed and guaranteed not to fall. Returns are distributed in the form of a bonus rate declared by Canada Life based on various factors including the performance of the underlying assets. Returns are smoothed to the investor in that the bonus rate will endeavour to reflect the performance of the assets over the long term, allowing the investor to avoid short-term volatility in the markets. Top 10 Holdings Annual Bonus History Company Sector % Year Life Gross Version Net Version Exxon Mobil Energy 2.4 95 – 96 - - Pfizer Healthcare 2.1 96 – 97 - - General Dynamics Industrials & Materials 2.0 97 – 98 - - CRH Industrials & Materials 1.9 98 – 99 - 6.5% Total Energy 1.9 99 – 00 - 6.0% 00 – 01 6.0% 5.0% ENI Energy 1.8 01 – 02 6.0% 4.5% Johnson & Johnson Healthcare 1.8 02 – 03 5.0% 3.5% BP Energy 1.8 03 – 04 2.0% 0.0% Owens Illinois New Industrials & Materials 1.7 04 – 05 1.0% 0.0% DCC Industrials & Materials 1.7 05 – 06 1.0% 0.0% 06 – 07 1.0% 0.0% 07 - 08 1.0% 0.0% 08 - 09 0.5% 0.0% 09 - 10 0.0% 0.0% 10 - 11 0.0% 0.0% Bonus rates are declared net of management charges Asset Distribution Equity Geographic Distribution Equity Sectoral Distribution Japan Telecoms/Utilities Consumer Property Ireland Discretionary Cash 6.0% 7.9% 2.0% Pacific & Emerging 5.8% 9.9% 6.2% UK Markets 10.3% Information Consumer 8.6% Technology Staples 12.1% 11.0% Equity Europe 36.9% Fixed Interest 20.4% Industrials 54.9% Energy & Materials 15.8% 16.4% USA Healthcare 48.9% Financials 12.6% 14.3% Warning: Past performance is not a reliable guide to future performance. The value of your investment may go down as well as up. Important Information: This fact sheet does not form part of any contract. The information contained in this document is based on current legislation and is, therefore, subject to change. The contents are intended as a guideline only and should not be construed as an interpretation of the law. For full details of all our products, please refer to the specific product policy conditions. You should always seek advice of an appropriately qualified professional. Setanta Asset Management Limited is regulated by the Central Bank of Ireland. Canada Life Assurance (Ireland) Limited is regulated by the Central Bank of Ireland. 14
  • 17.
    Canada Life /Setanta Focus 15 Fund Quarter 1, 2011 Fund Description The Focus 15 Fund is an actively managed, concentrated focused on profitability and can demonstrate an ability to equity portfolio, which holds c. 15 international (ex Ireland) earn cash flow returns in excess of their cost of capital stocks. The Focus 15 Fund is managed by Setanta Asset over the business cycle Management Limited (“Setanta“). Setanta is a value do not carry excessive debt levels. investor in quality companies. Setanta builds the portfolio from the bottom up, using the stocks researched by the Clearly, Focus 15 is likely to be more volatile than more sector specialists, with an emphasis on the following key broadly-based funds; it is therefore only suitable for those characteristics: investors with experience of the stock market. superior financial track record competitive advantage and a sustainable business model within their industry Fund Holdings Fund Performance to 31/03/11 Company Sector % % Q1 2011 1 yr p.a 3 yr p.a 5 yr p.a 10 yr p.a Pfizer Healthcare 9.0 15 Sysco Consumer Staples 8.2 12 Everest Re Group Financials 7.7 Tidewater Energy 7.0 9 Steris Healthcare 7.0 6 Johnson & Johnson Healthcare 6.9 Total Energy 6.8 3 MI Developments Financials 6.8 0 Astellas Pharmaceutical Healthcare 6.7 Wincor Nixdorf Information Technology 6.6 -3 NTT Docomo Telecoms / Utilities 6.1 -6 Motor Consumer Discretionary 5.9 Belgacom Telecoms / Utilities 4.0 Nokia Information Technology 3.1 Canada Life/Setanta Focus 15 OPAP Consumer Discretionary 2.1 Category Average Flexible Equity Komori Industrials & materials 1.8 Source: Moneymate. Performance is net of management fees. Cash 4.3 Asset Distribution Equity Geographic Distribution Equity Sectoral Distribution Cash Consumer 4.3% Telecoms/Utilities Discretionary Japan 10.7% 8.5% 21.5% Consumer Information Staples Technology 8.6% 10.1% Pacific Industrials USA & Emerging & Materials Energy 46.7% Markets 1.9% 14.4% 8.0% Europe Healthcare 23.7% 30.8% Financials Equity 15.1% 95.7% Warning: Past performance is not a reliable guide to future performance. The value of your investment may go down as well as up. Important Information: This fact sheet does not form part of any contract. The information contained in this document is based on current legislation and is, therefore, subject to change. The contents are intended as a guideline only and should not be construed as an interpretation of the law. For full details of all our products, please refer to the specific product policy conditions. You should always seek advice of an appropriately qualified professional. Setanta Asset Management Limited is regulated by the Central Bank of Ireland. Canada Life Assurance (Ireland) Limited is regulated by the Central Bank of Ireland. 15
  • 18.
    Canada Life /Setanta Irish Equity Fund Quarter 1, 2011 Fund Description The Irish Equity Fund is an actively managed equity focused on profitability and can demonstrate an ability to portfolio which aims to hold stocks quoted on the Irish earn cash flow returns in excess of their cost of capital stock exchange. The fund is managed by Setanta Asset over the business cycle Management Limited (“Setanta“). Setanta is a value investor do not carry excessive debt levels. in quality companies. Setanta builds the portfolio from the bottom up, picking stocks within a sector framework, with an The Irish Equity Fund is a relatively concentrated equity fund emphasis on the following key characteristics: with exposure to stocks from only one country and is likely to be more volatile than more broadly-based funds. superior financial track record competitive advantage and a sustainable business model within their industry Top 10 Holdings Fund Performance to 31/03/11 Q1 2011 1 yr p.a 3 yr p.a 5 yr p.a 10 yr p.a Company Sector % % DCC Industrials & Materials 9.3 20 Total Produce Consumer Staples 8.8 15 Irish Continental Industrials & Materials 8.3 10 Kingspan Industrials & Materials 7.8 5 CRH Industrials & Materials 7.4 0 Abbey Industrials & Materials 7.3 -5 Dragon Oil Energy 6.3 -10 Grafton Group Industrials & Materials 6.2 -15 -20 Kerry Group Consumer Staples 6.2 -25 Ryanair Holdings Industrials & Materials 6.2 Canada Life/Setanta Irish Equity Category Average Irish Equity Source: Moneymate. Performance is net of management fees. Asset Distribution Equity Geographic Distribution Equity Sectoral Distribution Consumer Cash Discretionary 0.1% 5.8% Consumer Staples 25.3% Industrials & Materials 57.5% Energy 6.3% Financials 1.1% Healthcare Equity 4.0% 99.9% Warning: Past performance is not a reliable guide to future performance. The value of your investment may go down as well as up. Important Information: This fact sheet does not form part of any contract. The information contained in this document is based on current legislation and is, therefore, subject to change. The contents are intended as a guideline only and should not be construed as an interpretation of the law. For full details of all our products, please refer to the specific product policy conditions. You should always seek advice of an appropriately qualified professional. Setanta Asset Management Limited is regulated by the Central Bank of Ireland. Canada Life Assurance (Ireland) Limited is regulated by the Central Bank of Ireland. 16
  • 19.
    Canada Life /Setanta Property Fund Quarter 1, 2011 Fund Description This fund invests in commercial properties - office, retail and The Property Fund is suitable for investors who wish to gain warehousing. The fund is characterised by the quality of the investment exposure to the commercial property sector. property that makes up the portfolio and the tenants that Investors should understand that property investment is by occupy these properties. its nature less liquid than other asset classes. Currently, all of the properties are located in Ireland. Sample Property Holdings Fund Performance to 31/03/11 Q1 2011 1 yr p.a 3 yr p.a 5 yr p.a 10 yr p.a OFFICE % Block C, Earlsfort Centre 15 Tenant - Office of Public Works 10 Fund Weighting - 13.2% 5 RETAIL 0 45/46 Patrick Street, Cork -5 Tenant - C&J Clarke International -10 Fund Weighting - 3.8% -15 INDUSTRIAL/WAREHOUSE -20 Swords Business Campus -25 Tenants - Air France, Client Logic, Eastern Health Board Fund Weighting - 10.2% Canada Life/Setanta Property Category Average Property Source: Moneymate. Performance is net of management fees. Asset Distribution Geographic Distribution Sectoral Distribution Cash 9.5% Rest of Ireland 16.5% Office 27.7% Retail Dublin city centre 41.7% Cork 44.4% 10.3% Cash & Bonds 9.5% Property Suburban Dublin Industrial 90.5% 28.8% 21.1% Warning: Past performance is not a reliable guide to future performance. The value of your investment may go down as well as up. Important Information: This fact sheet does not form part of any contract. The information contained in this document is based on current legislation and is, therefore, subject to change. The contents are intended as a guideline only and should not be construed as an interpretation of the law. For full details of all our products, please refer to the specific product policy conditions. You should always seek advice of an appropriately qualified professional. Setanta Asset Management Limited is regulated by the Central Bank of Ireland. Canada Life Assurance (Ireland) Limited is regulated by the Central Bank of Ireland. 17
  • 20.
    Canada Life /Setanta Strategic Growth Fund Quarter 1, 2011 Fund Description The investment objective of the Strategic Growth Fund is to superior financial track record secure long-term capital growth. The fund seeks to achieve competitive advantage and a sustainable business model its objective by investing primarily in a range of Irish and within their industry international equities and bonds. The fund will hold between focused on profitability and can demonstrate an ability to 50-80% of its assets in equities with the balance consisting earn cash flow returns in excess of their cost of capital of bonds, property and cash over the business cycle do not carry excessive debt levels. The fund is managed by Setanta Asset Management Limited (“Setanta“). Setanta is a value investor in quality companies. Setanta builds the portfolio from the bottom up, picking stocks within a global sector framework, with an emphasis on the following key characteristics: Top 10 Holdings Fund Performance to 31/03/11 Q1 2011 1 yr p.a 3 yr p.a 5 yr p.a 10 yr p.a Company Sector % % Exxon Mobil Energy 1.6 6 CRH Industrials & Materials 1.5 5 DCC Industrials & Materials 1.4 4 Pfizer Healthcare 1.4 3 Total Energy 1.4 2 General Dynamics Industrials & Materials 1.3 1 ENI Energy 1.2 0 Johnson & Johnson Healthcare 1.2 -1 BP Energy 1.2 Owens Illinois Industrials & Materials 1.1 -2 -3 Canada Life/Setanta Strategic Growth G Category Average Managed Dynamic Source: Moneymate. Performance is net of management fees. Asset Distribution Equity Geographic Distribution Equity Sectoral Distribution Japan Telecoms/Utilities Consumer Cash Property 6.0% Ireland 7.6% Discretionary Pacific & Emerging 6.4% 2.8% Markets 9.2% Information 9.7% Commodities Fixed Interest Consumer 7.9% UK Technology 2.4% 19.4% Staples 9.9% 11.6% 11.3% Europe 19.9% Industrials Energy & Materials 15.7% 18.3% Equity 69.0% Healthcare Financials USA 12.4% 13.5% 47.1% Warning: Past performance is not a reliable guide to future performance. The value of your investment may go down as well as up. Important Information: This fact sheet does not form part of any contract. The information contained in this document is based on current legislation and is, therefore, subject to change. The contents are intended as a guideline only and should not be construed as an interpretation of the law. For full details of all our products, please refer to the specific product policy conditions. You should always seek advice of an appropriately qualified professional. Setanta Asset Management Limited is regulated by the Central Bank of Ireland. Canada Life Assurance (Ireland) Limited is regulated by the Central Bank of Ireland. 18
  • 21.
    Canada Life /Setanta Global Opportunity Fund Quarter 1, 2011 Fund Description The Global Opportunity Fund is an actively managed equity superior financial track record portfolio, which holds c. 100-140 global stocks. The competitive advantage and a sustainable business model investment objective of the Global Opportunity Fund is to within their industry secure long-term capital growth by investing in a range of focused on profitability and can demonstrate an ability to Irish and international equities. earn cash flow returns in excess of their cost of capital over the business cycle The fund is managed by Setanta Asset Management Limited do not carry excessive debt levels. (“Setanta“). The fund is the cornerstone of Setanta‘s investment process. Setanta is a value investor in quality companies and builds the portfolio from the bottom up. Stocks are picked within a global sector framework, with an emphasis on the following key characteristics: Top 10 Holdings Fund Performance to 31/03/11 Q1 2011 1 yr p.a 3 yr p.a 5 yr p.a 10 yr p.a Company Sector % % Exxon Mobil Energy 2.4 10 Pfizer Healthcare 2.1 8 General Dynamics Industrials & Materials 2.0 6 CRH Industrials & Materials 1.9 4 Total Energy 1.9 Johnson & Johnson Healthcare 1.8 2 ENI Energy 1.7 0 Owens Illinois Industrials & Materials 1.7 -2 BP Energy 1.7 DCC Industrials & Materials 1.7 -4 Canada Life/Setanta Global Opportunity Category Average Flexible Equity Source: Moneymate. Performance is net of management fees. Asset Distribution Equity Geographic Distribution Equity Sectoral Distribution Cash Japan Ireland Telecoms/Utilities Consumer 1.3% 7.9% Discretionary Pacific & Emerging 6.1% 5.8% UK 9.9% Markets 10.2% Information Consumer 7.6% Technology Staples 12.4% 10.9% Europe 21.0% Energy Industrials & Materials 15.5% 16.6% USA 49.4% Equity Healthcare Financials 98.7% 12.8% 14.1% Warning: Past performance is not a reliable guide to future performance. The value of your investment may go down as well as up. Important Information: This fact sheet does not form part of any contract. The information contained in this document is based on current legislation and is, therefore, subject to change. The contents are intended as a guideline only and should not be construed as an interpretation of the law. For full details of all our products, please refer to the specific product policy conditions. You should always seek advice of an appropriately qualified professional. Setanta Asset Management Limited is regulated by the Central Bank of Ireland. Canada Life Assurance (Ireland) Limited is regulated by the Central Bank of Ireland. 19
  • 22.
    Canada Life QuadriviumFund Quarter 1, 2011 Fund Description Fund Composition The investment objective of the Canada Life Quadrivium Fund The Quadrivium Fund invests in the following four asset classes: is to secure long-term capital growth. High-Yield Equities The fund seeks to achieve its objective by investing in four The Canada Life Dividend Fund is an equity fund that different asset classes – equities, bonds, property and specifically targets stable blue chip quality companies with commodities. By investing in Quadrivium investors can gain the ability to pay consistently strong dividends. access to a diversified portfolio invested across these four The Dividend Fund is a pure equity portfolio of actively asset classes. The fund provides exposure to international managed companies with an average of 40 holdings. shares, Irish & European commercial property, commodities and fixed interest assets, all within one fund. Property Irish Commercial Property The Canada Life Property Fund invests in a range of Asset Distribution commercial properties. The fund is currently fully invested in Irish commercial properties but will seek opportunities Fixed Interest 8.1% outside Ireland where appropriate. The fund is managed by a team of property specialists at Canada Life European Real Commodities Estate, who have over 20 years of property experience and 18.4% manage over €1.7 billion in property assets. Dividend Fund European Property 43.1% The Canada Life/Morgan Stanley European Property Fund European Property invests in a professionally managed portfolio of European 16.5% property companies, and is managed by a team of property Irish Property 13.9% experts at Morgan Stanley with over 40 years of collective experience of real estate markets. The fund invests in Asset Class Current Expected quoted European property companies through buying Allocation Range real estate securities. Real Estate securities are indirect Dividend Fund 43.1% 20% - 50% investments in property whose long-term returns depend on Irish Property 13.9% 10% - 25% the underlying real estate market. European Property 16.5% 10% - 25% 18.4% Commodities Commodities 0% - 25% The commodities allocation in the Quadrivium fund invests Fixed Interest 8.1% 0% - 25% in an Exchange Traded Fund (ETF) issued by ETF Securities. The ETFs All Commodities DJ-AIGCI is designed to track the Dow Jones-AIG Commodity sub-index. The Dow Jones-AIG Fund Performance Commodity sub-index invests in a broadly diversified index Q1 2011 1 yr p.a 2 yr p.a 3 yr p.a that allows investors to track commodity futures returns % through a single fund. No related group of commodities (e.g 25 energy, precious metals, livestock or grains) may constitute 20 more than 33% of the index and no single commodity may constitute less than 2% or more than 15% of the index. 15 Commodities tend to behave differently to all other asset Canada Life Quadrivium Fund classes and for this reason are used as a good diversifier in 10 multi-asset portfolios. The ETFs are issued by ETF Securities. Diversified Funds Average 5 (Diversified Funds from Eagle Star, ETF Securities invest the assets backing the ETF with AIG. Irish Life & Canada Life) 0 Fixed Interest -5 The Canada Life Fixed Interest Fund invests in government gilts predominantly from eurozone countries. Gilts, or bonds -10 are essentially a form of debt. Governments and large Source: Moneymate. Performance is net of management fees. corporations use them to raise money for capital expenditure. This fund was launched on 22/10/07 Warning: Past performance is not a reliable guide to future performance. The value of your investment may go down as well as up. Important Information: This fact sheet does not form part of any contract. The information contained in this document is based on current legislation and is, therefore, subject to change. The contents are intended as a guideline only and should not be construed as an interpretation of the law. For full details of all our products, please refer to the specific product policy conditions. You should always seek advice of an appropriately qualified professional. Setanta Asset Management Limited is regulated by the Central Bank of Ireland. Canada Life Assurance (Ireland) Limited is regulated by the Central Bank of Ireland. 20
  • 23.
    Canada Life /Setanta Cash Fund Quarter 1, 2011 Fund Description The Cash Fund seeks to provide modest returns in exchange individual securities of ‘A‘ and for the portfolio an average for relative capital security. The fund may invest in: rating of ‘AA‘. i) Euro denominated short-dated term deposits with banks The maximum average duration of the fund is 4.5 months, and/or eligible credit institutions on Canada Life‘s approved and the maximum duration of any one asset is one year. short-term borrowers list which have a minimum credit The fund has a diversified exposure, with no more than 30% rating of P-1 and which are authorised to carry on a banking credit exposure to any one entity. business in the State under Section 9 of the Central Bank Act, 1971 and/or The fund is actively managed and consideration is given to the underlying credit worthiness of the financial institution, (ii) Euro denominated bonds issued by governments or the return and the tenure of the deposit. corporates subject to a minimum average credit rating of Counterparty Exposure Fund Performance to 31/03/11 Q1 2011 1 yr p.a 3 yr p.a 5 yr p.a 10 yr p.a Issuer % of Fund Issuer % of Fund % Ulster Bank 19.4 Belgian Treasury Bill 3.3 2.0 National Irish Bank 18.4 German Treasury Bill 3.3 French Treasury Bill 9.8 Bank of Ireland (G) 2.3 1.5 BNP 8.2 Allied Irish Bank (G) 2.0 ACC Bank 6.8 EBS Building Society (G) 1.9 1.0 Dutch Treasury Bill 6.2 Irish Life & Permanent (G) 1.8 0.5 Italian Treasury Bill 5.2 SPGB 1.2 Dutch Commercial Paper 3.3 Cash 3.6 0.0 German Commercial Paper 3.3 Counterparty exposures (G) are covered by the Irish Government guarantee. Other counterparty/credit exposures are covered by either other European National -0.5 Government Guarantees or have individually strong credit ratings. Canada Life/Setanta Cash G -1.0 Category Average Money Market Source: Moneymate. Performance is net of management fees. Warning: Past performance is not a reliable guide to future performance. The value of your investment may go down as well as up. Important Information: This fact sheet does not form part of any contract. The information contained in this document is based on current legislation and is, therefore, subject to change. The contents are intended as a guideline only and should not be construed as an interpretation of the law. For full details of all our products, please refer to the specific product policy conditions. You should always seek advice of an appropriately qualified professional. Setanta Asset Management Limited is regulated by the Central Bank of Ireland. Canada Life Assurance (Ireland) Limited is regulated by the Central Bank of Ireland. 21
  • 24.
    Canada Life /Setanta Fixed Interest Fund Quarter 1, 2011 Fund Description The Fixed Interest Fund invests predominantly in eurozone The fund has a minimum ‘A‘ credit rating investment level for government bonds. It may also hold corporate bonds and individual securities. The minimum average credit rating for bonds from non-eurozone countries. The fund is managed by the full portfolio is ‘AA‘. The duration of the portfolio can be Setanta Asset Management Limited (“Setanta“). between +/- two years of the index. Setanta‘s general philosophy in relation to fixed income is Returns are likely to be modest and can be negative. that performance in bond markets is primarily driven by the However, they are significantly less volatile than equity directional (duration) calls and yield curve positioning. The returns. fund takes relatively small currency or credit risk. Top 10 Holdings Fund Performance to 31/03/11 Q1 2011 1 yr p.a 3 yr p.a 5 yr p.a 10 yr p.a Company Country % % Depfa ACS Bank Ireland 5.2 4 3 Buoni Poliennali Del Tes Italy 3.9 2 EBS Mortgage Finance Ireland 3.3 1 Irish Life & Permanent Ireland 3.2 0 -1 Buoni Poliennali Del Tes Italy 3.0 -2 Buoni Poliennali Del Tes Italy 2.9 -3 Buoni Poliennali Del Tes Italy 2.9 -4 -5 Landwirtsch. Rentenbank Germany 2.7 -6 Hellenic Republic I/L Greece 2.7 -7 Buoni Poliennali Del Tes Italy 2.5 -8 Canada Life/Setanta Fixed Interest Fund Category Average Bonds Source: Moneymate. Performance is net of management fees. Asset Distribution Country Weighting Yield Curve Positioning UK Finland SNAT Poland Duration Fund Benchmark 1.0% 1.0% 2.0% 2.0% (Yrs to Maturity) Covered Greece France Weighting Weighting 18% 6.0% 7.0% Portugal 0-5 27.1% 9.1% 3.0% Italy Supranational Netherlands 27.0% 2% 6.0% 5 - 10 50.6% 61.4% Belgium Govt. Agency 5.0% 10 - 15 21.8% 22.3% 14% 15 - 30 0.1% 7.2% Govt. Guarantee Govt. Ireland 4% 62% 17.0% Spain 100% 100% Austria 15.0% 3.0% Germany 4.0% Warning: Past performance is not a reliable guide to future performance. The value of your investment may go down as well as up. Important Information: This fact sheet does not form part of any contract. The information contained in this document is based on current legislation and is, therefore, subject to change. The contents are intended as a guideline only and should not be construed as an interpretation of the law. For full details of all our products, please refer to the specific product policy conditions. You should always seek advice of an appropriately qualified professional. Setanta Asset Management Limited is regulated by the Central Bank of Ireland. Canada Life Assurance (Ireland) Limited is regulated by the Central Bank of Ireland. 22
  • 25.
    Canada Life /SEI Manager-of-Managers Fund Quarter 1, 2011 CL SEI Global Balanced Fund P Low Medium High Investment Objective and Strategy Fund Performance The SEI Global Balanced Fund aims to provide long term Q1 11 1 Yr 2 Yr p.a 3 Yr p.a 4 Yr p.a 5 Yr p.a growth of capital with a moderate level of income by -1.1% 6.1% 21.2% 2.1% -2.3% -1.2% investing in a range of SEI multi-manager equity and fixed income funds. The fund is a globally diversified fund with Top 10 Holdings % approximately 70% invested in top tier equity funds and the Apple Inc. 1.62 remaining 30% invested in top tier fixed income funds. JPMorgan Chase & Co. 1.12 Chevron Corp. 1.12 Asset Allocation Microsoft Corp. 1.04 Equities 70% Wells Fargo & Co. 1.00 US Large Cap 28.00 QUALCOMM Inc. 0.99 Global Developed Markets 14.00 AT&T Inc. 0.81 Europe Ex-UK 10.00 Pfizer Inc. 0.80 UK 6.00 ConocoPhillips 0.78 Japan 5.00 Exxon Mobil Corp. 0.77 Pacific Basin Ex-Japan 3.50 Total 10.04 Emerging Markets 3.50 Fixed Income Managers % AllianceBernstein 4.80 Fixed Income 30% First International Advisers 4.20 Global 15.00 UBS Global Asset Management 2.40 Global Opportunistic 15.00 Wellington Management Company 3.60 Total 100% DB Advisers 3.05 Jennison Associates 2.70 Schroders Investment Management 2.33 Wellington GRV 3.27 TCW Group 3.65 List of Managers % US Large Companies Equities 28.00 UK Equities 6.00 Aronson, Johnson, Ortiz 4.43 Invesco Quantitative Strategies 1.16 Brown Investment Advisory 2.86 Investec Asset Management 0.77 Delaware Investment Advisors 2.57 Jupiter Investment Managers 1.22 Legg Mason - Growth Equity 3.14 L.A. Capital Management 1.07 Legg Mason - Core Equity 2.57 Mirabaud Asset Management 1.16 LSV Asset Management 4.43 Standard Life Investments 0.61 Neuberger Berman 2.86 Japanese Equities 5.00 Quantitative Management Associates 2.86 Acadian Asset Management 1.12 WestEnd Advisors 2.28 Analytic Investors Inc 1.02 Global Developed Markets Equities 14.00 Capital International 1.28 Hexavest 3.46 JPMorgan Asset Management 1.58 Intech Investment Management 2.89 Pacific Basin Ex-Japan Equities 3.50 Janus Capital Group 2.60 Capital International 0.98 Tradewinds 1.73 Lloyd George Investment Management 1.40 Wellington Management Co. Int. Value 3.32 Maple-Brown Abbott Limited 1.12 Europe Ex-UK Equities 10.00 Emerging Markets Equities 3.50 Acadian Asset Management 3.67 Artisan Partners 0.71 Metropole Gestion 1.74 JO Hambro Capital Management 0.36 TT International 2.55 Lazard Asset Management 0.50 Wellington Management Company 2.04 Neuberger Berman 0.50 PanAgora Asset Management 0.71 The Boston Company Asset Management 0.71 23
  • 26.
    Canada Life /SEI Manager-of-Managers Fund Quarter 1, 2011 CL SEI Global Developed Markets Equity Fund P Low Medium High Investment Objective and Strategy Fund Performance The investment objective of the Global Developed Markets Q1 11 1 Yr 2 Yr p.a 3 Yr p.a 4 Yr p.a Equity Fund is to achieve capital appreciation by investing -2.4% 5.7% 24.7% -3.0% -9.4% primarily in equity securities of issuers located in developed countries. Following a manager-of-managers approach, the fund’s assets are diversified across specialist sub-advisers. Fund Benchmark MSCI World Index Top 10 Holdings % Country Allocation % Exxon Mobil Corp. 1.28 United States 47.2 Microsoft Corp. 1.11 Japan 11.1 Eli Lilly & Co. 0.93 United Kingdom 8.0 HSBC Holdings Plc 0.9 Canada 4.3 General Electric Co. 0.83 Germany 4.0 Pfizer Inc. 0.82 Switzerland 3.9 International Business Machines Corp. 0.81 France 3.9 Wells Fargo & Co. 0.79 Australia 1.8 Newmont Mining Corp. 0.74 Norway 1.6 JPMorgan Chase & Co. 0.73 Hong Kong 1.6 Total 8.94 Other 12.6 Underlying Managers Sector Weighting % Hexavest 24.7 Financials 17.1 Wellington Management Company International Value 23.7 Industrials 13.3 Intech Investment Management 20.6 Consumer Discretionary 12.1 Janus Capital Management 18.6 Energy 10.2 Tradewinds Global Investors 12.4 Information Technology 10.0 Fund Total 100.00 Health Care 10.0 Materials 9.8 Consumer Staples 7.8 Telecoms 5.9 Utilities 3.9 Market Capitalisation Breakdown (USD) Weight (%) Greater than 50 Billion 28.6 Between 20 and 50 Billion 25.7 Between 10 and 20 Billion 19.4 Between 1 and 10 Billion 24.6 Less than 1 Billion 1.7 24
  • 27.
    Canada Life /SEI Manager-of-Managers Fund Quarter 1, 2011 CL SEI European (Ex-UK) Equity Fund P Low Medium High Investment Objective and Strategy Fund Performance The fund aims to achieve long-term capital growth and Q1 11 1 Yr 2 Yr p.a 3 Yr p.a 4 Yr p.a income by investing in a broadly diversified portfolio of 1.6% 7.7% 28.4% -3.5% -6.1% European equity securities. Following a manager-of-managers approach, the fund’s assets are diversified across specialist sub-advisers. Fund Benchmark MSCI Europe EX-UK index Top 10 Holdings % Country Allocation % BNP Paribas S.A. 2.6 France 26.1 Total S.A. 2.4 Germany 21.6 Basf SE 1.8 Switzerland 12.2 Sanofi-Aventis S.A. 1.7 Sweden 8.6 Novartis AG 1.5 Italy 6.8 Daimler AG 1.4 Netherlands 4.9 Sap AG 1.3 Norway 3.4 Unicredit S.P .A. 1.3 Spain 3.3 Heineken N.V. 1.3 Denmark 2.8 Capgemini 1.2 Finland 2.5 Total 16.4 Other 7.8 Underlying Managers Sector Weighting % Acadian Asset Management 36.7 Industrials 21.7 TT International 25.5 Financials 15.7 Wellington Management Company 20.4 Consumer Discretionary 14.8 Metropole Gestion 17.4 Consumer Staples 10.9 Fund Total 100.00 Materials 10.5 Information Technology 7.9 Health Care 7.8 Energy 5.9 Telecomm Services 2.7 Utilities 2.2 Market Capitalisation Breakdown (USD) Weight (%) Greater than 50 Billion 22.7 Between 20 and 50 Billion 12.8 Between 10 and 20 Billion 15.0 Between 1 and 10 Billion 43.2 Less than 1 Billion 6.3 25
  • 28.
    Canada Life /SEI Manager-of-Managers Fund Quarter 1, 2011 CL SEI US Equity Fund P Low Medium High Investment Objective and Strategy Fund Performance The SEI US Large Companies Fund aims to provide long- Q1 11 1 Yr 2 Yr p.a 3 Yr p.a 4 Yr p.a term capital growth and income by investing primarily in a -0.2% 7.2% 23.3% 2.7% -4.1% broadly diversified portfolio of US equity securities of large companies. Following a manager-of-managers approach, the fund’s assets are diversified across specialist sub-advisers. Fund Benchmark Russell 1000 Index Top 10 Holdings % Sector Weighting % Apple Inc. 2.6 Information Technology 24.6 JPMorgan Chase & Co. 1.7 Financials 15.1 Chevron Corp. 1.7 Health Care 13.3 Qualcomm Inc. 1.7 Consumer Discretionary 12.0 Wells Fargo & Co. 1.5 Energy 10.8 Microsoft Corp. 1.5 Industrials 9.3 AT&T Inc. 1.3 Consumer Staples 6.4 Conocophillips 1.2 Materials 3.1 Pfizer Inc. 1.1 Telecomm Services 2.8 Procter & Gamble Co. 1.1 Utilities 2.5 Total 15.6 Underlying Managers Aronson & Johnson & Ortiz 15.8 LSV Asset Management 15.8 Legg Mason - Growth Equity 11.2 Brown Investment Advisory 10.2 Neuberger Berman 10.2 Quantitative Management Associates 10.2 Delaware Investments 9.2 Legg Mason - Value Equity 9.2 WestEnd Advisors 8.2 Fund Total 100.00 Market Capitalisation Breakdown (USD) Weight (%) Greater than 50 Billion 34.3 Between 20 and 50 Billion 26.1 Between 10 and 20 Billion 19.2 Between 1 and 10 Billion 20.2 Less than 1 Billion 0.3 26
  • 29.
    Canada Life /SEI Manager-of-Managers Fund Quarter 1, 2011 CL SEI UK Equity Fund P Low Medium High Investment Objective and Strategy Fund Performance The SEI UK Equity Fund aims to achieve long-term capital Q1 11 1 Yr 2 Yr p.a 3 Yr p.a 4 Yr p.a growth and income by investing primarily in a broadly -2.6% 6.4% 28.7% -2.0% -9.0% diversified portfolio of UK equity securities. Following a manager-of managers approach, the fund’s assets are diversified across specialist sub-advisers. Fund Benchmark FTSE All Share Index Top 10 Holdings % Sector Weighting % Vodafone Group Plc 4.0 Financials 19.3 Rio Tinto Plc 3.4 Industrials 15.4 BP Plc 3.1 Energy 14.0 BGGroup Plc 3.0 Materials 12.8 HSBC Holdings Plc 2.7 Consumer Discretionary 11.8 Glaxosmithkline Plc 2.6 Consumer Staples 9.2 Astrazeneca Plc 2.5 Health Care 6.2 Royal Dutch Shell Plc (Cl B) 2.4 Telecomm Services 5.4 BHP Billiton Plc 2.3 Information Technology 4.5 Barclays Plc 2.0 Utilities 1.5 Total 28.0 Underlying Managers Jupiter Asset Management 20.4 Invesco Asset Management 19.4 Mirabaud Investment Management 19.4 L.A Capital Management 17.9 Investec Asset Management 12.8 Standard Life Investments 10.2 Fund Total 100.00 Market Capitalisation Breakdown (USD) Weight (%) Greater than 50 Billion 35.4 Between 20 and 50 Billion 11.7 Between 10 and 20 Billion 8.7 Between 1 and 10 Billion 40.1 Less than 1 Billion 4.1 27
  • 30.
    Canada Life /SEI Manager-of-Managers Fund Quarter 1, 2011 CL SEI Pacific Basin (Ex-Japan) Equity Fund P Low Medium High Investment Objective and Strategy Fund Performance The SEI Pacific Basin (ex-Japan) Equity Fund aims to achieve Q1 11 1 Yr 2 Yr p.a 3 Yr p.a 4 Yr p.a long-term growth of capital and income by investing primarily in -4.6% 7.1% 34.9% 7.6% 2.0% a broadly diversified portfolio of Pacific Basin (ex-Japan) equity securities. Following a manager-of-managers approach, the fund’s assets are diversified across specialist sub-advisers. Fund Benchmark MSCI Pacific ex Japan Index Top 10 Holdings % Country Allocation % BHP Billiton Ltd. 7.6 Australia 56.3 Westpac Banking Corp. 4.4 Hong Kong 23.5 National Australia Bank Ltd. 4.3 Singapore 8.8 Australia & New Zealand Banking Group Ltd. 4.1 China 4.0 Rio Tinto Ltd. 3.5 United Kingdom 2.5 DBS Group Holdings Ltd. 3.2 Korea 2.2 Commonwealth Bank Of Australia 2.3 Taiwan 1.3 Wesfarmers Ltd. 1.9 Thailand 0.5 Oil Search Ltd. 1.8 Malaysia 0.3 Cheung Kong (Holdings) Ltd. 1.8 New Zealand 0.3 Total 34.7 Canada 0.3 Underlying Managers Sector Weighting % Lloyd George Investments Management 40.0 Financials 42.3 Maple-Brown Abbott 32.0 Materials 16.8 Capital International 28.0 Industrials 9.4 Fund Total 100.00 Consumer Discretionary 7.4 Consumer Staples 7.1 Energy 6.1 Information Technology 4.3 Telecomm Services 3.0 Health Care 2.5 Utilities 1.2 Market Capitalisation Breakdown (USD) Weight (%) Greater than 50 Billion 28.7 Between 20 and 50 Billion 15.7 Between 10 and 20 Billion 21.2 Between 1 and 10 Billion 33.0 Less than 1 Billion 1.5 28
  • 31.
    Canada Life /SEI Manager-of-Managers Fund Quarter 1, 2011 CL SEI Japan Equity Fund P Low Medium High Investment Objective and Strategy Fund Performance The investment objective of the SEI Japan Equity Fund is to Q1 11 1 Yr 2 Yr p.a 3 Yr p.a 4 Yr p.a achieve long-term growth of capital and income by investing -9.2% -1.7% 14.8% -2.9% -10.5% primarily in a broadly diversified portfolio of Japanese equity securities. Following a manager-of-managers approach, the fund’s assets are diversified across specialist sub-advisers. Fund Benchmark TOPIX Top 10 Holdings % Sector Weighting % Sumitomo Mitsui Financial Group Inc. 2.8 Industrials 23.0 Toyota Motor Corp. 2.4 Financials 18.9 Nippon Telegraph & Telephone Corp. 2.0 Consumer Discretionary 17.1 Astellas Pharma Inc. 1.9 Information Technology 15.7 Sumitomo Corp. 1.9 Materials 6.1 Mitsubishi UFJ Financial Group Inc. 1.9 Health Care 5.9 Nissan Motor Co. Ltd. 1.7 Consumer Staples 4.7 Mitsui & Co. Ltd. 1.5 Telecomm Services 4.1 Softbank Corp. 1.5 Energy 2.7 Marubeni Corp. 1.5 Utilities 1.9 Total 19.0 Underlying Managers JPMorgan Asset Management 31.6 Capital International 25.5 Acadian Asset Management 22.5 Analytic Investors 20.4 Fund Total 100.00 Market Capitalisation Breakdown (USD) Weight (%) Greater than 50 Billion 8.6 Between 20 and 50 Billion 17.8 Between 10 and 20 Billion 21.4 Between 1 and 10 Billion 44.6 Less than 1 Billion 7.6 29
  • 32.
    Canada Life /SEI Manager-of-Managers Fund Quarter 1, 2011 CL SEI Emerging Markets Equity Fund P Low Medium High Investment Objective and Strategy Fund Performance The SEI Emerging Markets Equity Fund aims to achieve Q1 11 1 Yr 2 Yr p.a 3 Yr p.a 4 Yr p.a capital appreciation by investing primarily in securities of -5.5% 8.7% 37.0% 4.8% 2.4% emerging market issuers. Following a manager-of-managers approach, the fund’s assets are diversified across specialist sub-advisers. Fund Benchmark MSCI Emerging Markets Index Top 10 Holdings % Country Allocation % Samsung Electronics Co. Ltd. 3.0 Brazil 16.2 Gazprom OaO ADS 1.3 China 15.8 MTN Group Ltd. 1.3 Korea 12.7 China Mobile Ltd. 1.1 Taiwan 10.4 Taiwan Semiconductor Manufacturing Co. Ltd. 1.0 Russia 8.0 Petrobras Petroleo Brasileiro (Ord) 1.0 India 7.1 HTC Corp. 0.9 South Africa 7.1 Lukoil Holdings ADS 0.8 Mexico 3.6 Hyundai Mobis Co. Ltd. 0.8 Indonesia 2.7 Standard Bank Group Ltd. 0.8 Turkey 2.4 Total 12.0 Other 14.0 Underlying Managers Sector Weighting % Artisan Partners 20.4 Financials 21.6 PanAgora Asset Management 20.4 Information Technology 14.5 The Boston Company Asset Management 20.4 Energy 14.0 Lazard Asset Management 14.3 Materials 13.5 Neuberger Berman 14.3 Consumer Discretionary 10.4 JO Hambro Capital Management 10.2 Industrials 8.6 Fund Total 100.00 Telecomm Services 7.3 Consumer Staples 5.4 Health Care 2.9 Utilities 1.9 Market Capitalisation Breakdown (USD) Weight (%) Greater than 50 Billion 11.2 Between 20 and 50 Billion 11.7 Between 10 and 20 Billion 8.3 Between 1 and 10 Billion 58.6 Less than 1 Billion 10.2 30
  • 33.
    Canada Life /SEI Manager-of-Managers Fund Quarter 1, 2011 CL SEI Global Fixed Income Fund P Low Medium High Investment Objective and Strategy Fund Performance The SEI Global Fixed Income Fund aims to generate current Q1 11 1 Yr 2 Yr p.a 3 Yr p.a 4 Yr p.a income and exhibit principal volatility similar to that of the -0.9% 0.8% 5.6% 0.6% 0.5% global developed fixed income market as a whole. Following a manager-of-managers approach, the fund’s assets are diversified across specialist sub-advisers Fund Benchmark Lehman Global Aggregate Index Top 10 Holdings % Country Allocation % BUNDESREPUB DEUT 3.50% 1/4/16 2.2 Euro 27.9 JAPAN-86 0.6% 09/20/14 /JPY/ 2.0 Japan 23.4 JAPAN-113 2.1% 09/20/29 /JPY/ 1.6 USA 20.9 JAPAN-112 2.1% 06/20/29 /JPY/ 1.5 Other 15.1 US TREAS NTS 3.5% 05/15/20 1.5 UK 8.7 JAPAN-79 0.7% 12/20/13 /JPY/ 1.3 Canada 4.1 EUROPEAN IN 3.875%10/15/16/EUR 1.3 JAPAN-304 1.3% 09/20/19 /JPY/ 1.2 BONOS Y O 5.5% 04/30/21 /EUR/ 1.2 JAPAN GOV 2.5% 12/21/20/JPY/ 1.1 Total 14.8 Underlying Managers Quality Allocation % AllianceBernstein 32.00 Treasury 82.8 First International Advisors 28.00 Agency 8.2 Wellington Management Company 24.00 Credit 6.5 UBS Global Asset Management 16.00 Collateralized 1.2 Fund Total 100.00 Cash 1.3 Quality Exposure % Aaa and Treasury 53.4 Aa 32.9 A 5.9 Baa 4.4 Ba and Below 3.3 31
  • 34.
    Canada Life /SEI Manager-of-Managers Fund Quarter 1, 2011 CL SEI Global Opportunistic Fixed Income Fund P Low Medium High Investment Objective and Strategy Fund Performance The SEI Global Opportunistic Fixed Income Fund aims to Q1 11 1 Yr 2 Yr p.a 3 Yr p.a 4 Yr p.a generate current income consistent with the preservation of -0.2% 2.7% 9.2% 2.6% 2.4% capital by investing primarily in global fixed income markets. Following a manager-of-managers approach, the fund’s assets are diversified across specialist sub-advisers. Fund Benchmark Lehman Global Aggregate Hedged Index Top 10 Holdings % Country Allocation % FGLMC PA90761 4.50% 01/01/40 2.3 USA 59.3 FREDDIE MAC GOLD POOL 1.1 Euro 26.4 CANADA GOVT 3.75% 6/1/19 /CAD/ 1.1 UK 6.9 US TREAS NTS 2.5% 03/31/15 0.9 Canada 2.9 BUNDESREP 2.5% 01/04/21 /EUR/ 0.8 Other 2.4 FEDERAL NATL MTG ASSN FR 2.625%112014 0.7 Japan 2.1 FNMA PMA0023 5.00% 04/01/29 0.7 GENERAL ELEC C 5.625% 05/01/18 0.7 FGLMC PG12491 5.00% 01/01/22 0.7 FNMA PAD0470 5.00% 02/01/49 0.6 Total 9.5 Underlying Managers Market Value Weighting % TCW Investment Management Company 24.3 Treasury 12.5 Wellington Management Company 21.8 Agency 16.0 DB Advisors 20.3 Credit 35.3 Jennison Associates 18.0 Collateralized 37.7 Schroders Investment Management 15.6 Cash -1.4 Fund Total 100.00 Quality Exposure % Aaa and Treasury 54.1 A 17.1 Baa 14.3 Aa 12.0 Ba and Below 2.5 32
  • 35.
    Canada Life /Morgan Stanley European Property Fund Quarter 1, 2011 Fund Description The Canada Life/Morgan Stanley European Property Fund provides a highly efficient and cost-effective way of gaining allows investors to access the potential returns available such exposure. As an asset class, real estate can provide from the European commercial property market in one important advantages to investors: historically low volatility diversified fund. The fund invests in a professionally managed relative to equities, attractive returns and a low correlation portfolio of European property companies and is managed by to other asset classes. a team of property experts at Morgan Stanley with over 40 years of collective experience of real estate markets. Real estate securities are indirect investments in property whose long-term returns depend on the underlying real estate market. Broad geographic and sector diversification would be prohibitively expensive for a direct real estate investor. However, an indirect real estate portfolio structure Top 10 Holdings Fund Performance to 31/03/11 Company % Q1 2011 4.4% Unibail-Rodamco SE 10.22 1 Year 12.2% Land Securities PLC 5.31 2 Year p.a 43.1% Klepierre 5.27 3 Year p.a -6.9% PSP Swiss Property AG 4.54 Source: Moneymate. Performance is net of management fees. Icade 4.54 Hammerson PLC 4.46 British Land Co. Ltd 4.07 Gecina 3.60 Beni Stabili SPA 3.04 Corio NV 3.01 Total 48.06 Equity Geographic Distribution Finland Switzerland 1.85% 6.37% Sweden 4.67% UK Italy 3.04% 37.90% Belgium 1.35% France 30.42% Netherlands Austria 7.06% 2.38% Cash & equivalents Germany 1.94% 3.02% Warning: Past performance is not a reliable guide to future performance. The value of your investment may go down as well as up. The Canada Life/Morgan Stanley European Property Fund was launched on 30/7/07. Important Information: This fact sheet does not form part of any contract. The information contained in this document is based on current legislation and is, therefore, subject to change. The contents are intended as a guideline only and should not be construed as an interpretation of the law. For full details of all our products, please refer to the specific product policy conditions. You should always seek advice of an appropriately qualified professional. Canada Life Assurance (Ireland) Limited is regulated by the Central Bank of Ireland. 33
  • 36.
    Canada Life /Merrion Managed Fund Quarter 1, 2011 Fund Description The Canada Life/Merrion Managed Fund is managed by Merrion Investment Managers. The fund is designed to provide balanced long-term growth by actively managing the distribution of the portfolio between cash, bonds, equities and property according to economic conditions. The fund maintains an average market weight in property through its exposure to Canada Life’s Property Fund while the remainder of the fund is invested in Merrion Investment Manager’s Managed Fund thus providing broad diversification in quality equities, bonds, property and cash. Top 10 Holdings Fund Performance to 31/03/11 Canada Life/Merrion Managed Fund % Q1 2011 1 yr p.a 3 yr p.a % iShares MSCI World 3.0 5 iShares MSCI Emerging Markets 1.7 4 Financial Select Sector SPDR 1.3 3 Siemens 1.2 2 Microsoft 1.1 1 CRH 1.1 0 iShares MSCI Pacific ex Japan 1.1 -1 iShares MSCI Japan 1.0 ChevronTexaco 1.0 -2 iShares MSCI Asia ex Japan 1.0 -3 Canada Life/Merrion Managed Fund Category Average Managed Dynamic The Canada Life/Merrion Managed Fund was launched on 1/10/07. Source: Moneymate. Performance is net of management fees. Asset Distribution Equity Geographic Distribution Equity Sectoral Distribution Property Ireland Utilities Consumer 5.0% Cash Pacific Basin Telecoms 1.8% Discretionary 7.5% 11.6% 9.7% 3.5% 8.3% UK Information Consumer 12.4% Technology Staples Japan 11.4% 5.7% Fixed Interest 8.0% 11.1% Energy 13.7% Industrials 26.9% Equities 72.3% US Europe 34.7% 27.7% Financials Healthcare 20.5% 8.2% Warning: Past performance is not a reliable guide to future performance. The value of your investment may go down as well as up. Important Information: This fact sheet does not form part of any contract. The information contained in this document is based on current legislation and is, therefore, subject to change. The contents are intended as a guideline only and should not be construed as an interpretation of the law. For full details of all our products, please refer to the specific product policy conditions. You should always seek advice of an appropriately qualified professional. Merrion Capital Investment Managers Limited (trading as Merrion Investment Managers is regulated by the Central Bank of Ireland. Canada Life Assurance (Ireland) Limited is regulated by the Central Bank of Ireland. 34
  • 37.
  • 38.
    Canada Life /Setanta Pension Unitised With Profits Fund Quarter 1, 2011 Fund Description The Unitised With Profits Fund (UWP) operates like a At maturity a terminal bonus may be applied if the underlying unit-linked fund, except that investment return to assets have outperformed the declared bonuses. policyholders is smoothed and guaranteed not to fall. The With-Profits Fund is a low-risk fund. Returns are distributed in the form of a bonus rate declared by Canada Life based on various factors including the performance of the underlying assets. Returns are smoothed to the investor in that the bonus rate will endeavour to reflect the performance of the assets over the long term, allowing the investor to avoid short-term volatility in the markets. Top 10 Holdings Annual Bonus History Company Sector % Year Pension 95 – 96 9.0% Exxon Mobil Energy 2.4 96 – 97 9.0% Pfizer Healthcare 2.1 97 – 98 9.0% General Dynamics Industrials & Materials 2.0 98 – 99 9.0% CRH Industrials & Materials 1.9 99 – 00 8.0% Total Energy 1.9 00 – 01 7.0% ENI Energy 1.8 01 – 02 6.25% 02 – 03 5.25% Johnson & Johnson Healthcare 1.8 03 – 04 3.75% BP Energy 1.8 04 – 05 3.0% Owens Illinois New Industrials & Materials 1.7 05 – 06 3.0% DCC Industrials & Materials 1.7 06 – 07 3.0% 07 - 08 3.0% 08 - 09 2.75% 09 - 10 1.0% 10 - 11 0.0% Bonus rates are declared net of management charges Asset Distribution Equity Geographic Distribution Equity Sectoral Distribution Japan Telecoms/Utilities Consumer Property Ireland Discretionary Cash 6.0% 7.9% 2.0% Pacific & Emerging 5.8% 9.9% 6.2% UK Markets 10.3% Information Consumer 8.6% Technology Staples 12.1% 11.0% Equity Europe 36.9% Fixed Interest 20.4% Industrials 54.9% Energy & Materials 15.8% 16.4% USA Healthcare 48.9% Financials 12.6% 14.3% Warning: Past performance is not a reliable guide to future performance. The value of your investment may go down as well as up. Important Information: This fact sheet does not form part of any contract. The information contained in this document is based on current legislation and is, therefore, subject to change. The contents are intended as a guideline only and should not be construed as an interpretation of the law. For full details of all our products, please refer to the specific product policy conditions. You should always seek advice of an appropriately qualified professional. Setanta Asset Management Limited is regulated by the Central Bank of Ireland. Canada Life Assurance (Ireland) Limited is regulated by the Central Bank of Ireland. 36
  • 39.
    Canada Life /Setanta Pension Balanced Dividend Fund Quarter 1, 2011 Fund Description The Balanced Dividend Fund is an actively managed balanced dividend must be less than 80% of earnings fund investing 66% in equities and 34% in fixed interest company debt must be ‘investment grade‘ (if rated) securities. The equity portion of the fund aims to hold c. 40 company gearing below 100%. stocks that pay above average dividends. The fixed interest portion of the fund invests in EU government bonds. The ratio of debt to equity should be not more than 100%, except for utility companies (water, electricity etc.) where The fund does not target high dividend payers indiscriminately we use a hurdle of 200%, and for financial stocks, where no for the equity securities; a set of desired criteria is applied maximum is applied. when filtering potential candidates for the fund. The desired criteria are: The maximum exposure to currencies other than the euro is capped at 10% of the value of the fund. The Balanced dividend yield 20% in excess of the MSCI World Index Dividend Fund is managed by Setanta Asset Management no cut in dividend in the last 5 years Limited (“Setanta“) . market capitalisation of at least 500m (excluding Irish stocks) Top 10 Holdings Fund Performance to 31/03/11 Q1 2011 1 yr p.a 3 yr p.a 5 yr p.a Company Sector % 10 CRH Industrials / Materials 3.6 8 Sanofi-Aventis Healthcare 3.5 6 Fortum Telecoms / Utilities 3.1 Lockheed Martin Industrials / Materials 2.8 4 Solvay Industrials / Materials 2.6 2 DCC Industrials / Materials 2.5 0 Wincor Nixdorf Information Technology 2.5 -2 Svenska Handbkn Financials 2.5 -4 Sasol Energy 2.4 -6 Thai Beverage Public Consumer Staples 2.4 Portfolio Financials Canada Life/Setanta Pension Dividend Q1 2011 Category Average Managed Balanced Dividend Yield 3.8% P/E Ratio 11.8x Performance Source: Moneymate & Bloomberg (Benchmark). Source: Bloomberg & individual company reports. These figures are based on last years dividend in some cases. The gross yield is before any withholding taxes on the individual shares. It is also before taking account of any exit tax that may apply. Asset Distribution Equity Geographic Distribution Equity Sectoral Distribution Consumer Japan Ireland Discretionary Pacific & Emerging 4.4% 6.5% Telecoms/Utilities 6.6% Markets 18.4% Consumer 11.5% Staples UK 10.9% 19.1% Information Energy Technology 11.1% 6.3% Industrials Europe USA & Materials Financials 38.5% 20.0% 18.6% 14.2% Healthcare 13.8% Warning: Past performance is not a reliable guide to future performance. The value of your investment may go down as well as up. Important Information: This fact sheet does not form part of any contract. The information contained in this document is based on current legislation and is, therefore, subject to change. The contents are intended as a guideline only and should not be construed as an interpretation of the law. For full details of all our products, please refer to the specific product policy conditions. You should always seek advice of an appropriately qualified professional. Setanta Asset Management Limited is regulated by the Central Bank of Ireland. Canada Life Assurance (Ireland) Limited is regulated by the Central Bank of Ireland. 37
  • 40.
    Canada Life /Setanta Pension Global Equity Fund Quarter 1, 2011 Fund Description The Global Equity Fund is an actively managed equity superior financial track record portfolio, which holds c. 100-140 global stocks. The competitive advantage and a sustainable business model investment objective of the Global Equity Fund is to secure within their industry long-term capital growth by investing in a range of Irish and focused on profitability and can demonstrate an ability to international equities. earn cash flow returns in excess of their cost of capital over the business cycle The fund is managed by Setanta Asset Management Limited do not carry excessive debt levels. (“Setanta“). The fund is the cornerstone of Setanta‘s investment process. Setanta is a value investor in quality companies and builds the portfolio from the bottom up. Stocks are picked within a global sector framework, with an emphasis on the following key characteristics: Top 10 Holdings Fund Performance to 31/03/11 % Q1 2011 1 yr p.a 3 yr p.a 5 yr p.a 10 yr p.a Company Sector % 8 Exxon Mobil Energy 2.4 Pfizer Healthcare 2.1 6 General Dynamics Industrials & Materials 2.0 CRH Industrials & Materials 1.9 4 Total Energy 1.9 2 Johnson & Johnson Healthcare 1.8 ENI Energy 1.7 0 Owens Illinois Industrials & Materials 1.7 BP Energy 1.7 -2 DCC Industrials & Materials 1.7 Canada Life/Setanta Pension Global Equity Category Average Flexible Equity Performance Source: Moneymate & Bloomberg (Benchmark). Asset Distribution Equity Geographic Distribution Equity Sectoral Distribution Cash Telecoms/Utilities Consumer Japan Ireland Discretionary 1.3% 7.9% Pacific & Emerging 6.1% 5.8% UK 9.9% Markets 10.2% Information Consumer 7.6% Technology Staples 12.4% 10.9% Europe 21.0% Industrials Energy & Materials 15.5% 16.6% USA 49.4% Healthcare Financials Equity 12.8% 14.1% 98.7% Warning: Past performance is not a reliable guide to future performance. The value of your investment may go down as well as up. Important Information: This fact sheet does not form part of any contract. The information contained in this document is based on current legislation and is, therefore, subject to change. The contents are intended as a guideline only and should not be construed as an interpretation of the law. For full details of all our products, please refer to the specific product policy conditions. You should always seek advice of an appropriately qualified professional. Setanta Asset Management Limited is regulated by the Central Bank of Ireland. Canada Life Assurance (Ireland) Limited is regulated by the Central Bank of Ireland. 38
  • 41.
    Canada Life /Setanta Pension Equity Dividend Fund Quarter 1, 2011 Fund Description The Equity Dividend Fund is an actively managed equity company debt must be ‘investment grade‘ (if rated) portfolio which aims to hold c. 40 stocks that pay above company gearing below 100%. average dividends. The fund does not target high dividend payers indiscriminately; a set of desired criteria is applied The ratio of debt to equity should be not more than 100%, when filtering potential candidates for the fund. The desired except for utility companies (water, electricity etc.) where criteria are: we use a hurdle of 200%, and for financial stocks, where no maximum is applied. dividend yield 20% in excess of the MSCI World Index no cut in dividend in the last five years The maximum exposure to currencies other than the euro is market capitalisation of at least 500m (excluding Irish capped at 10% of the value of the fund. The Equity Dividend stocks) Fund is managed by Setanta Asset Management Limited dividend must be less than 80% of earnings (“Setanta“) . Top 10 Holdings Fund Performance to 31/03/11 Q1 2011 1 yr p.a 3 yr p.a 5 yr p.a Company Sector % 15 CRH Industrials / Materials 3.6 12 Sanofi-Aventis Healthcare 3.5 9 Fortum Telecoms / Utilities 3.1 Lockheed Martin Industrials / Materials 2.8 6 Solvay Industrials / Materials 2.6 3 DCC Industrials / Materials 2.5 0 Wincor Nixdorf Information Technology 2.5 -3 Svenska Handbkn Financials 2.5 -6 Sasol Energy 2.4 -9 Thai Beverage Public Consumer Staples 2.4 Canada Life/Setanta Pension Equity Dividend Portfolio Financials Q1 2011 Category Average Flexible Equity Dividend Yield 3.8% P/E Ratio 11.8x Performance Source: Moneymate & Bloomberg (Benchmark). Source: Bloomberg & individual company reports. These figures are based on last years dividend in some cases. The gross yield is before any withholding taxes on the individual shares. It is also before taking account of any exit tax that may apply. Asset Distribution Equity Geographic Distribution Equity Sectoral Distribution Consumer Cash Japan Ireland Pacific & Emerging Discretionary 6.8% 4.4% 6.5% Telecoms/Utilities Markets 6.6% 18.4% Consumer 11.5% UK Staples 19.1% 10.9% Equity 94.3% Information Energy Technology 11.1% 6.3% Industrials Europe USA & Materials Financials 38.5% 20.0% 18.6% 14.2% Healthcare 13.8% Warning: Past performance is not a reliable guide to future performance. The value of your investment may go down as well as up. Important Information: This fact sheet does not form part of any contract. The information contained in this document is based on current legislation and is, therefore, subject to change. The contents are intended as a guideline only and should not be construed as an interpretation of the law. For full details of all our products, please refer to the specific product policy conditions. You should always seek advice of an appropriately qualified professional. Setanta Asset Management Limited is regulated by the Central Bank of Ireland. Canada Life Assurance (Ireland) Limited is regulated by the Central Bank of Ireland. 39
  • 42.
    Canada Life /Setanta Pension Focus 15 Fund Quarter 1, 2011 Fund Description The Focus 15 Fund is an actively managed, concentrated focused on profitability and can demonstrate an ability to equity portfolio, which holds c. 15 international (ex-Ireland) earn cash flow returns in excess of their cost of capital stocks. The Focus 15 Fund is managed by Setanta Asset over the business cycle Management Limited (“Setanta“). Setanta is a value investor do not carry excessive debt levels. in quality companies. Setanta builds the portfolio from the bottom up, using the stocks researched by the sector Clearly, Focus 15 is likely to be more volatile than more specialists, who apply the following key characteristics: broadly-based funds; it is therefore only suitable for those investors with experience of the stock market. superior financial track record competitive advantage and a sustainable business model within their industry Fund Holdings Fund Performance to 31/03/11 Company Sector % Q1 2011 1 yr p.a 3 yr p.a 5 yr p.a 10 yr p.a % Pfizer Healthcare 9.0 18 Sysco Consumer Staples 8.2 15 Everest Re Group Financials 7.7 Tidewater Energy 7.0 12 Steris Healthcare 7.0 9 Johnson & Johnson Healthcare 6.9 Total Energy 6.8 6 MI Developments Financials 6.8 3 Astellas Pharmaceutical Healthcare 6.7 Wincor Nixdorf Information Technology 6.6 0 NTT Docomo Telecoms / Utilities 6.1 -3 Motor Consumer Discretionary 5.9 Belgacom Telecoms / Utilities 4.0 Canada Life/Setanta Pension Focus 15 Nokia Information Technology 3.1 Category Average Flexible Equity OPAP Consumer Discretionary 2.1 Komori Industrials & materials 1.8 Performance Source: Moneymate & Bloomberg (Benchmark). Cash 4.3 Asset Distribution Equity Geographic Distribution Equity Sectoral Distribution Cash Consumer 4.3% Telecoms/Utilities Discretionary Japan 10.7% 8.5% 21.5% Consumer Information Staples Technology 8.6% 10.1% Industrials Pacific USA & Materials Energy & Emerging 46.7% 1.9% 14.4% Markets 8.0% Europe Healthcare 23.7% 30.8% Financials Equity 15.1% 95.7% Warning: Past performance is not a reliable guide to future performance. The value of your investment may go down as well as up. Important Information: This fact sheet does not form part of any contract. The information contained in this document is based on current legislation and is, therefore, subject to change. The contents are intended as a guideline only and should not be construed as an interpretation of the law. For full details of all our products, please refer to the specific product policy conditions. You should always seek advice of an appropriately qualified professional. Setanta Asset Management Limited is regulated by the Central Bank of Ireland. Canada Life Assurance (Ireland) Limited is regulated by the Central Bank of Ireland. 40
  • 43.
    Canada Life /Setanta Pension Irish Equity Fund Quarter 1, 2011 Fund Description The Irish Equity Fund is an actively managed equity focused on profitability and can demonstrate an ability to portfolio which aims to hold stocks quoted on the Irish earn cash flow returns in excess of their cost of capital stock exchange. The fund is managed by Setanta Asset over the business cycle Management Limited (“Setanta“). Setanta is a value investor do not carry excessive debt levels. in quality companies. Setanta builds the portfolio from the bottom up, picking stocks within a sector framework, with an The Irish Equity Fund is a relatively concentrated equity fund emphasis on the following key characteristics: with exposure to stocks from only one country and is likely to be more volatile than more broadly-based funds. superior financial track record competitive advantage and a sustainable business model within their industry Top 10 Holdings Fund Performance to 31/03/11 % 01 2011 1 yr p.a 3 yr p.a 5 yr p.a 10 yr p.a Company Sector % 20 DCC Industrials & Materials 9.3 15 Total Produce Consumer Staples 8.8 10 Irish Continental Industrials & Materials 8.3 5 Kingspan Industrials & Materials 7.8 0 CRH Industrials & Materials 7.4 -5 Abbey Industrials & Materials 7.3 -10 Dragon Oil Energy 6.3 -15 Grafton Group Industrials & Materials 6.2 -20 Kerry Group Consumer Staples 6.2 -25 Ryanair Holdings Industrials & Materials 6.2 Canada Life/Setanta Irish Equity (Core Fund) ISEQ Index Performance Source: Unit prices from CLFIS UK Limited (Fund), MSCI (90% local, 10% Euro) & Bloomberg (Benchmark). Setanta fund returns are shown net of management charges. Valuation Statistics Source: Style Research. Performance is net of management fees. Asset Distribution Equity Sectoral Distribution Consumer Cash Discretionary 0.1% 5.8% Consumer Staples 25.3% Industrials & Materials 57.5% Energy 6.3% Financials 1.1% Equity Healthcare 99.9% 4.0% Warning: Past performance is not a reliable guide to future performance. The value of your investment may go down as well as up. Important Information: This fact sheet does not form part of any contract. The information contained in this document is based on current legislation and is, therefore, subject to change. The contents are intended as a guideline only and should not be construed as an interpretation of the law. For full details of all our products, please refer to the specific product policy conditions. You should always seek advice of an appropriately qualified professional. Setanta Asset Management Limited is regulated by the Central Bank of Ireland. Canada Life Assurance (Ireland) Limited is regulated by the Central Bank of Ireland. 41
  • 44.
    Canada Life /Setanta Pension Managed Fund Quarter 1, 2011 Fund Description The investment objective of the Pension Managed Fund is to superior financial track record secure long-term capital growth. The fund seeks to achieve competitive advantage and a sustainable business model its objective by investing primarily in a range of Irish and within their industry international equities and bonds. The fund will hold between focused on profitability and can demonstrate an ability to 50-80% of its assets in equities with the balance consisting earn cash flow returns in excess of their cost of capital of bonds, property and cash over the business cycle do not carry excessive debt levels. The fund is managed by Setanta Asset Management Limited (“Setanta“). Setanta is a value investor in quality companies. Setanta builds the portfolio from the bottom up, picking stocks within a global sector framework, with an emphasis on the following key characteristics: Top 10 Holdings Fund Performance to 31/03/11 Q1 2011 1 yr p.a 3 yr p.a 5 yr p.a 10 yr p.a Company Sector % % Exxon Mobil Energy 1.6 6 CRH Industrials & Materials 1.5 5 DCC Industrials & Materials 1.4 4 Pfizer Healthcare 1.4 3 Total Energy 1.4 2 General Dynamics Industrials & Materials 1.3 1 ENI Energy 1.2 0 Johnson & Johnson Healthcare 1.2 -1 BP Energy 1.2 -2 Owens Illinois Industrials & Materials 1.1 Canada Life/Setanta Pension Managed Average Managed Fund (Mercer Survey) Performance Source: Mercer Managed Fund Survey. Asset Distribution Equity Geographic Distribution Equity Sectoral Distribution Japan 6.0% Telecoms/Utilities Consumer Property Pacific & Emerging Ireland Discretionary Cash 7.6% 2.8% Markets 9.2% 9.7% 6.4% Information Commodities Fixed Interest 7.9% UK Consumer Technology 2.4% 19.4% 9.9% Staples 11.6% 11.3% Europe 19.9% Industrials Energy & Materials 15.7% 18.3% Equity 69.0% USA Healthcare Financials 47.1% 12.4% 13.5% Warning: Past performance is not a reliable guide to future performance. The value of your investment may go down as well as up. Important Information: This fact sheet does not form part of any contract. The information contained in this document is based on current legislation and is, therefore, subject to change. The contents are intended as a guideline only and should not be construed as an interpretation of the law. For full details of all our products, please refer to the specific product policy conditions. You should always seek advice of an appropriately qualified professional. Setanta Asset Management Limited is regulated by the Central Bank of Ireland. Canada Life Assurance (Ireland) Limited is regulated by the Central Bank of Ireland. 42
  • 45.
    Canada Life /Setanta Passive Equity Fund Quarter 1, 2011 Fund Description This fund invests in the shares of a large number of companies from around the world. The companies are chosen simply by reference to their size. There is no attempt to select the “winners”/avoid the “losers”, hence the description “passive”. Effectively the fund owns a slice of most of the companies quoted on the world’s major stock markets and its value will rise and fall in line with world share prices. Top 10 Holdings Fund Performance to 31/03/11 Sector % Q1 2011 1 yr p.a 3 yr p.a 5 yr p.a Company % Exxon Mobil Corp Energy 1.7 8 Apple Information Technology 1.3 6 Chevron Corp Industrials/Materials 0.9 General Electric Co Industrials/Materials 0.8 4 IBM Corp Information Technology 0.8 Nestle Consumer Staples 0.8 2 Microsoft Corp Information Technology 0.8 HSBC Holdings (GB) Financials 0.7 0 AT&T Telecoms/Utilities 0.7 JPMorgan Chase & Co Financials 0.7 -2 -4 Canada Life/Setanta Passive Equity Category Average Flexible Equity Source: Moneymate. Performance is net of management fees. Equity Geographic Distribution Ireland Japan UK 0.1% 10.0% 9.7% Pacific & Emerging Markets 6.1% Europe 19.5% USA 54.5% Warning: Past performance is not a reliable guide to future performance. The value of your investment may go down as well as up. Important Information: This fact sheet does not form part of any contract. The information contained in this document is based on current legislation and is, therefore, subject to change. The contents are intended as a guideline only and should not be construed as an interpretation of the law. For full details of all our products, please refer to the specific product policy conditions. You should always seek advice of an appropriately qualified professional. Setanta Asset Management Limited is regulated by the Central Bank of Ireland. Canada Life Assurance (Ireland) Limited is regulated by the Central Bank of Ireland. 43
  • 46.
    Canada Life /Setanta Pension Property Fund Quarter 1, 2011 Fund Description This fund invests in commercial properties - office, retail and The Property Fund is suitable for investors who wish to gain warehousing. The fund is characterised by the quality of the investment exposure to the commercial property sector. property that makes up the portfolio and the tenants that Investors should understand that property investment is by occupy these properties. its nature less liquid than other asset classes. Currently, all of the properties are located in Ireland. Sample Property Holdings Fund Performance to 31/03/11 OFFICE % Q1 2011 1 yr p.a 3 yr p.a 5 yr p.a 10 yr p.a 10 Block C, Earlsfort Centre Tenant - Office of Public Works 5 Fund Weighting - 13.2% 0 RETAIL 45/46 Patrick Street, Cork -5 Tenant - C&J Clarke International -10 Fund Weighting - 3.8% INDUSTRIAL/WAREHOUSE -15 Swords Business Campus -20 Tenants - Air France, Client Logic, Eastern Health Board Fund Weighting - 10.2% Canada Life/Setanta Pension Property Category Average Property Source: Moneymate Asset Distribution Geographic Distribution Sectoral Distribution Cash Rest of Ireland 9.5% 16.5% Office 27.7% Retail Dublin city centre 41.7% Cork 44.4% 10.3% Cash & Bonds 9.5% Suburban Dublin Industrial Property 28.8% 21.1% 90.5% Warning: Past performance is not a reliable guide to future performance. The value of your investment may go down as well as up. Important Information: This fact sheet does not form part of any contract. The information contained in this document is based on current legislation and is, therefore, subject to change. The contents are intended as a guideline only and should not be construed as an interpretation of the law. For full details of all our products, please refer to the specific product policy conditions. You should always seek advice of an appropriately qualified professional. Setanta Asset Management Limited is regulated by the Central Bank of Ireland. Canada Life Assurance (Ireland) Limited is regulated by the Central Bank of Ireland. 44
  • 47.
    Canada Life PensionConsensus Fund Quarter 1, 2011 Fund Description The investment objective of the Consensus Fund is to secure The stock selection within each market is index stock long-term capital growth. The fund is designed to eliminate selection which means the weighting in each stock individual manager selection risk while achieving average represented within the relevant index is replicated. managed fund returns over the long term. The Consensus Fund is a medium-risk fund. It seeks to achieve its objective by investing in accordance with the average asset distribution of Irish Investment Managers Group Pension Managed Funds. Asset Distribution Fund Performance to 31/03/11 Cash % Q1 2011 1 yr p.a 3 yr p.a 5 yr p.a 10 yr p.a 6.9% Property 6 2.9% 5 Fixed Interest 4 15.1% 3 Equity 2 75.2% 1 0 -1 -2 -3 Equity Geographic Distribution Japan Ireland Canada Life/Setanta Pension Consensus Pacific & Emerging 4.5% 6.7% UK Average Managed Fund (Mercer Survey) Markets 13.3% 14.5% Source: Moneymate & Mercer Pooled Fund Survey (Benchmark). Europe USA 27.4% 33.5% Warning: Past performance is not a reliable guide to future performance. The value of your investment may go down as well as up. Important Information: This fact sheet does not form part of any contract. The information contained in this document is based on current legislation and is, therefore, subject to change. The contents are intended as a guideline only and should not be construed as an interpretation of the law. For full details of all our products, please refer to the specific product policy conditions. You should always seek advice of an appropriately qualified professional. Setanta Asset Management Limited is regulated by the Central Bank of Ireland. Canada Life Assurance (Ireland) Limited is regulated by the Central Bank of Ireland. 45
  • 48.
    Canada Life QuadriviumFund Quarter 1, 2011 Fund Description Fund Composition The investment objective of the Canada Life Quadrivium Fund The Quadrivium Fund invests in the following four asset classes: is to secure long-term capital growth. High-Yield Equities The fund seeks to achieve its objective by investing in four The Canada Life Dividend Fund is an equity fund that different asset classes – equities, bonds, property and specifically targets stable blue chip quality companies with commodities. By investing in Quadrivium investors can gain the ability to pay consistently strong dividends. access to a diversified portfolio invested across these four The Dividend Fund is a pure equity portfolio of actively asset classes. The fund provides exposure to international managed companies with an average of 40 holdings. shares, Irish & European commercial property, commodities and fixed interest assets, all within one fund. Property Irish Commercial Property The Canada Life Property Fund invests in a range of Asset Distribution commercial properties. The fund is currently fully invested in Irish commercial properties but will seek opportunities Fixed Interest 8.1% outside Ireland where appropriate. The fund is managed by a team of property specialists at Canada Life European Real Commodities Estate, who have over 20 years of property experience and 18.4% manage over €1.7 billion in property assets. Dividend Fund European Property 43.1% The Canada Life/Morgan Stanley European Property Fund European Property invests in a professionally managed portfolio of European 16.5% property companies, and is managed by a team of property Irish Property 13.9% experts at Morgan Stanley with over 40 years of collective experience of real estate markets. The fund invests in Asset Class Current Expected Allocation Range quoted European property companies through buying real estate securities. Real Estate securities are indirect Dividend Fund 43.1% 20% - 50% investments in property whose long-term returns depend on Irish Property 13.9% 10% - 25% the underlying real estate market. European Property 16.5% 10% - 25% Commodities 18.4% 0% - 25% Commodities The commodities allocation in the Quadrivium fund invests Fixed Interest 8.1% 0% - 25% in an Exchange Traded Fund (ETF) issued by ETF Securities. The ETFs All Commodities DJ-AIGCI is designed to track the Dow Jones-AIG Commodity sub-index. The Dow Jones-AIG Fund Performance Commodity sub-index invests in a broadly diversified index Q1 2011 1 Yr p.a 2 yr p.a 3 yr p.a that allows investors to track commodity futures returns % through a single fund. No related group of commodities (e.g 25 energy, precious metals, livestock or grains) may constitute 20 more than 33% of the index and no single commodity may constitute less than 2% or more than 15% of the index. 15 Commodities tend to behave differently to all other asset classes and for this reason are used as a good diversifier in 10 Canada Life Quadrivium Fund multi-asset portfolios. The ETFs are issued by ETF Securities. Diversified Funds Average 5 (Diversified Funds from Eagle Star, ETF Securities invest the assets backing the ETF with AIG. Irish Life & Canada Life) 0 Fixed Interest -5 The Canada Life Fixed Interest Fund invests in government gilts predominantly from eurozone countries. Gilts, or bonds -10 are essentially a form of debt. Governments and large Source: Moneymate. Performance is net of management fees. corporations use them to raise money for capital expenditure. This fund was launched on 22/10/07 Warning: Past performance is not a reliable guide to future performance. The value of your investment may go down as well as up. Important Information: This fact sheet does not form part of any contract. The information contained in this document is based on current legislation and is, therefore, subject to change. The contents are intended as a guideline only and should not be construed as an interpretation of the law. For full details of all our products, please refer to the specific product policy conditions. You should always seek advice of an appropriately qualified professional. Setanta Asset Management Limited is regulated by the Central Bank of Ireland. Canada Life Assurance (Ireland) Limited is regulated by the Central Bank of Ireland. 46
  • 49.
    Canada Life /Setanta Pension Fixed Interest Fund Quarter 1, 2011 Fund Description The Fixed Interest Fund invests predominantly in eurozone The fund has a minimum ‘A‘ credit rating investment level for government bonds. It may also hold corporate bonds and individual securities. The minimum average credit rating for bonds from non-eurozone countries. The fund is managed by the full portfolio is ‘AA‘. The duration of the portfolio can be Setanta Asset Management Limited (“Setanta“). between +/- two years of the index. Setanta‘s general philosophy in relation to fixed income is Returns are likely to be modest and can be negative. that performance in bond markets is primarily driven by the However, they are significantly less volatile than equity directional (duration) calls and yield curve positioning. The returns. fund takes relatively small currency or credit risk. Top 10 Holdings Fund Performance to 31/03/11 % Q1 2011 1 yr p.a 3 yr p.a 5 yr p.a 10 yr p.a Company Country % 5 Depfa ACS Bank Ireland 5.2 4 3 Buoni Poliennali Del Tes Italy 3.9 2 EBS Mortgage Finance Ireland 3.3 1 Irish Life & Permanent Ireland 3.2 0 -1 Buoni Poliennali Del Tes Italy 3.0 -2 Buoni Poliennali Del Tes Italy 2.9 -3 Buoni Poliennali Del Tes Italy 2.9 -4 -5 Landwirtsch. Rentenbank Germany 2.7 -6 Hellenic Republic I/L Greece 2.7 -7 Buoni Poliennali Del Tes Italy 2.5 Canada Life/ Setanta Pension Fixed Interest Category Average Bonds Source: Moneymate. Performance is net of management fees. Asset Distribution Country Weighting Yield Curve Positioning UK Finland SNAT Poland Duration Fund Benchmark 1.0% 1.0% 2.0% 2.0% (Yrs to Maturity) Covered Greece France Weighting Weighting 18% 6.0% 7.0% Portugal 0-5 27.1% 9.1% 3.0% Italy Supranational Netherlands 27.0% 2% 6.0% 5 - 10 50.6% 61.4% Belgium Govt. Agency 5.0% 10 - 15 21.8% 22.3% 14% 15 - 30 0.1% 7.2% Govt. Guarantee Govt. Ireland 4% 62% 17.0% Spain 100% 100% Austria 15.0% 3.0% Germany 4.0% Warning: Past performance is not a reliable guide to future performance. The value of your investment may go down as well as up. Important Information: This fact sheet does not form part of any contract. The information contained in this document is based on current legislation and is, therefore, subject to change. The contents are intended as a guideline only and should not be construed as an interpretation of the law. For full details of all our products, please refer to the specific product policy conditions. You should always seek advice of an appropriately qualified professional. Setanta Asset Management Limited is regulated by the Central Bank of Ireland. Canada Life Assurance (Ireland) Limited is regulated by the Central Bank of Ireland. 47
  • 50.
    Canada Life /Setanta Pension Cash Fund Quarter 1, 2011 Fund Description The Cash Fund seeks to provide modest returns in exchange individual securities of ‘A‘ and for the portfolio an average for relative capital security. The fund may invest in: rating of ‘AA‘. i) Euro denominated short-dated term deposits with banks The maximum average duration of the fund is 4.5 months, and/or eligible credit institutions on Canada Life‘s approved and the maximum duration of any one asset is one year. short-term borrowers list which have a minimum credit The fund has a diversified exposure, with no more than 30% rating of P-1 and which are authorised to carry on a banking credit exposure to any one entity. business in the State under Section 9 of the Central Bank Act, 1971 and/or The fund is actively managed and consideration is given to the underlying credit worthiness of the financial institution, (ii) Euro denominated bonds issued by governments or the return and the tenure of the deposit. corporates subject to a minimum average credit rating of Counterparty Exposure Fund Performance to 31/03/11 Issuer % of Fund Issuer % of Fund Q1 2011 1 yr p.a 3 yr p.a 5 yr p.a 10 yr p.a % Ulster Bank 19.4 Belgian Treasury Bill 3.3 3.0 National Irish Bank 18.4 German Treasury Bill 3.3 French Treasury Bill 9.8 Bank of Ireland (G) 2.3 2.5 BNP 8.2 Allied Irish Bank (G) 2.0 2.0 ACC Bank 6.8 EBS Building Society (G) 1.9 Dutch Treasury Bill 6.2 Irish Life & Permanent (G) 1.8 1.5 Italian Treasury Bill 5.2 SPGB 1.2 1.0 Dutch Commercial Paper 3.3 Cash 3.6 German Commercial Paper 3.3 0.5 Counterparty exposures (G) are covered by the Irish Government guarantee. Other counterparty/credit exposures are covered by either other European National 0.0 Government Guarantees or have individually strong credit ratings. Canada Life/Setanta Cash Fund Category Average Money Market Source: Moneymate. Performance is net of management fees. Warning: Past performance is not a reliable guide to future performance. The value of your investment may go down as well as up. Important Information: This fact sheet does not form part of any contract. The information contained in this document is based on current legislation and is, therefore, subject to change. The contents are intended as a guideline only and should not be construed as an interpretation of the law. For full details of all our products, please refer to the specific product policy conditions. You should always seek advice of an appropriately qualified professional. Setanta Asset Management Limited is regulated by the Central Bank of Ireland. Canada Life Assurance (Ireland) Limited is regulated by the Central Bank of Ireland. 48
  • 51.
    Canada Life /SEI Manager-of-Managers Fund Quarter 1, 2011 CL SEI Global Balanced Fund P Low Medium High Investment Objective and Strategy Fund Performance Q1 11 1 Yr 2 Yr p.a 3 Yr p.a 4 Yr p.a The SEI Global Balanced Fund aims to provide long term growth of capital with a moderate level of income by -1.2% 5.7% 20.9% 1.9% -2.5% investing in a range of SEI multi-manager equity and fixed income funds. The fund is a globally diversified fund with Top 10 Holdings % approximately 70% invested in top tier equity funds and the Apple Inc. 1.62 remaining 30% invested in top tier fixed income funds. JPMorgan Chase & Co. 1.12 Chevron Corp. 1.12 Asset Allocation Microsoft Corp. 1.04 Equities 70% Wells Fargo & Co. 1.00 US Large Cap 28.00 QUALCOMM Inc. 0.99 Global Developed Markets 14.00 AT&T Inc. 0.81 Europe Ex-UK 10.00 Pfizer Inc. 0.80 UK 6.00 ConocoPhillips 0.78 Japan 5.00 Exxon Mobil Corp. 0.77 Pacific Basin Ex-Japan 3.50 Total 10.04 Emerging Markets 3.50 Fixed Income Managers % AllianceBernstein 4.80 Fixed Income 30% First International Advisers 4.20 Global 15.00 UBS Global Asset Management 2.40 Global Opportunistic 15.00 Wellington Management Company 3.60 Total 100% DB Advisers 3.05 Jennison Associates 2.70 Schroders Investment Management 2.33 Wellington GRV 3.27 List of Managers % TCW Group 3.65 US Large Companies Equities 28.00 UK Equities 6.00 Aronson, Johnson, Ortiz 4.43 Invesco Quantitative Strategies 1.16 Brown Investment Advisory 2.86 Investec Asset Management 0.77 Delaware Investment Advisors 2.57 Jupiter Investment Managers 1.22 Legg Mason - Growth Equity 3.14 L.A. Capital Management 1.07 Legg Mason - Core Equity 2.57 Mirabaud Asset Management 1.16 LSV Asset Management 4.43 Standard Life Investments 0.61 Neuberger Berman 2.86 Japanese Equities 5.00 Quantitative Management Associates 2.86 Acadian Asset Management 1.12 WestEnd Advisors 2.28 Analytic Investors Inc 1.02 Global Developed Markets Equities 14.00 Capital International 1.28 Hexavest 3.46 JPMorgan Asset Management 1.58 Intech Investment Management 2.89 Pacific Basin Ex-Japan Equities 3.50 Janus Capital Group 2.60 Capital International 0.98 Tradewinds 1.73 Lloyd George Investment Management 1.40 Wellington Management Co. Int. Value 3.32 Maple-Brown Abbott Limited 1.12 Europe Ex-UK Equities 10.00 Emerging Markets Equities 3.50 Acadian Asset Management 3.67 Artisan Partners 0.71 Metropole Gestion 1.74 JO Hambro Capital Management 0.36 TT International 2.55 Lazard Asset Management 0.50 Wellington Management Company 2.04 Neuberger Berman 0.50 PanAgora Asset Management 0.71 The Boston Company Asset Management 0.71 49
  • 52.
    Canada Life /SEI Manager-of-Managers Fund Quarter 1, 2011 CL SEI Global Developed Markets Equity Fund P Low Medium High Investment Objective and Strategy Fund Performance The investment objective of the Global Developed Markets Q1 11 1 Yr 2 Yr p.a 3 Yr p.a 4 Yr p.a Equity Fund is to achieve capital appreciation by investing -2.4% 6.2% 25.1% -2.6% -9.0% primarily in equity securities of issuers located in developed countries. Following a manager-of-managers approach, the fund’s assets are diversified across specialist sub-advisers. Fund Benchmark MSCI World Index Top 10 Holdings % Country Allocation % Exxon Mobil Corp. 1.28 United States 47.2 Microsoft Corp. 1.11 Japan 11.1 Eli Lilly & Co. 0.93 United Kingdom 8.0 HSBC Holdings Plc 0.9 Canada 4.3 General Electric Co. 0.83 Germany 4.0 Pfizer Inc. 0.82 Switzerland 3.9 International Business Machines Corp. 0.81 France 3.9 Wells Fargo & Co. 0.79 Australia 1.8 Newmont Mining Corp. 0.74 Norway 1.6 JPMorgan Chase & Co. 0.73 Hong Kong 1.6 Total 8.94 Other 12.6 Underlying Managers Sector Weighting % Hexavest 24.7 Financials 17.1 Wellington Management Company International Value 23.7 Industrials 13.3 Intech Investment Management 20.6 Consumer Discretionary 12.1 Janus Capital Management 18.6 Energy 10.2 Tradewinds Global Investors 12.4 Information Technology 10.0 Fund Total 100.00 Health Care 10.0 Materials 9.8 Consumer Staples 7.8 Telecoms 5.9 Utilities 3.9 Market Capitalisation Breakdown (USD) Weight (%) Greater than 50 Billion 28.6 Between 20 and 50 Billion 25.7 Between 10 and 20 Billion 19.4 Between 1 and 10 Billion 24.6 Less than 1 Billion 1.7 50
  • 53.
    Canada Life /SEI Manager-of-Managers Fund Quarter 1, 2011 CL SEI European (Ex-UK) Equity Fund P Low Medium High Investment Objective and Strategy Fund Performance The fund aims to achieve long-term capital growth and Q1 11 1 Yr 2 Yr p.a 3 Yr p.a 4 Yr p.a income by investing in a broadly diversified portfolio of 1.7% 8.3% 28.9% -3.1% -5.6% European equity securities. Following a manager-of-managers approach, the fund’s assets are diversified across specialist sub-advisers. Fund Benchmark MSCI Europe EX-UK index Top 10 Holdings % Country Allocation % BNP Paribas S.A. 2.6 France 26.1 Total S.A. 2.4 Germany 21.6 Basf SE 1.8 Switzerland 12.2 Sanofi-Aventis S.A. 1.7 Sweden 8.6 Novartis AG 1.5 Italy 6.8 Daimler AG 1.4 Netherlands 4.9 Sap AG 1.3 Norway 3.4 Unicredit S.P .A. 1.3 Spain 3.3 Heineken N.V. 1.3 Denmark 2.8 Capgemini 1.2 Finland 2.5 Total 16.4 Other 7.8 Underlying Managers Sector Weighting % Acadian Asset Management 36.7 Industrials 21.7 TT International 25.5 Financials 15.7 Wellington Management Company 20.4 Consumer Discretionary 14.8 Metropole Gestion 17.4 Consumer Staples 10.9 Fund Total 100.00 Materials 10.5 Information Technology 7.9 Health Care 7.8 Energy 5.9 Telecomm Services 2.7 Utilities 2.2 Market Capitalisation Breakdown (USD) Weight (%) Greater than 50 Billion 22.7 Between 20 and 50 Billion 12.8 Between 10 and 20 Billion 15.0 Between 1 and 10 Billion 43.2 Less than 1 Billion 6.3 51
  • 54.
    Canada Life /SEI Manager-of-Managers Fund Quarter 1, 2011 CL SEI US Equity Fund P Low Medium High Investment Objective and Strategy Fund Performance The SEI US Large Companies Fund aims to provide long- Q1 11 1 Yr 2 Yr p.a 3 Yr p.a 4 Yr p.a term capital growth and income by investing primarily in a -0.1% 7.7% 23.8% 3.1% -3.7% broadly diversified portfolio of US equity securities of large companies. Following a manager-of-managers approach, the fund’s assets are diversified across specialist sub-advisers. Fund Benchmark Russell 1000 Index Top 10 Holdings % Sector Weighting % Apple Inc. 2.6 Information Technology 24.6 JPMorgan Chase & Co. 1.7 Financials 15.1 Chevron Corp. 1.7 Health Care 13.3 Qualcomm Inc. 1.7 Consumer Discretionary 12.0 Wells Fargo & Co. 1.5 Energy 10.8 Microsoft Corp. 1.5 Industrials 9.3 AT&T Inc. 1.3 Consumer Staples 6.4 Conocophillips 1.2 Materials 3.1 Pfizer Inc. 1.1 Telecomm Services 2.8 Procter & Gamble Co. 1.1 Utilities 2.5 Total 15.6 Underlying Managers Aronson & Johnson & Ortiz 15.8 LSV Asset Management 15.8 Legg Mason - Growth Equity 11.2 Brown Investment Advisory 10.2 Neuberger Berman 10.2 Quantitative Management Associates 10.2 Delaware Investments 9.2 Legg Mason - Value Equity 9.2 WestEnd Advisors 8.2 Fund Total 100.00 Market Capitalisation Breakdown (USD) Weight (%) Greater than 50 Billion 34.3 Between 20 and 50 Billion 26.1 Between 10 and 20 Billion 19.2 Between 1 and 10 Billion 20.2 Less than 1 Billion 0.3 52
  • 55.
    Canada Life /SEI Manager-of-Managers Fund Quarter 1, 2011 CL SEI UK Equity Fund P Low Medium High Investment Objective and Strategy Fund Performance The SEI UK Equity Fund aims to achieve long-term capital Q1 11 1 Yr 2 Yr p.a 3 Yr p.a 4 Yr p.a growth and income by investing primarily in a broadly -2.5% 6.9% 28.8% -1.7% -8.7% diversified portfolio of UK equity securities. Following a manager-of managers approach, the fund’s assets are diversified across specialist sub-advisers. Fund Benchmark FTSE All Share Index Top 10 Holdings % Sector Weighting % Vodafone Group Plc 4.0 Financials 19.3 Rio Tinto Plc 3.4 Industrials 15.4 BP Plc 3.1 Energy 14.0 BGGroup Plc 3.0 Materials 12.8 HSBC Holdings Plc 2.7 Consumer Discretionary 11.8 Glaxosmithkline Plc 2.6 Consumer Staples 9.2 Astrazeneca Plc 2.5 Health Care 6.2 Royal Dutch Shell Plc (Cl B) 2.4 Telecomm Services 5.4 BHP Billiton Plc 2.3 Information Technology 4.5 Barclays Plc 2.0 Utilities 1.5 Total 28.0 Underlying Managers Jupiter Asset Management 20.4 Invesco Asset Management 19.4 Mirabaud Investment Management 19.4 L.A Capital Management 17.9 Investec Asset Management 12.8 Standard Life Investments 10.2 Fund Total 100.00 Market Capitalisation Breakdown (USD) Weight (%) Greater than 50 Billion 35.4 Between 20 and 50 Billion 11.7 Between 10 and 20 Billion 8.7 Between 1 and 10 Billion 40.1 Less than 1 Billion 4.1 53
  • 56.
    Canada Life /SEI Manager-of-Managers Fund Quarter 1, 2011 CL SEI Pacific Basin (Ex-Japan) Equity Fund P Low Medium High Investment Objective and Strategy Fund Performance The SEI Pacific Basin (ex-Japan) Equity Fund aims to achieve Q1 11 1 Yr 2 Yr p.a 3 Yr p.a 4 Yr p.a long-term growth of capital and income by investing primarily in -4.5% 7.7% 35.6% 8.1% 2.7% a broadly diversified portfolio of Pacific Basin (ex-Japan) equity securities. Following a manager-of-managers approach, the fund’s assets are diversified across specialist sub-advisers. Fund Benchmark MSCI Pacific ex Japan Index Top 10 Holdings % Country Allocation % BHP Billiton Ltd. 7.6 Australia 56.3 Westpac Banking Corp. 4.4 Hong Kong 23.5 National Australia Bank Ltd. 4.3 Singapore 8.8 Australia & New Zealand Banking Group Ltd. 4.1 China 4.0 Rio Tinto Ltd. 3.5 United Kingdom 2.5 DBS Group Holdings Ltd. 3.2 Korea 2.2 Commonwealth Bank Of Australia 2.3 Taiwan 1.3 Wesfarmers Ltd. 1.9 Thailand 0.5 Oil Search Ltd. 1.8 Malaysia 0.3 Cheung Kong (Holdings) Ltd. 1.8 New Zealand 0.3 Total 34.7 Canada 0.3 Underlying Managers Sector Weighting % Lloyd George Investments Management 40.0 Financials 42.3 Maple-Brown Abbott 32.0 Materials 16.8 Capital International 28.0 Industrials 9.4 Fund Total 100.00 Consumer Discretionary 7.4 Consumer Staples 7.1 Energy 6.1 Information Technology 4.3 Telecomm Services 3.0 Health Care 2.5 Utilities 1.2 Market Capitalisation Breakdown (USD) Weight (%) Greater than 50 Billion 28.7 Between 20 and 50 Billion 15.7 Between 10 and 20 Billion 21.2 Between 1 and 10 Billion 33.0 Less than 1 Billion 1.5 54
  • 57.
    Canada Life /SEI Manager-of-Managers Fund Quarter 1, 2011 CL SEI Japan Equity Fund P Low Medium High Investment Objective and Strategy Fund Performance The investment objective of the SEI Japan Equity Fund is to Q1 11 1 Yr 2 Yr p.a 3 Yr p.a 4 Yr p.a achieve long-term growth of capital and income by investing -9.2% -1.2% 15.3% -2.5% -10.0% primarily in a broadly diversified portfolio of Japanese equity securities. Following a manager-of-managers approach, the fund’s assets are diversified across specialist sub-advisers. Fund Benchmark TOPIX Top 10 Holdings % Sector Weighting % Sumitomo Mitsui Financial Group Inc. 2.8 Industrials 23.0 Toyota Motor Corp. 2.4 Financials 18.9 Nippon Telegraph & Telephone Corp. 2.0 Consumer Discretionary 17.1 Astellas Pharma Inc. 1.9 Information Technology 15.7 Sumitomo Corp. 1.9 Materials 6.1 Mitsubishi UFJ Financial Group Inc. 1.9 Health Care 5.9 Nissan Motor Co. Ltd. 1.7 Consumer Staples 4.7 Mitsui & Co. Ltd. 1.5 Telecomm Services 4.1 Softbank Corp. 1.5 Energy 2.7 Marubeni Corp. 1.5 Utilities 1.9 Total 19.0 Underlying Managers JPMorgan Asset Management 31.6 Capital International 25.5 Acadian Asset Management 22.5 Analytic Investors 20.4 Fund Total 100.00 Market Capitalisation Breakdown (USD) Weight (%) Greater than 50 Billion 8.6 Between 20 and 50 Billion 17.8 Between 10 and 20 Billion 21.4 Between 1 and 10 Billion 44.6 Less than 1 Billion 7.6 55
  • 58.
    Canada Life /SEI Manager-of-Managers Fund Quarter 1, 2011 CL SEI Emerging Markets Equity Fund P Low Medium High Investment Objective and Strategy Fund Performance The SEI Emerging Markets Equity Fund aims to achieve Q1 11 1 Yr 2 Yr p.a 3 Yr p.a 4 Yr p.a capital appreciation by investing primarily in securities of -5.3% 9.2% 37.5% 5.3% 3.4% emerging market issuers. Following a manager-of-managers approach, the fund’s assets are diversified across specialist sub-advisers. Fund Benchmark MSCI Emerging Markets Index Top 10 Holdings % Country Allocation % Samsung Electronics Co. Ltd. 3.0 Brazil 16.2 Gazprom OaO ADS 1.3 China 15.8 MTN Group Ltd. 1.3 Korea 12.7 China Mobile Ltd. 1.1 Taiwan 10.4 Taiwan Semiconductor Manufacturing Co. Ltd. 1.0 Russia 8.0 Petrobras Petroleo Brasileiro (Ord) 1.0 India 7.1 HTC Corp. 0.9 South Africa 7.1 Lukoil Holdings ADS 0.8 Mexico 3.6 Hyundai Mobis Co. Ltd. 0.8 Indonesia 2.7 Standard Bank Group Ltd. 0.8 Turkey 2.4 Total 12.0 Other 14.0 Underlying Managers Sector Weighting % Artisan Partners 20.4 Financials 21.6 PanAgora Asset Management 20.4 Information Technology 14.5 The Boston Company Asset Management 20.4 Energy 14.0 Lazard Asset Management 14.3 Materials 13.5 Neuberger Berman 14.3 Consumer Discretionary 10.4 JO Hambro Capital Management 10.2 Industrials 8.6 Fund Total 100.00 Telecomm Services 7.3 Consumer Staples 5.4 Health Care 2.9 Utilities 1.9 Market Capitalisation Breakdown (USD) Weight (%) Greater than 50 Billion 11.2 Between 20 and 50 Billion 11.7 Between 10 and 20 Billion 8.3 Between 1 and 10 Billion 58.6 Less than 1 Billion 10.2 56
  • 59.
    Canada Life /SEI Manager-of-Managers Fund Quarter 1, 2011 CL SEI Global Fixed Income Fund P Low Medium High Investment Objective and Strategy Fund Performance The SEI Global Fixed Income Fund aims to generate current Q1 11 1 Yr 2 Yr p.a 3 Yr p.a 4 Yr p.a income and exhibit principal volatility similar to that of the -0.8% 1.4% 6.1% 1.1% 0.6% global developed fixed income market as a whole. Following a manager-of-managers approach, the fund’s assets are diversified across specialist sub-advisers Fund Benchmark Lehman Global Aggregate Index Top 10 Holdings % Country Allocation % BUNDESREPUB DEUT 3.50% 1/4/16 2.2 Euro 27.9 JAPAN-86 0.6% 09/20/14 /JPY/ 2.0 Japan 23.4 JAPAN-113 2.1% 09/20/29 /JPY/ 1.6 USA 20.9 JAPAN-112 2.1% 06/20/29 /JPY/ 1.5 Other 15.1 US TREAS NTS 3.5% 05/15/20 1.5 UK 8.7 JAPAN-79 0.7% 12/20/13 /JPY/ 1.3 Canada 4.1 EUROPEAN IN 3.875%10/15/16/EUR 1.3 JAPAN-304 1.3% 09/20/19 /JPY/ 1.2 BONOS Y O 5.5% 04/30/21 /EUR/ 1.2 JAPAN GOV 2.5% 12/21/20/JPY/ 1.1 Total 14.8 Underlying Managers Quality Allocation % AllianceBernstein 32.00 Treasury 82.8 First International Advisors 28.00 Agency 8.2 Wellington Management Company 24.00 Credit 6.5 UBS Global Asset Management 16.00 Collateralized 1.2 Fund Total 100.00 Cash 1.3 Quality Exposure % Aaa and Treasury 53.4 Aa 32.9 A 5.9 Baa 4.4 Ba and Below 3.3 57
  • 60.
    Canada Life /SEI Manager-of-Managers Fund Quarter 1, 2011 CL SEI Global Opportunistic Fixed Income Fund P Low Medium High Investment Objective and Strategy Fund Performance The SEI Global Opportunistic Fixed Income Fund aims to Q1 11 1 Yr 2 Yr p.a 3 Yr p.a 4 Yr p.a generate current income consistent with the preservation of -0.1% 3.2% 9.6% 3.1% 2.7% capital by investing primarily in global fixed income markets. Following a manager-of-managers approach, the fund’s assets are diversified across specialist sub-advisers. Fund Benchmark Lehman Global Aggregate Hedged Index Top 10 Holdings % Country Allocation % FGLMC PA90761 4.50% 01/01/40 2.3 USA 59.3 FREDDIE MAC GOLD POOL 1.1 Euro 26.4 CANADA GOVT 3.75% 6/1/19 /CAD/ 1.1 UK 6.9 US TREAS NTS 2.5% 03/31/15 0.9 Canada 2.9 BUNDESREP 2.5% 01/04/21 /EUR/ 0.8 Other 2.4 FEDERAL NATL MTG ASSN FR 2.625%112014 0.7 Japan 2.1 FNMA PMA0023 5.00% 04/01/29 0.7 GENERAL ELEC C 5.625% 05/01/18 0.7 FGLMC PG12491 5.00% 01/01/22 0.7 FNMA PAD0470 5.00% 02/01/49 0.6 Total 9.5 Underlying Managers Market Value Weighting % TCW Investment Management Company 24.3 Treasury 12.5 Wellington Management Company 21.8 Agency 16.0 DB Advisors 20.3 Credit 35.3 Jennison Associates 18.0 Collateralized 37.7 Schroders Investment Management 15.6 Cash -1.4 Fund Total 100.00 Quality Exposure % Aaa and Treasury 54.1 A 17.1 Baa 14.3 Aa 12.0 Ba and Below 2.5 58
  • 61.
    Canada Life /Morgan Stanley Pension European Property Fund Quarter 1, 2011 Fund Description The Canada Life/Morgan Stanley European Property Fund provides a highly efficient and cost-effective way of gaining allows investors to access the potential returns available such exposure. As an asset class, real estate can provide from the European commercial property market in one important advantages to investors: historically low volatility diversified fund. The fund invests in a professionally managed relative to equities, attractive returns and a low correlation to portfolio of European property companies and is managed by other asset classes. a team of property experts at Morgan Stanley with over 40 years of collective experience of real estate markets. Real estate securities are indirect investments in property whose long-term returns depend on the underlying real estate market. Broad geographic and sector diversification would be prohibitively expensive for a direct real estate investor. However, an indirect real estate portfolio structure Top 10 Holdings Fund Performance to 31/03/11 Company % Q1 2011 4.4% Unibail-Rodamco SE 10.22 1 Year 11.7% Land Securities PLC 5.31 2 Year p.a 42.6% Klepierre 5.27 3 Year p.a -7.5% PSP Swiss Property AG 4.54 Source: Moneymate. Performance is net of management fees. Icade 4.54 Hammerson PLC 4.46 British Land Co. Ltd 4.07 Gecina 3.60 Beni Stabili SPA 3.04 Corio NV 3.01 Total 48.06 Equity Geographic Distribution Finland Switzerland 1.85% 6.37% Sweden 4.67% UK Italy 3.04% 37.90% Belgium 1.35% France 30.42% Netherlands Austria 7.06% 2.38% Cash & equivalents Germany 1.94% 3.02% Warning: Past performance is not a reliable guide to future performance. The value of your investment may go down as well as up. The Canada Life/Morgan Stanley European Property Fund was launched on 30/7/07. Important Information: This fact sheet does not form part of any contract. The information contained in this document is based on current legislation and is, therefore, subject to change. The contents are intended as a guideline only and should not be construed as an interpretation of the law. For full details of all our products, please refer to the specific product policy conditions. You should always seek advice of an appropriately qualified professional. Canada Life Assurance (Ireland) Limited is regulated by the Central Bank of Ireland. 59
  • 62.
    Canada Life /BlackRock Pension Managed Fund Quarter 1, 2011 Fund Description The Canada Life/Blackrock Pensions Managed Fund invests The Global Allocation Fund seeks to maximise total return. in both bonds and equities worldwide. The fund follows an The fund invests globally in equity, debt, and short-term asset allocation policy, which seeks to maximise returns securities of both corporate and governmental issuers, with while managing the risk in euro terms. The Canada Life/ no prescribed limits. The fund generally will seek to invest Blackrock Pensions Managed Fund invests 100% in the in securities that are, in the opinion of the investment Blackrock Global Allocation Fund, which is run by Blackrock advisor, undervalued. The fund may also invest in the equity Investment Managers. Blackrock Investment Managers securities of small and emerging growth companies. The is one of the world’s largest investment management fund may also invest a portion of its debt portfolio in high- organisations. yield fixed income transferable securities. Currency exposure is flexibly managed. Top 10 Holdings Fund Performance to 31/03/11 % Q1 2011 1 yr p.a 3 yr p.a 5 yr p.a Company % 12 SPDR Gold Trust 1.4 10 Exxon Mobil 1.3 8 Apple 1.0 6 Microsoft 0.8 4 Petrobras 0.8 2 Chevron Corp 0.7 0 General Electric 0.7 -2 International Business Machines Corp. 0.7 -4 AT&T 0.6 -6 Bristol-Myers Squibb 0.6 Total 8.6 Canada Life/BlackRock Pension Managed Fund Average Managed Fund (Mercer Survey) Asset Distribution Regional Distribution Equity Sectoral Distribution Asia/Pacific Consumer (ex Japan) Equity Asia/Pacifc Other Discretionary 2.7% (ex Japan) Bonds 2.4% Cash 2.1% Consumer 5.9% Energy 7.3% Europe Bonds Staples 4.8% Japan Bonds 16.5% 0.3% 6.0% Fixed Income Japan Equity 25.9% 6.2% Industrials North America 8.6% Emerging Market Equity Bonds Financials 38.8% 6.8% 13.9% Cash Healthcare 7.3% 9.9% Equity Europe Equity Materials 66.8% 8.5% Utilities / Telecoms 13.1% 11.0% Emerging Market Equity North America Bonds Information 10.7% 11.8% Technology 12.7% Warning: Past performance is not a reliable guide to future performance. The value of your investment may go down as well as up. Important Information: This fact sheet does not form part of any contract. The information contained in this document is based on current legislation and is, therefore, subject to change. The contents are intended as a guideline only and should not be construed as an interpretation of the law. For full details of all our products, please refer to the specific product policy conditions. You should always seek advice of an appropriately qualified professional. BlackRock Investment Managers (UK) Limited is authorised and regulated by the Central Bank of Ireland. Canada Life Assurance (Ireland) Limited is regulated by the Central Bank of Ireland. 60
  • 63.
    Canada Life /Merrion Managed Fund Quarter 1, 2011 Fund Description The Canada Life/Merrion Managed Fund is managed by Merrion Investment Managers. The fund is designed to provide balanced long term growth by actively managing the distribution of the portfolio between cash, bonds, equities and property according to economic conditions. The fund maintains an average market weight in property through its exposure to Canada Life’s Property Fund while the remainder of the fund is invested in Merrion Investment Managers’ Managed Fund thus providing broad diversification in quality equities, bonds, property and cash. Top 10 Holdings Fund Performance to 31/03/11 Q1 2011 1 yr p.a 3 yr p.a Canada Life/Merrion Managed Fund % % 6 iShares MSCI World 3.0 5 iShares MSCI Emerging Markets 1.7 4 Financial Select Sector SPDR 1.3 3 Siemens 1.2 2 Microsoft 1.1 1 CRH 1.1 0 iShares MSCI Pacific ex Japan 1.1 -1 iShares MSCI Japan 1.0 -2 ChevronTexaco 1.0 -3 iShares MSCI Asia ex Japan 1.0 Canada Life/Merrion Managed Fund Average Managed Fund (Mercer Survey) The Canada Life/Merrion Managed Fund was launched on 1/10/07. Source: Merrion & Mercer Pooled Fund Survey. Performance is net of management fees. Asset Distribution Equity Geographic Distribution Equity Sectoral Distribution Property Ireland Utilities Consumer 5.0% Pacific Basin Telecoms 1.8% Discretionary Cash 7.5% 9.7% 3.5% 8.3% 11.6% UK Information Consumer 12.4% Technology Japan Staples 11.4% 5.7% 8.0% Fixed Interest 11.1% Energy 13.7% Industrials 26.9% Equities 72.3% US Europe 34.7% 27.7% Financials Healthcare 20.5% 8.2% Warning: Past performance is not a reliable guide to future performance. The value of your investment may go down as well as up. Important Information: This fact sheet does not form part of any contract. The information contained in this document is based on current legislation and is, therefore, subject to change. The contents are intended as a guideline only and should not be construed as an interpretation of the law. For full details of all our products, please refer to the specific product policy conditions. You should always seek advice of an appropriately qualified professional. Merrion Capital Investment Managers Limited (trading as Merrion Investment Managers) is regulated by the Central Bank of Ireland. Canada Life Assurance (Ireland) Limited is regulated by the Central Bank of Ireland. 61
  • 64.
    March 2011 FundPerformance as of 31/03/11 Life Investment Funds (Gross Tax Basis) Name 1 Month 3 Month YTD 1 Year 3 yr p.a. 5 yr p.a. 7 yr p.a. 10 yr p.a. Canada Life/Setanta Life UWP Fund 0.00% 0.00% 0.00% 0.00% 0.18% 0.50% 0.65% 1.74% Canada Life/SEI US Equity Fund -2.87% -0.24% -0.24% 7.22% 2.70% -- -- -- Canada Life/SEI UK Equity Fund -5.19% -2.60% -2.60% 6.43% -2.02% -- -- -- Canada Life/SEI Pacific Basin Equity Fund -1.41% -4.66% -4.66% 7.12% 7.62% -- -- -- Canada Life/SEI Japan Equity Fund -11.02% -9.22% -9.22% -1.72% -2.89% -- -- -- Canada Life/SEI Global Opportunistic Fixed Income Fund -0.18% -0.18% -0.18% 2.68% 2.65% -- -- -- Canada Life/SEI Global Fixed Income Fund -0.19% -0.96% -0.96% 0.88% 0.62% -- -- -- Canada Life/SEI Global Equity Fund -3.78% -2.41% -2.41% 5.68% -3.01% -- -- -- Canada Life/SEI Global Balanced Fund -2.16% -1.09% -1.09% 6.06% 2.16% -1.26% -- -- Canada Life/SEI European Equity Fund -1.21% 1.61% 1.61% 7.75% -3.55% -- -- -- Canada Life/SEI Emerging Markets Equity Fund 2.22% -5.52% -5.52% 8.71% 4.86% -- -- -- Canada Life Quadrivium Fund -0.60% 1.34% 1.34% 8.34% -3.09% -- -- -- Canada Life/Morgan Stanley European Property Fund -0.16% 4.36% 4.36% 11.67% -7.50% -- -- -- Canada Life/Merrion Managed Fund -2.64% -2.74% -2.74% 1.32% -1.23% -- -- -- Canada Life/Setanta Equity Dividend Distributing Fund -0.62% 3.07% 3.07% 6.16% -2.79% -5.10% 0.27% -- Canada Life/Setanta Equity Dividend Non Distributing Fund -0.67% 3.06% 3.06% 10.79% 2.28% -0.46% 4.93% -- Canada Life/Setanta Balanced Dividend Non Distributing Fund -0.62% 1.64% 1.64% 6.61% 3.76% 1.36% 4.61% -- Canada Life/Setanta Balanced Dividend Distributing Fund -0.60% 1.57% 1.57% 2.19% -1.01% -3.07% 0.16% -- Canada Life/Setanta Strategic Growth Fund -1.96% 0.00% 0.00% 2.46% 0.46% -1.67% 2.74% 0.57% Canada Life Property Fund 0.09% -1.60% -1.60% -4.81% -19.30% -11.42% -4.53% -1.09% Canada Life/Setanta Irish Equity Fund -4.15% -3.21% -3.21% 4.53% -8.07% -8.10% 0.54% 1.07% Canada Life/Setanta Global Opportunity Fund -2.68% -0.32% -0.32% 4.66% 2.40% -0.99% 4.26% 0.58% Canada Life/Setanta Focus 15 Fund -3.49% -1.13% -1.13% 10.88% 11.18% 3.43% 6.52% -0.15% Canada Life/Setanta Fixed Interest Fund -0.59% -0.93% -0.93% -7.26% 1.25% 0.97% 1.58% 2.69% Canada Life/Setanta European Equity Fund -4.20% -0.80% -0.80% 2.19% -0.36% -2.45% 4.18% -0.10% Canada Life/Setanta Cash Fund -0.07% -0.14% -0.14% -0.61% 0.69% 1.32% 1.13% 1.32% Canada Life/Setanta Balanced Fund -1.54% -0.67% -0.67% -1.18% -0.78% -2.06% 1.60% 0.85% These funds relate only to unit linked investment policies that commenced after 01/01/2001. Life Investment Funds (Net Tax Basis) Name 1 Month 3 Month YTD 1 Year 3 yr p.a. 5 yr p.a. 7 yr p.a. 10 yr p.a. 15 yr p.a. Canada Life With Profit Fund 0.00% 0.00% 0.00% 0.00% 0.00% 0.00% 0.00% 0.79% -- Canada Life SSGA Master Client -2.50% -1.25% -1.25% 1.28% -1.15% -3.48% 0.84% 0.81% 4.57% Canada Life SSGA Managed -2.51% -1.25% -1.25% 1.28% -1.15% -3.48% 0.84% 0.81% 4.58% Canada Life Property Fund 0.06% -1.30% -1.30% -4.42% -15.94% -9.35% -3.25% -0.33% 4.95% Canada Life Pacific Equity Fund -0.91% -2.89% -2.89% 10.89% 6.25% 4.59% 6.65% 5.08% 3.26% Canada Life Money Fund -0.05% -0.07% -0.07% -0.25% 0.79% 1.32% 1.16% 1.28% 1.72% Canada Life Managed Fund -1.76% -0.29% -0.29% 1.97% 0.76% -0.85% 2.76% 1.20% 4.80% Canada Life Leading Companies Fund -2.20% -0.14% -0.14% 4.59% 1.96% -0.71% 3.53% 0.75% 4.64% Canada Life Irish Equity Fund -3.41% -3.12% -3.12% 4.24% -6.82% -6.74% 0.99% 1.56% 5.62% Canada Life International Equity Fund -2.20% -0.27% -0.27% 5.23% 2.47% -0.22% 3.75% 0.54% 4.52% Canada Life High Growth Managed Fund -2.22% -0.12% -0.12% 4.58% 1.96% -0.72% 3.53% 0.75% 4.58% Canada Life Growth Managed Fund -1.75% -0.29% -0.29% 1.98% 0.76% -0.85% 2.77% 1.20% 4.80% Canada Life Gilt Fund -0.51% -0.76% -0.76% -5.63% 1.38% 1.14% 1.65% 2.57% 4.01% Canada Life Gilt & Bond Fund -0.51% -0.78% -0.78% -5.64% 1.39% 1.14% 1.65% 2.68% 4.07% Canada Life Focus 15 Fund -2.83% -0.89% -0.89% 9.22% 8.79% 2.63% 5.01% -0.09% -- Canada Life European Equity Fund -3.41% -0.77% -0.77% 2.17% -0.41% -1.93% 3.24% 0.04% 4.62% Canada Life Cash Fund -0.07% -0.11% -0.11% -0.27% 0.79% 1.32% 1.16% 1.31% 1.76% Canada Life Balanced Equity Fund -2.20% -0.13% -0.13% 4.59% 1.97% -0.71% 3.53% 0.75% 4.65% 62
  • 65.
    March 2011 FundPerformance as of 31/03/11 Pension Funds Name 1 Month 3 Month YTD 1 Year 3 yr p.a. 5 yr p.a. 7 yr p.a. 10 yr p.a. 15 yr p.a. Canada Life/Setanta MM Pension Overseas Fund -2.63% -0.28% -0.28% 5.89% 4.23% 0.31% 4.96% 0.04% 5.31% Canada Life/SEI US Equity Fund -2.92% -0.12% -0.12% 7.71% 3.15% -- -- -- -- Canada Life/SEI UK Equity Fund -5.11% -2.56% -2.56% 6.94% -1.69% -- -- -- -- Canada Life/SEI Pacific Basin Equity Fund -1.30% -4.49% -4.49% 7.73% 8.11% -- -- -- -- Canada Life/SEI Japanese Equity Fund -11.08% -9.19% -9.19% -1.23% -2.52% -- -- -- -- Canada Life/SEI Global Fixed Income Fund -0.10% -0.86% -0.86% 1.37% 1.08% -- -- -- -- Canada Life/SEI Global Equity Fund -3.84% -2.37% -2.37% 6.21% -2.62% -- -- -- -- Canada Life/SEI Global Balanced Fund -2.29% -1.21% -1.21% 5.71% 1.90% -- -- -- -- Canada Life/SEI European Equity Fund -1.18% 1.70% 1.70% 8.29% -3.14% -- -- -- -- Canada Life/SEI Emerging Markets Fund 2.26% -5.35% -5.35% 9.21% 5.29% -- -- -- -- Canada Life Quadrivium Fund -0.55% 1.47% 1.47% 9.11% -2.37% -- -- -- -- Canada Life/Morgan Stanley European Property Fund -0.16% 4.44% 4.44% 12.19% -6.98% -- -- -- -- Canada Life/Merrion Managed Fund -2.60% -2.60% -2.60% 1.85% -0.18% -- -- -- -- Canada Life/SEI Global Opportunistic Fixed Income -0.09% -0.09% -0.09% 3.19% 3.09% -- -- -- -- Canada Life/SSGA Pension Managed -3.27% -1.55% -1.55% 2.03% -1.54% -3.66% 1.23% 0.99% 5.22% Canada Life/Setanta With Profit Fund 0.00% 0.00% 0.00% 0.00% 1.26% 1.94% 2.24% 3.08% 4.83% Canada Life/Setanta Pension Money Fund 0.02% 0.07% 0.07% 0.21% 1.44% 2.08% 1.89% 2.07% 2.73% Canada Life/Setanta Pension Managed Fund -1.82% 0.23% 0.23% 3.16% 1.62% -0.38% 4.04% 2.07% 5.93% Canada Life/Setanta Pension Equity Fund -2.62% -0.11% -0.11% 5.47% 3.13% -0.26% 5.02% 1.37% 5.63% Canada Life/Setanta Pension Fixed Interest Fund -0.54% -0.76% -0.76% -6.55% 2.06% 1.77% 2.38% 3.48% 5.33% Canada Life/Setanta Consensus Fund -2.31% -0.76% -0.76% 4.38% -0.91% -2.66% 2.21% 0.59% -- Canada Life/Setanta Pension Property Fund 0.12% -1.47% -1.47% -4.16% -18.55% -10.65% -3.73% -0.29% 6.07% Canada Life/Setanta Passive Equity Fund -3.91% -1.30% -1.30% 6.43% 2.10% -2.35% 2.08% -- -- Canada Life/KBI Pension Managed Fund -1.84% -0.64% -0.64% 4.00% -2.44% -3.52% 1.91% -0.06% -- Canada Life/Setanta Pension Focus 15 Fund -3.32% -0.89% -0.89% 11.96% 12.20% 4.41% 7.54% 0.85% -- Canada Life/Setanta Equity Dividend Fund -0.55% 3.29% 3.29% 11.64% 3.03% 0.29% 5.71% -- -- Canada Life/Setanta Balanced Dividend Fund -0.54% 1.84% 1.84% 7.37% 4.52% 2.09% 5.34% -- -- Canada Life/Blackrock Pension Managed Fund 0.41% 3.47% 3.47% 9.94% 1.70% 4.49% 6.24% -- -- Indices and Measures Name 1 Month 3 Month YTD 1 year 3 yr p.a. 5 yr p.a. 7 yr p.a. 10 yr p.a. 15 yr p.a. ISEQ Overall Return 0.30% 2.95% 2.95% -6.50% -20.62% -16.00% -5.41% -3.69% 3.78% Irish Inflation 0.00% 0.00% 0.00% 0.00% -1.93% 0.80% 1.37% 2.05% 2.37% FTSE 100 Share Index (TR) 1.74% 2.84% 2.84% 8.04% 4.78% 3.88% 8.32% 4.18% 6.65% DJ EURO STOXX(50) TR -0.63% 6.37% 6.37% 2.71% -4.34% -2.15% 3.65% -0.87% 6.60% S&P 500 TR 2.15% 6.45% 6.45% 15.36% 1.33% 2.73% 4.45% 3.46% -- MSCI The World Index (Gross TR) 0.29% 4.43% 4.43% 9.21% -0.23% 0.73% 4.87% 2.74% 5.58% Japan NIKKEI 225 -9.72% -5.09% -5.09% -13.66% -8.46% -10.66% -2.61% -2.88% -5.18% Hong K. Hang Seng Bank 1.73% 3.33% 3.33% 10.52% 0.95% 8.53% 9.42% 6.43% 5.33% All prices and performances are illustrated as at effective date 31st March 2011. Performance is illustrated on an offer-to-offer basis. Warning: Past performance is not a reliable guide to future performance. The value of your investment may go down as well as up This document does not form part of any contract. E&OE. Canada Life Assurance (Ireland) Limited is regulated by the Central Bank of Ireland. 63
  • 66.
    Our Investment Partners Wepartner with only the best investment fund managers to provide a full range of investment options for our clients. Setanta Asset Management Morgan Stanley Setanta Asset Management Limited (“Setanta”) is the primary Morgan Stanley Investment Management (MSIM) is a client-centric asset manager for Canada Life in Ireland and other European organisation dedicated to providing investment and risk-management countries. Setanta was established in Dublin in 1998 and has solutions to investors worldwide. With over three decades of asset grown steadily since then, now managing €5.1bn (December management experience, Morgan Stanley’s investment strategies span 2010) in assets for the Great-West Lifeco Inc group of the risk/return spectrum across geographies, investment styles and asset companies with clients in Ireland, Germany and Canada as classes, including equity, fixed income, alternatives and private markets. well other third-party institutions. MSIM comprises a community of specialised investment boutiques, each with a unique talent pool of experienced investment professionals backed by Setanta specialises in active global equity management, the broad reach, access and resources of Morgan Stanley. investing in stocks on a fundamental basis, with a focus on value and quality. Setanta has an experienced investment As of 30th September, 2010, MSIM had more than 740 investment team, who choose stocks within a global sector framework. professionals worldwide who managed and supervised US$265 billion in The team has a strong track record in its core global equity assets for institutional and intermediary investors around the globe. With style, and in other regional, country and specialist styles. 53 offices in 23 countries, Morgan Stanley is able to provide in-depth local knowledge and expertise while channelling the strengths of its global Setanta offers investment on a segregated and on a pooled presence and resources to deliver targeted investment solutions. basis. It is the investment manager for a range of unit-linked funds, which Canada Life policyholders in Ireland and Europe may invest in. In addition Setanta has a number of specialist www.morganstanley.com mutual funds available for professional investors, offering a global equity, high-yield, covered call strategy, and a similar Merrion Investment Managers strategy which invests in companies which meet certain In 2007, Canada Life announced the launch of the Canada Life/Merrion ethical restrictions. Managed fund and is delighted to welcome Merrion Investment Managers as a partner. Merrion Investment Managers, formerly Oppenheim Investment www.setanta-asset.com Managers, have built a reputation upon a proven approach to investment management that has delivered consistently strong performance - not only in years when markets have risen but also during periods when markets SEI Investments (SEI) have fallen. Merrion Investment Managers’ focus is on controlling risk, while In 2005, SEI partnered with Canada Life and together obtaining the maximum return available within the market. introduced the Manager-of-Managers concept in Ireland launching the SEI Manager-of-Manager Global Balanced Fund. Merrion Investment Managers’ only business is asset management meaning that they are totally focused on delivering exceptional investment returns to In 2006, Canada Life added another nine SEI Manager-of- their clients. Managers funds to our investment platform. SEI Investments is a global leader in Manager-of-Managers www.merrion-investments.ie with €129 billion (December 2010) under management worldwide. It is one of the world’s leading providers of multi BlackRock manager investment products through their Manager-of- BlackRock is one of the world’s preeminent asset management firms and Managers offering, and has a strong track record of growth a premier provider of global investment management, risk management in Europe with a presence in the UK, Italy, Germany, The and advisory services to institutional, intermediary and individual investors Netherlands and France. around the world. BlackRock offers a range of solutions - from rigorous fundamental and quantitative active management approaches aimed at The Manager-of-Managers concept is a sophisticated maximizing outperformance to highly efficient indexing strategies designed to investment approach, which builds up a portfolio of the best gain broad exposure to the world’s capital markets. specialist investment managers around the world, rather than a portfolio of individual stocks and bonds. The Manager- BlackRock is a truly global enterprise that combines the benefits of world- of-Managers, SEI, is responsible for the selection and wide reach with localised service. Blackrock manages assets for clients performance of the investment managers. in North and South America, Europe, Asia, Australia and the Middle East and Africa. Headquartered in New York, the firm employs more than 8,500 Through this partnership, Canada Life can offer clients a talented professionals and maintains offices in 24 countries around the greater chance of achieving more consistent long-term returns world. Blackrock’s client base includes corporate, public, union and industry with controlled risk. pension plans; insurance companies; third-party mutual funds; endowments; foundations; charities; corporations; official institutions; banks; and www.seic.com individuals worldwide. As of 30th September, 2010, BlackRock’s assets under management total US$3.45 trillion across equity, fixed income, cash management, alternative investment, real estate and advisory strategies. www.blackrock.co.uk 64
  • 67.
    For further informationon Canada Life investment products please contact: Michael Hayes Investment Development Manager, Canada Life Tel: 01 210 2757 Email: michael.hayes@canadalife.ie
  • 68.
    Canada Life House,Temple Road, Blackrock, Co. Dublin. Tel: 01 210 2000 Fax: 01 210 2020 Web: www.canadalife.ie Email: customerservices@canadalife.ie This information is correct at the time of going to print. Canada Life Assurance (Ireland) Limited and The Canada Life Assurance Company are regulated by the Central Bank of Ireland.