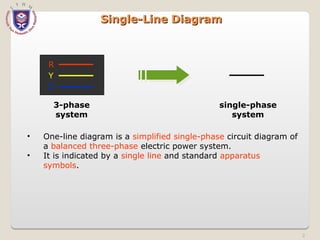
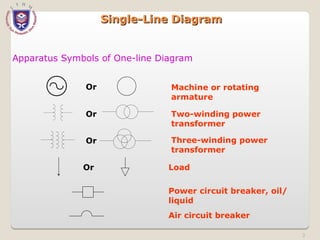
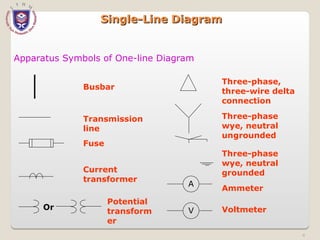
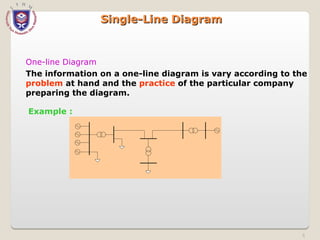
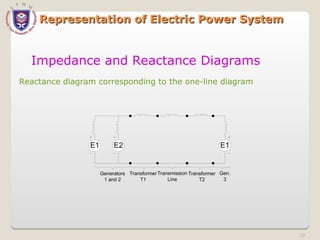
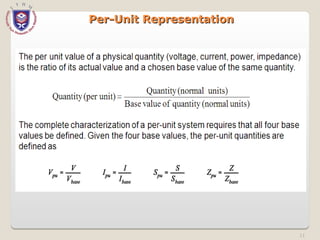
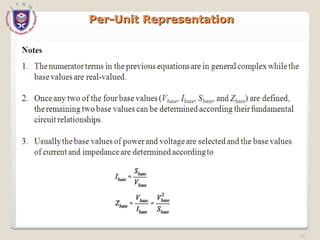
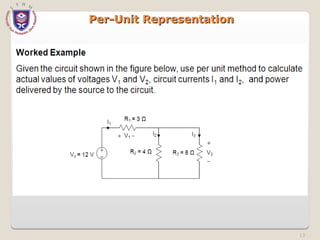
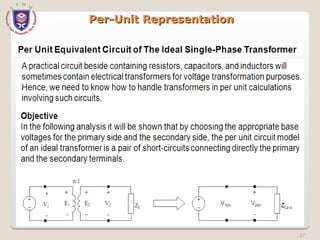
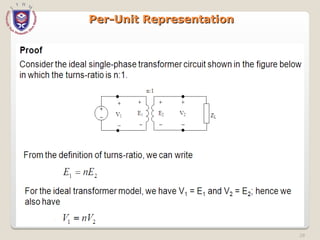
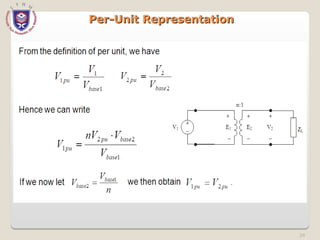
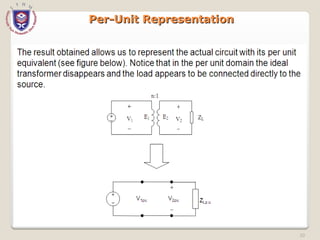
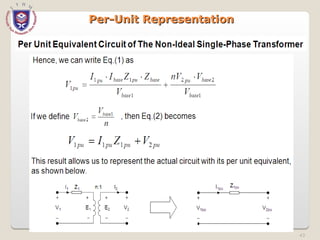
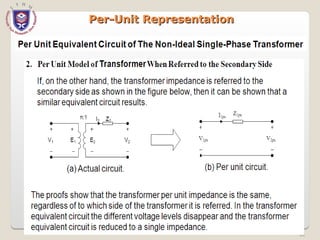
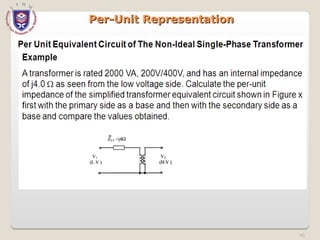
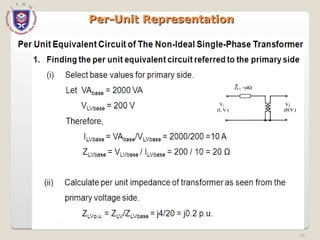
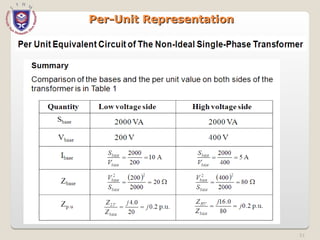
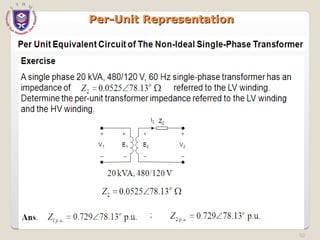
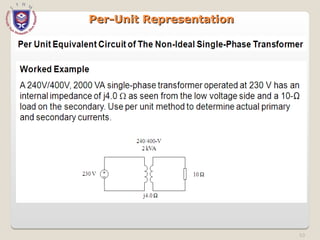
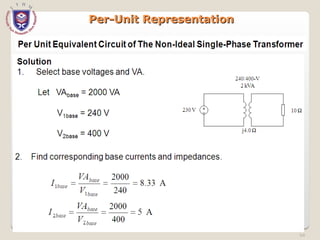
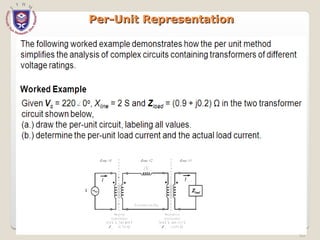
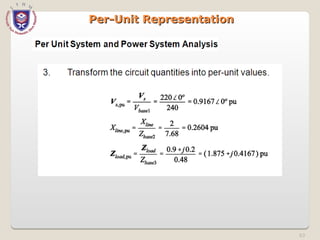
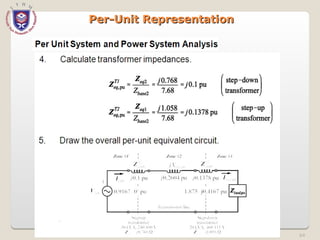
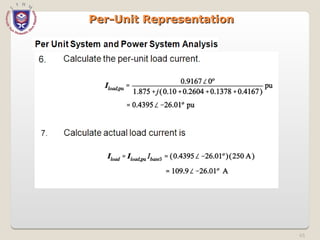
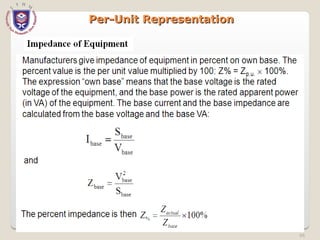
CHAPTER 3
CHAPTER 3
THREE-PHASE NETWORK
Single-Line Diagram
Single-Line Diagram
B
Y
R
3-phase
system
single-phase
system
• One-line diagram is a simplified single-phase circuit diagram of
a balanced three-phase electric power system.
• It is indicated by a single line and standard apparatus
symbols.
2
Single-Line Diagram
Single-Line Diagram
Apparatus Symbols of One-line Diagram
Machine or rotating
armature
Two-winding power
transformer
Three-winding power
transformer
Power circuit breaker, oil/
liquid
Air circuit breaker
Load
Or
Or
Or
Or
3
Apparatus Symbols of One-line Diagram
A
V
Or
Current
transformer
Busbar
Transmission
line
Fuse
Potential
transform
er
Three-phase,
three-wire delta
connection
Three-phase
wye, neutral
ungrounded
Three-phase
wye, neutral
grounded
Ammeter
Voltmeter
Single-Line Diagram
Single-Line Diagram
4
Single-Line Diagram
Single-Line Diagram
One-line Diagram
The information on a one-line diagram is vary according to the
problem at hand and the practice of the particular company
preparing the diagram.
Example :
5
Single-Line Diagram
Single-Line Diagram
Advantages of One-line Diagram
 Simplicity.
 One phase represents all three phases of the
balanced system.
 The equivalent circuits of the components are
replaced by their standard symbols.
 The completion of the circuit through the neutral
is omitted.
6
Representation of Electric Power System
Impedance and Reactance Diagrams
 Impedance (Z = R + jX) diagram is converted from one-line
diagram showing the equivalent circuit of each component of
the system. It is needed in order to calculate the
performance of a system under load conditions (Load flow
studies) or upon the occurrence of a short circuit (fault
analysis studies).
 Reactance (jX) diagram is further simplified from impedance
diagram by omitting all static loads, all resistances, the
magnetizing current of each transformer, and the
capacitance of the transmission line. It is apply to fault
calculations only, and not to load flow studies.
 Impedance and reactance diagrams sometimes called the
Positive-sequence diagram.
7
Representation of Electric Power System
1
2
3
Load B
T2
T1
Load A
Impedance and Reactance Diagrams
Example : One-line diagram of an electric power
system
8
Representation of Electric Power System
E1 E2 E3
Gen.
3
Load
B
Transformer
T2
Transmission
Line
Transformer
T1
Load
A
Generators
1 and 2
Impedance diagram corresponding to the previous one-line diagram
Impedance and Reactance Diagrams
9
Representation of Electric Power System
Reactance diagram corresponding to the one-line diagram
E1 E2 E1
Generators
1 and 2
Transmission
Line
Transformer
T2
Gen.
3
Transformer
T1
Impedance and Reactance Diagrams
10
Per-Unit Representation
11
Per-Unit Representation
12
Per-Unit Representation
13
Per-Unit Representation
14
Per-Unit Representation
15
Per-Unit Representation
16
Per-Unit Representation
17
Per-Unit Representation
18
Per-Unit Representation
19
Per-Unit Representation
20
Per-Unit Representation
21
Per-Unit Representation
22
23
Per-Unit Representation
24
Per-Unit Representation
25
Per-Unit Representation
26
Per-Unit Representation
27
Per-Unit Representation
28
Per-Unit Representation
29
Per-Unit Representation
30
Per-Unit Representation
31
Per-Unit Representation
32
Per-Unit Representation
33
Per-Unit Representation
34
Per-Unit Representation
35
Per-Unit Representation
36
Per-Unit Representation
37
Per-Unit Representation
38
Per-Unit Representation
39
Per-Unit Representation
40
Per-Unit Representation
41
Per-Unit Representation
42
Per-Unit Representation
43
Per-Unit Representation
44
Per-Unit Representation
45
Per-Unit Representation
46
Per-Unit Representation
47
Per-Unit Representation
48
Per-Unit Representation
49
Per-Unit Representation
50
Per-Unit Representation
51
Per-Unit Representation
52
Per-Unit Representation
53
Per-Unit Representation
54
Per-Unit Representation
55
Per-Unit Representation
56
Per-Unit Representation
57
Per-Unit Representation
58
Per-Unit Representation
59
Per-Unit Representation
The primary advantages of per-unit system in power system analysis
are:
1.The per-unit values for the transformer impedance, voltage and
current are identical when referred to the primary and secondary (no
need to reflect impedances from one side of the transformer to the
other, the transformer is a single impedance)
2.The per-unit values for various components lie within a narrow
range regardless of the equipment rating.
3.The use of √3 in three-phase calculation is reduced
4.Ideal for computer simulations
60
Per-Unit Representation
61
Per-Unit Representation
62
Per-Unit Representation
63
Per-Unit Representation
64
Per-Unit Representation
65
Per-Unit Representation
66
Per-Unit Representation
67
Per-Unit Representation
68
Per-Unit Representation
69
Per-Unit Representation
70
Per-Unit Representation
Summary
 Common quantities used in power system analysis are voltage (kV),
current (kA), volt-amperes (kVA or MVA), and impedance (Ω).
 It is very cumbersome to convert currents to a different voltage level
in a power system having two or more voltage levels.
 Per-unit representation is introduced such that the various physical
quantities are expressed as a decimal fraction or multiples of base
quantities and is defined as:
quantity
of
value
base
quantity
actual
unit
-
per
in
Quantity 
71
Per-Unit Representation
Summary
 For simplicity, per-unit is always written as pu.
 For single-phase systems:






1
1
1
1
1
2
LN
LN
LN
1
MVA
base
MW
power,
Base
kVA
base
kW
power,
Base
MVA
base
)
kV
voltage,
(base
impedance
Base
A
current,
base
V
voltage,
base
impedance
Base
kV
voltage,
base
kVA
base
A
current,
Base





72
Per-Unit Representation
Summary






3
3
3
3
3
2
LL
LL
3
MVA
base
MW
power,
Base
kVA
base
kW
power,
Base
MVA
base
)
kV
voltage,
(base
impedance
Base
kV
voltage,
base
X
3
kVA
base
A
current,
Base




 For three-phase systems:
73
Per-Unit Representation
Summary
Changing the Base of Per-unit Quantities
 The impedance of individual generators and transformers are
generally in terms of % or pu quantities based on their own ratings
(By manufacturer).
 For power system analysis, all impedances must be expressed in pu
on a common system base. Thus, it is necessary to convert the pu
impedances from one base to another (common base, for example:
100 MVA).
 Per-unit impedance of a circuit element is
2
kV)
voltage,
(base
MVA)
(base
X
)
impedance,
(actual 

74
Per-Unit Representation
Summary

















old
new
2
new
old
old
new
MVA
base
MVA
base
kV
base
kV
base
unit Z
-
per
unit Z
-
Per
Changing the Base of Per-unit Quantities
 The equation shows that pu impedance is directly
proportional to base MVA and inversely proportional to
the square of the base voltage.
 Therefore, to change from old base pu impedance to
new base pu impedance, the following equation applies:
75
Per-Unit Representation
Example :
A 30 MVA 13.8 kV three-phase generator has a subtransient reactance of 15%.
The generator supplies two motors over a transmission line having
transformers at both ends, as shown in the one-line diagram below. The motors
have rated inputs of 20 MVA and 10 MVA, both 12.5 kV with x” = 20%. The three-
phase transformer T1 is rated 35 MVA, 13.2Δ – 115Y kV with leakage reactance
of 10%. Transformer T2 is composed of three single-phase transformers each
rated at 10 MVA, 12.5Δ – 67Y kV with leakage reactance of 10%. Series
reactance of the transmission line is 80 Ω. Draw the reactance diagram with all
reactance marked in per unit. Select the generator rating as base in the
generator circuit.
Cont…
1
2
(13.8 kV)
k n
(120 kV)
l m
T1 T2
p
r
(12.9 kV)
76
Per-Unit Representation
Solution:
The three-phase rating of transformer T2 is 3 X 10 MVA = 30 MVA.
and its line-to-line voltage ratio is 12.5 – √3 X 67 = 12.5 – 116 kV.
A base of 30 MVA, 13.8 kV in the generator circuit requires a 30 MVA base in all
parts of the system and the following voltage bases:
In transmission line: 13.8(115/13.2) = 120 kV.
In motor circuit: 120(12.5/116) = 12.9 kV.
The reactance of the transformers converted to the proper base are:
Transformer T1: X = 0.1 (13.2/13.8)2
(30/35) = 0.0784 pu.
Transformer T2: X = 0.1(12.5/12.9)2
(30/10) = 0.28 pu.
The base impedance of the transmission line is
(120 kV)2
/30 MVA = 480 Ω
and the reactance of the line is (80/480) = 0.167 pu.
Reactance of motor 1 = 0.2 (12.5/12.9)2
(30/20) = 0.282 pu.
Reactance of motor 2 = 0.2 (12.5/12.9)2
(30/10) = 0.563 pu.
Cont…
77
Per-Unit Representation
Solution:
Eg Em2
Em1
jo.15
j0.0784 j0.167 j0.0940
j0.282 j0.563
p r
n
m
l
k
Reactance diagram :

Three Phase network chapter3-230622072335-c096071e.ppt