


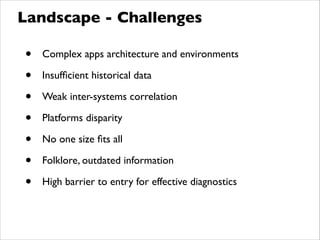

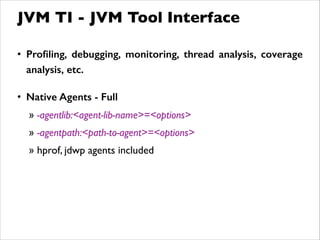
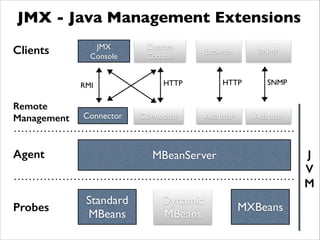
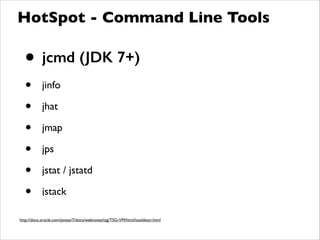

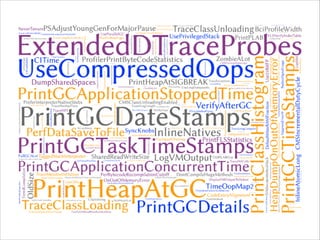
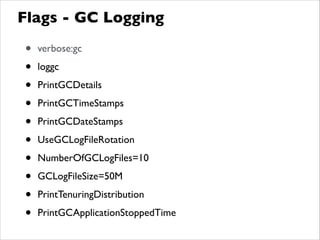
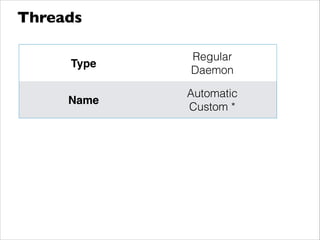
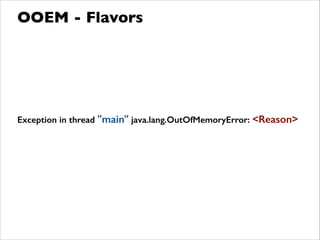
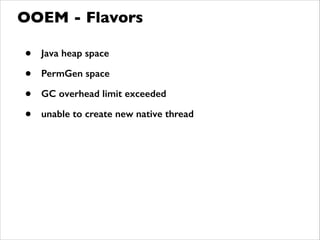
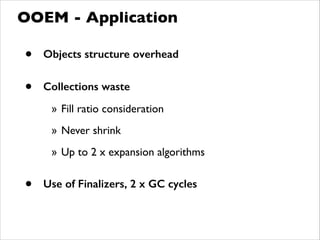
![-XX are not stable and are subject to change without notice
!
Boolean
-XX:+<option> or -XX:-<option>
!
Numeric
-XX:<option>=<number>[unit]
Unit:‘k’,‘K’,‘m’,‘M’,‘g’,‘G’ - 32768 or 32k
!
String
-XX:<option>=<string>
Flags](https://image.slidesharecdn.com/threadsneedlesstacksheaps-140316111049-phpapp02/85/Threads-Needles-Stacks-Heaps-Java-edition-31-320.jpg)


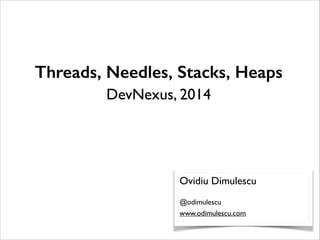
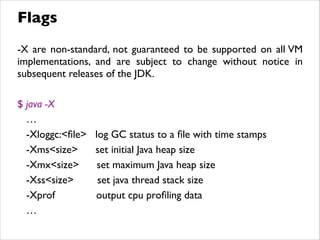
![Thread Dump
"main" prio=5 tid=0x0000000101028800 nid=0x507 runnable [0x00007fff5fbfd000]
java.lang.Thread.State: RUNNABLE
at org.eclipse.swt.internal.cocoa.OS.objc_msgSend_bool(Native Method)
at org.eclipse.swt.internal.cocoa.NSRunLoop.runMode(NSRunLoop.java:42)
at org.eclipse.swt.widgets.Display.sleep(Display.java:4565)
at org.eclipse.ui.application.WorkbenchAdvisor.eventLoopIdle(WorkbenchAdvisor.java:364)
at org.eclipse.ui.internal.ide.application.IDEWorkbenchAdvisor.eventLoopIdle(IDEWorkbenchAdvisor.java:917)
at org.eclipse.ui.internal.Workbench$3.eventLoopIdle(Workbench.java:459)
at org.eclipse.e4.ui.internal.workbench.swt.PartRenderingEngine$9.run(PartRenderingEngine.java:1026)
at org.eclipse.core.databinding.observable.Realm.runWithDefault(Realm.java:332)
at org.eclipse.e4.ui.internal.workbench.swt.PartRenderingEngine.run(PartRenderingEngine.java:916)
at org.eclipse.e4.ui.internal.workbench.E4Workbench.createAndRunUI(E4Workbench.java:86)
at org.eclipse.ui.internal.Workbench$5.run(Workbench.java:585)
at org.eclipse.core.databinding.observable.Realm.runWithDefault(Realm.java:332)
at org.eclipse.ui.internal.Workbench.createAndRunWorkbench(Workbench.java:540)
at org.eclipse.ui.PlatformUI.createAndRunWorkbench(PlatformUI.java:149)
at org.eclipse.ui.internal.ide.application.IDEApplication.start(IDEApplication.java:124)
at org.eclipse.equinox.internal.app.EclipseAppHandle.run(EclipseAppHandle.java:196)
at org.eclipse.core.runtime.internal.adaptor.EclipseAppLauncher.runApplication(EclipseAppLauncher.java:110)
at org.eclipse.core.runtime.internal.adaptor.EclipseAppLauncher.start(EclipseAppLauncher.java:79)
at org.eclipse.core.runtime.adaptor.EclipseStarter.run(EclipseStarter.java:353)
at org.eclipse.core.runtime.adaptor.EclipseStarter.run(EclipseStarter.java:180)
at sun.reflect.NativeMethodAccessorImpl.invoke0(Native Method)
at sun.reflect.NativeMethodAccessorImpl.invoke(NativeMethodAccessorImpl.java:57)
at sun.reflect.DelegatingMethodAccessorImpl.invoke(DelegatingMethodAccessorImpl.java:43)
at java.lang.reflect.Method.invoke(Method.java:606)
at org.eclipse.equinox.launcher.Main.invokeFramework(Main.java:629)
at org.eclipse.equinox.launcher.Main.basicRun(Main.java:584)
at org.eclipse.equinox.launcher.Main.run(Main.java:1438)](https://image.slidesharecdn.com/threadsneedlesstacksheaps-140316111049-phpapp02/85/Threads-Needles-Stacks-Heaps-Java-edition-48-320.jpg)
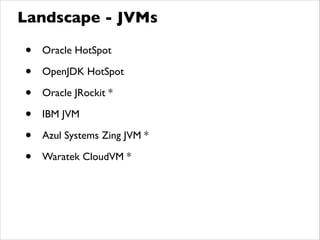
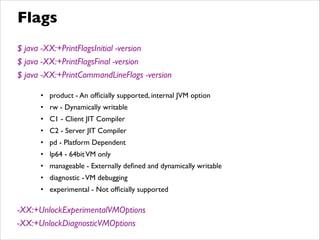
![Thread Dump
"C2 CompilerThread1" daemon prio=5 tid=0x0033 nid=0x6703 waiting on condition [0x0000000000000000]
java.lang.Thread.State: RUNNABLE
!
"C2 CompilerThread0" daemon prio=5 tid=0x0011 nid=0x6503 waiting on condition [0x0000000000]
java.lang.Thread.State: RUNNABLE
!
"Signal Dispatcher" daemon prio=5 tid=0x0022 nid=0x6303 runnable [0x0000000000000000]
java.lang.Thread.State: RUNNABLE
!
"Finalizer" daemon prio=5 tid=0x0044 nid=0x5f03 in Object.wait() [0x000000010b88b000]
java.lang.Thread.State:WAITING (on object monitor)
!
"Reference Handler" daemon prio=5 tid=0x0055 nid=0x5d03 in Object.wait() [0x000000010b788000]
java.lang.Thread.State:WAITING (on object monitor)
!
"VM Thread" prio=5 tid=0x0066 nid=0x5b03 runnable
!
"GC task thread#0 (ParallelGC)" prio=5 tid=0x000000010102d000 nid=0x5303 runnable
!
"GC task thread#1 (ParallelGC)" prio=5 tid=0x0000000101038800 nid=0x5503 runnable
!
"GC task thread#2 (ParallelGC)" prio=5 tid=0x0000000101039000 nid=0x5703 runnable
!
"GC task thread#3 (ParallelGC)" prio=5 tid=0x0000000101039800 nid=0x5903 runnable
!
"VM Periodic Task Thread" prio=5 tid=0x0000000101058000 nid=0x6b03 waiting on condition
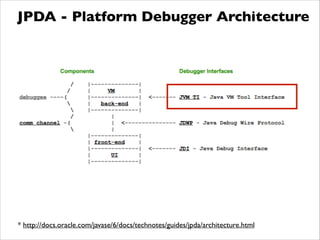
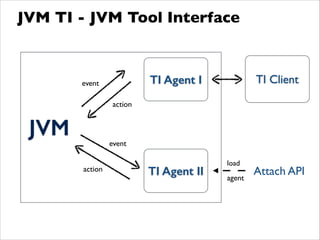
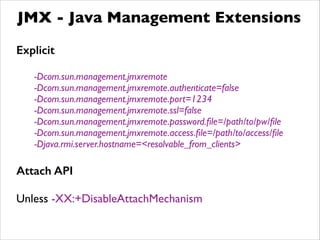
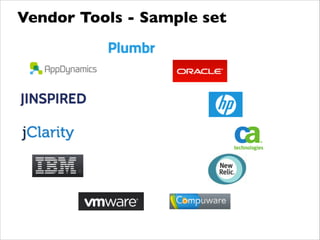
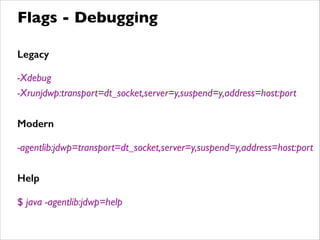
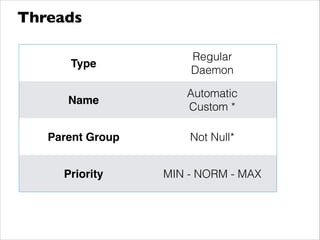
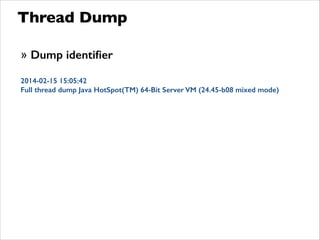
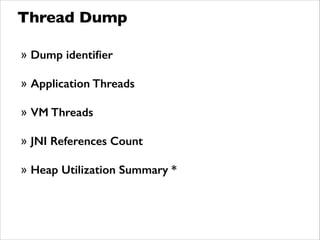
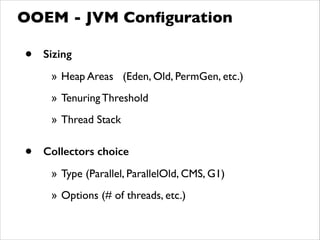
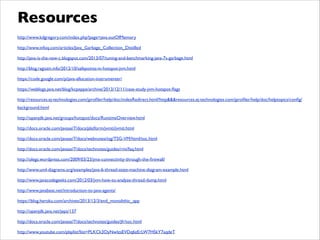
In general theVM thread is in one of three states: waiting to execute aVM operation, synchronizing all threads in preparation for aVM
operation, or executing aVM operation. If you suspect that a hang is a HotSpotVM bug rather than an application or class library
deadlock, then pay special attention to theVM thread.](https://image.slidesharecdn.com/threadsneedlesstacksheaps-140316111049-phpapp02/85/Threads-Needles-Stacks-Heaps-Java-edition-50-320.jpg)
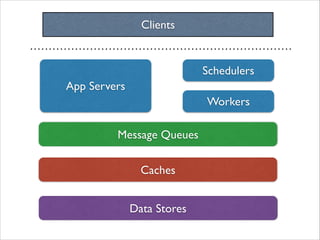
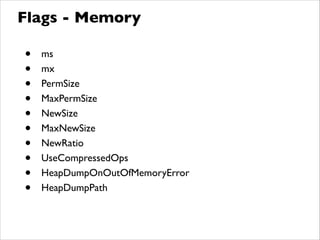
![Thread Dump
“Thread I" prio=5 tid=0x0100 nid=0x1ef runnable [0x01acff]
java.lang.Thread.State: RUNNABLE
!
“Thread 3" prio=5 tid=0x0300 nid=0x3dd in Object.wait() [0x0366]
java.lang.Thread.State:TIMED_WAITING (on object monitor)
!
“Thread 4" prio=5 tid=0x0400 nid=0x4ab in Object.wait() [0x0477]
java.lang.Thread.State:WAITING (on object monitor)
!
“Thread 5" prio=5 tid=0x0500 nid=0x5bd waiting for monitor entry [0x0523]
java.lang.Thread.State: BLOCKED (on object monitor)
!
“Thread 2" prio=5 tid=0x0200 nid=0x2ef waiting on condition [0x02b8]
java.lang.Thread.State:TIMED_WAITING (sleeping)
!
“Thread 6" prio=5 tid=0x0600 nid=0x6ef waiting on condition [0x06b8]
java.lang.Thread.State: TIMED_WAITING (sleeping)](https://image.slidesharecdn.com/threadsneedlesstacksheaps-140316111049-phpapp02/85/Threads-Needles-Stacks-Heaps-Java-edition-54-320.jpg)


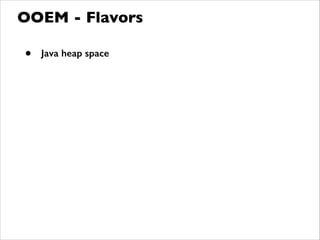
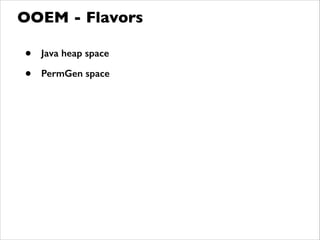
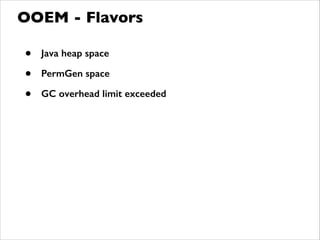
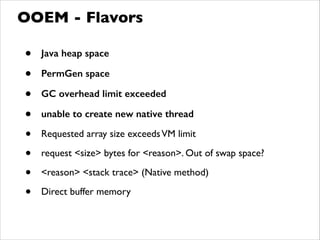

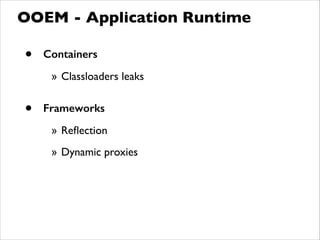

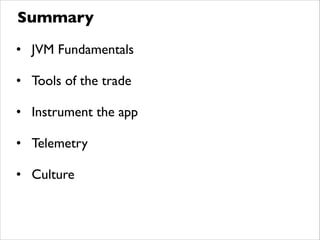


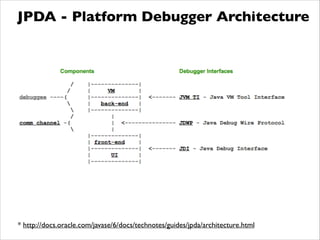
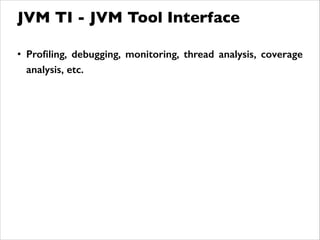
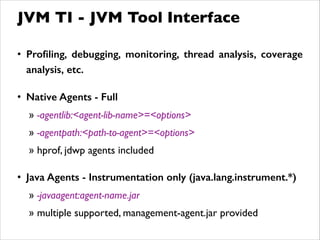
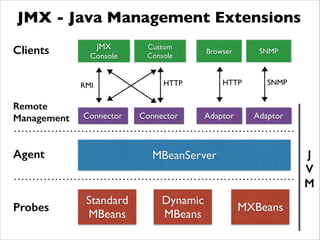
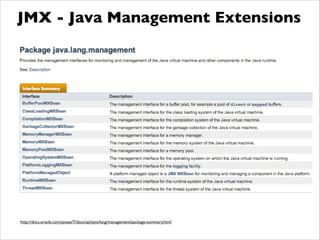
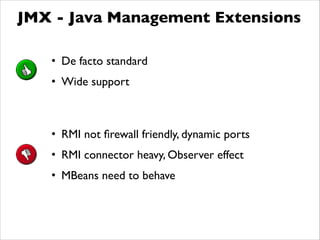
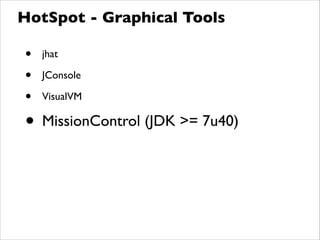
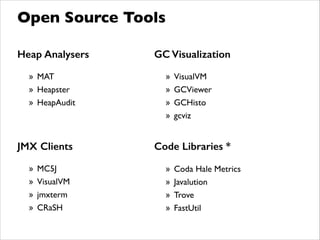
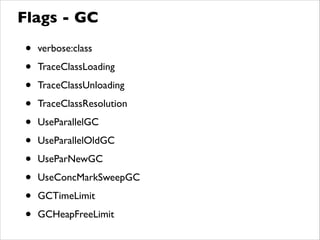
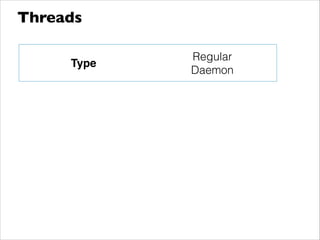
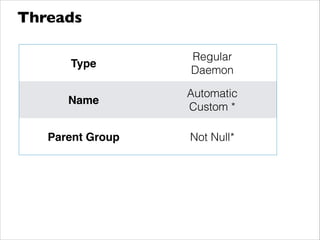
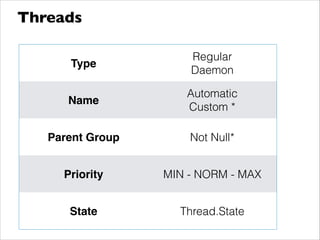
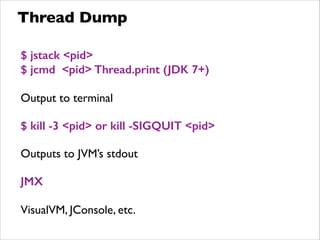
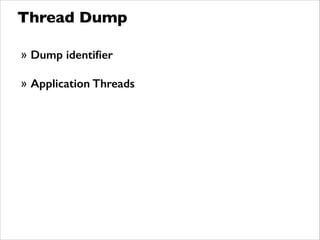
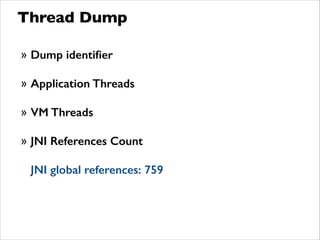
The thread dump identifies the application and JVM threads present in the JVM at the time of the dump. It provides information on each thread's state, stack trace and timing details. It also includes a summary of JVM heap utilization broken down by generation. This information can help identify potential blocking issues, performance bottlenecks or memory leaks in the application.