The document provides a comprehensive overview of the ninth edition of 'Crime Prevention: Approaches, Practices, and Evaluations' by Steven P. Lab, emphasizing its applied and practical focus for students and practitioners. It details various crime prevention strategies, including primary, secondary, and tertiary prevention measures, and addresses the importance of evaluating the efficacy of these programs. The edition is updated with new research and incorporates emerging prevention techniques while maintaining a traditional pedagogical structure.

![efforts to prevent crime with the detection of and intervention
with offenders. This is in contrast to the existing
paradigm within criminal justice where “Crime is seen as
fundamentally about offenders rather than
situations” (Laycock, 2005, p. 21). The emphasis on offenders
involves the criminal justice system in the
apprehension, adjudication and punishment/treatment of
offenders. Little or no concern is paid to prevention
of crime. Conversely, “[c]rime science is the application of the
methods of science to crime and disorder”
(Laycock, 2005, p. 4).
42
In essence, crime science attacks crime from a wide range of
disciplines using a broad array of tools. Among
the disciplines included are those traditionally found in
discussions of crime and criminality—sociology,
psychology, criminology, and criminal justice. Also included,
however, are the fields of engineering, biology,
physics, architecture, genetics, communications, computer
science, education, and many others. Each of these
disciplines offers insight to the behavior of individuals, how to
control or manipulate the physical and social
environment, the development of safety and security devices, or
a myriad of other factors that play a role in
crime and crime control. A primary goal of crime science is to
bring these divergent disciplines together into a
functional, coordinated response to crime (Laycock, 2005).
In many ways, crime science fits nicely in the public health
prevention model. An examination of the
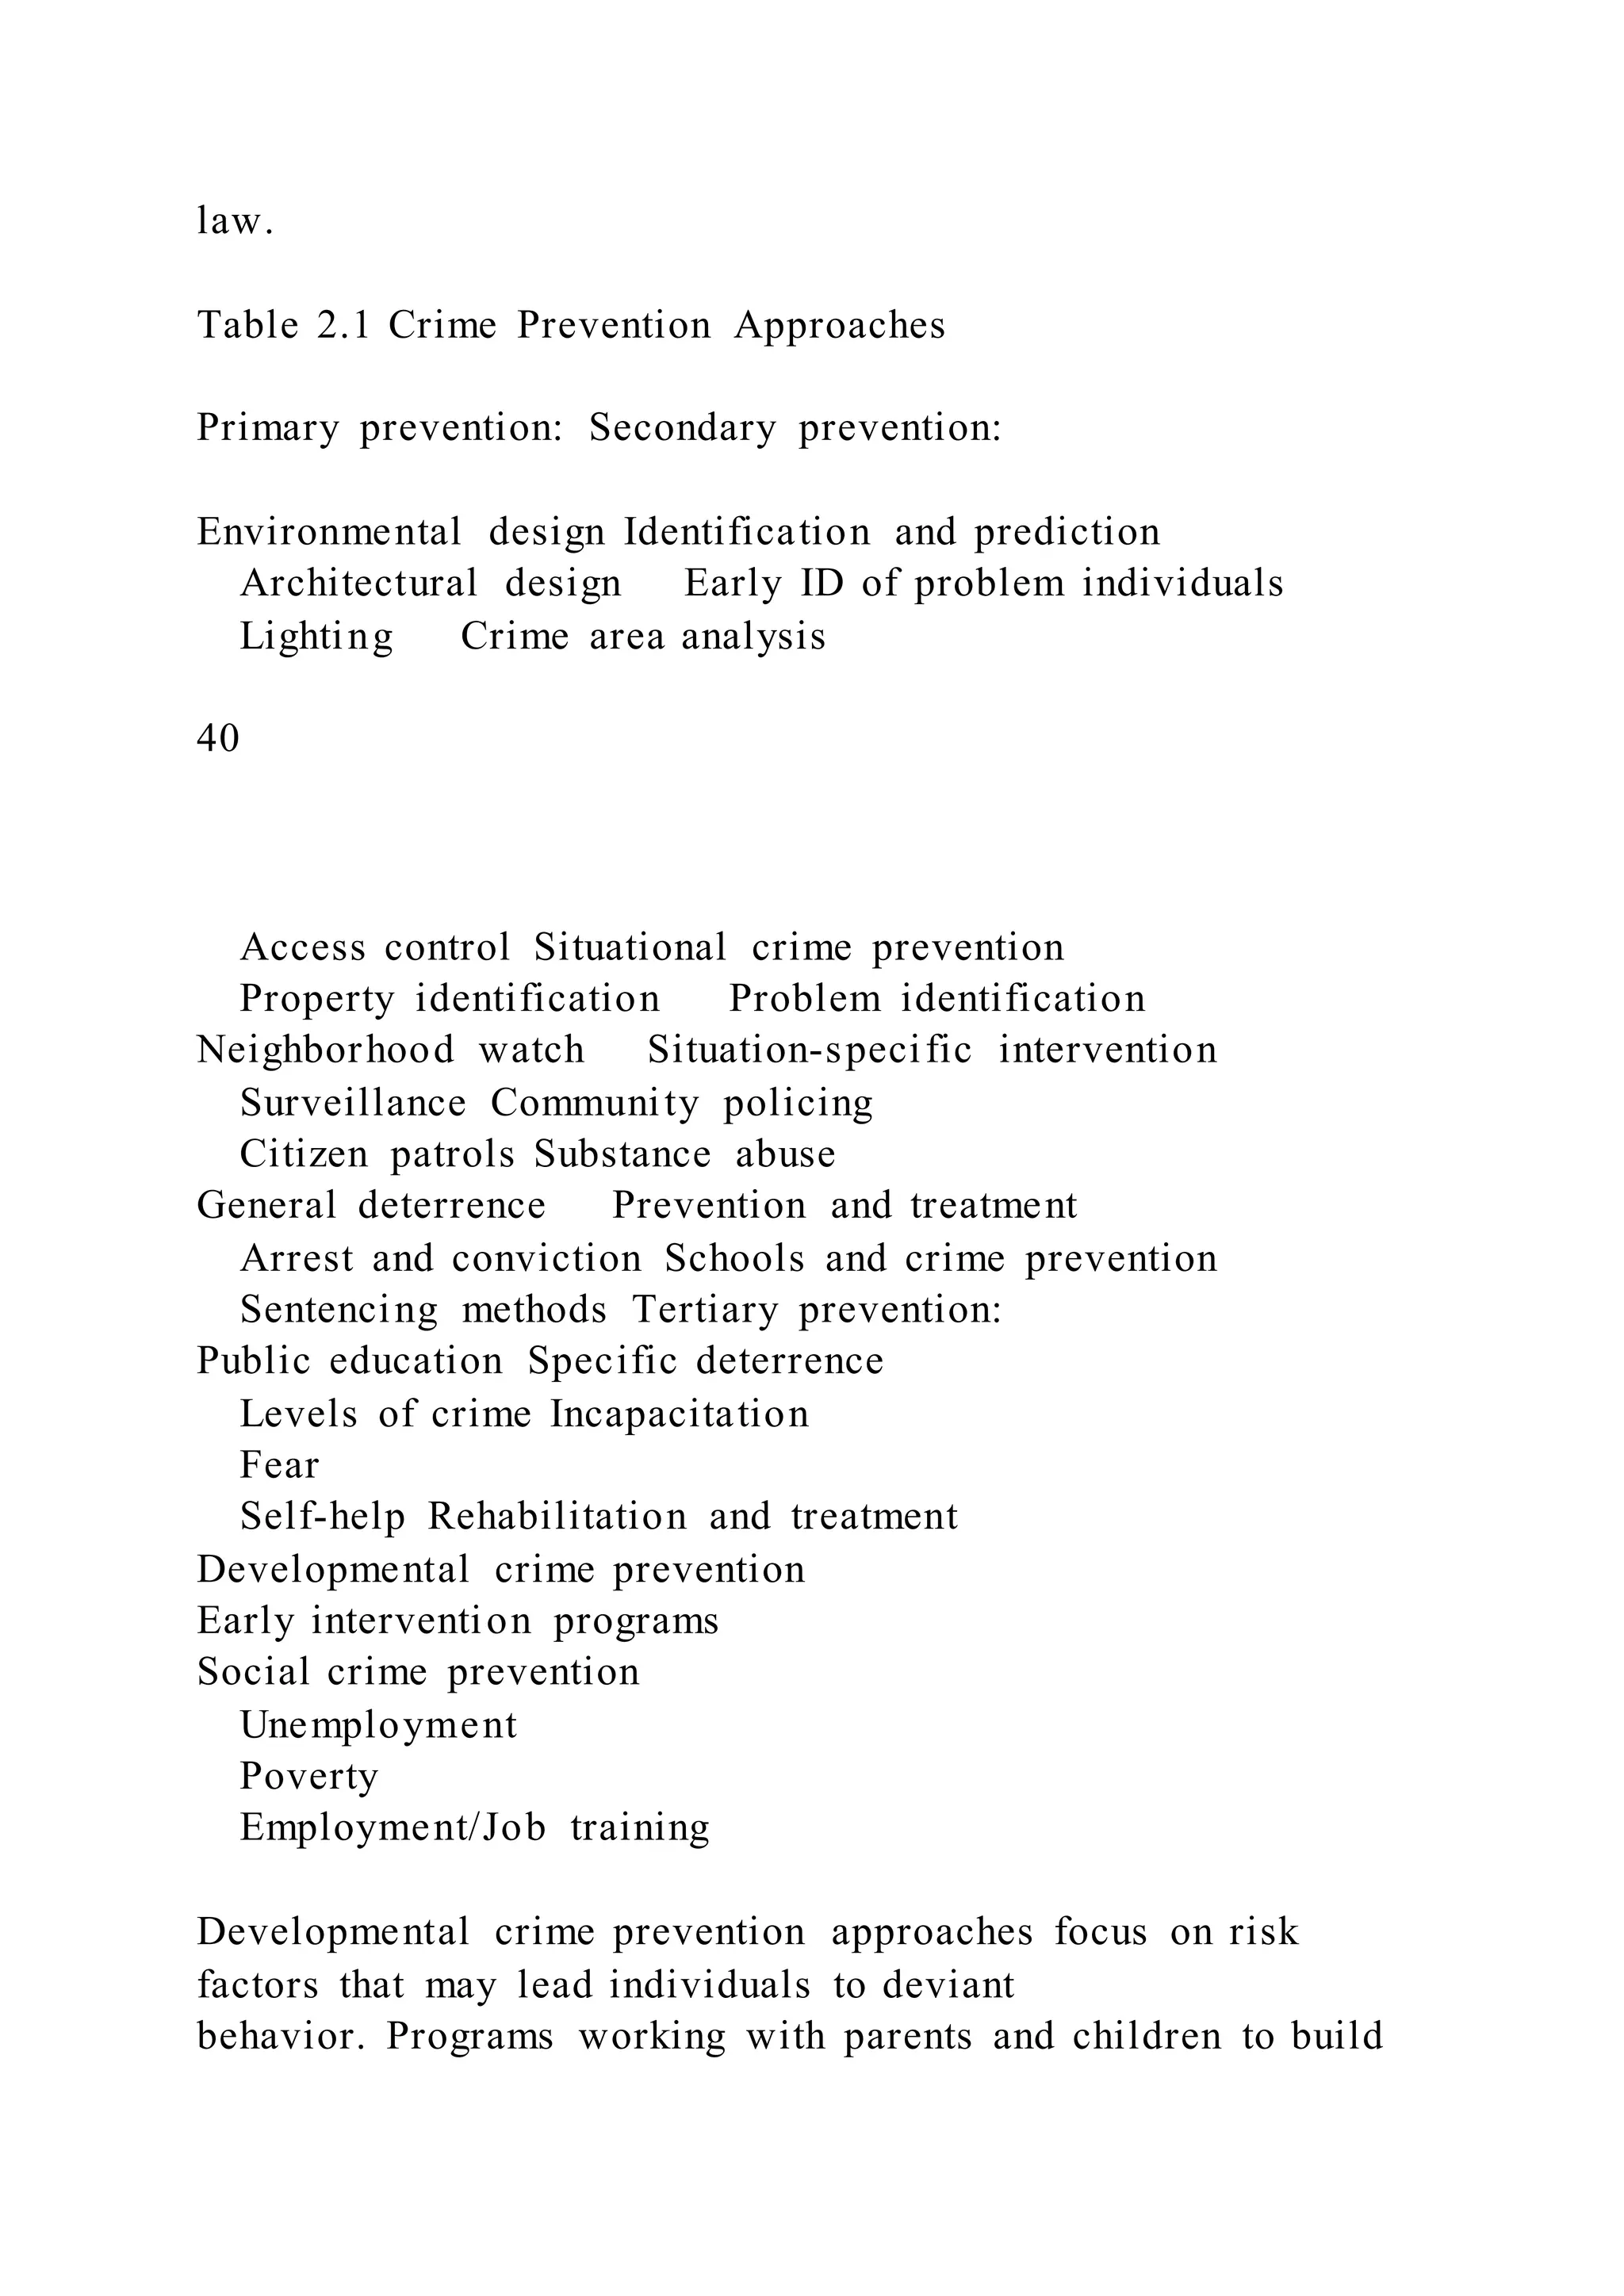
approaches listed in Table 2.1 shows a wide array of actions and
interventions that require the knowledge and](https://image.slidesharecdn.com/thisisaclearandcomprehensiveapproachtocrimepreven-220922170556-1140af39/75/This-is-a-clear-and-comprehensive-approach-to-crime-preven-71-2048.jpg)


![Contemporary crime reduction strategies[1]stu](https://cdn.slidesharecdn.com/ss_thumbnails/contemporarycrimereductionstrategies1stu-131001031356-phpapp01-thumbnail.jpg?width=640&height=640&fit=bounds)


![5. An electric motor accomplishes what task[removed]convert.docx](https://cdn.slidesharecdn.com/ss_thumbnails/5-221119170423-4efddc27-thumbnail.jpg?width=640&height=640&fit=bounds)


