SlideShare a Scribd company logo
1 of 15
Download to read offline
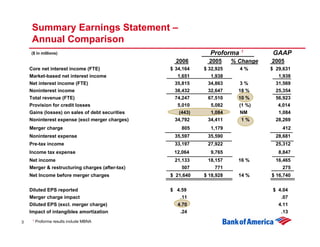
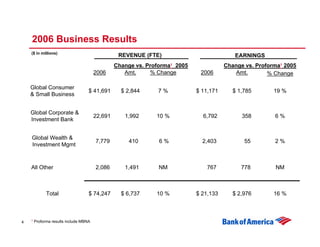
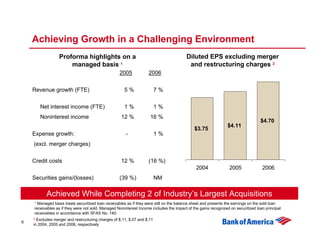
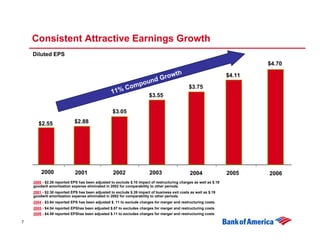
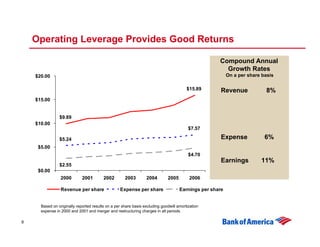
Bank of America
Opportunities For Growth
Ken Lewis
Chairman, President and Chief Executive Officer


Citigroup Financial Services Conference
January 31, 2007
Forward Looking Statements
    This presentation contains forward-looking statements, including statements about the financial
    conditions, results of operations and earnings outlook of Bank of America Corporation. The forward-
    looking statements involve certain risks and uncertainties. Factors that may cause actual results or
    earnings to differ materially from such forward-looking statements include, among others, the
    following: 1) projected business increases following process changes and other investments are lower
    than expected; 2) competitive pressure among financial services companies increases significantly; 3)
    general economic conditions are less favorable than expected; 4) political conditions including the
    threat of future terrorist activity and related actions by the United States abroad may adversely affect
    the company’s businesses and economic conditions as a whole; 5) changes in the interest rate
    environment reduce interest margins and impact funding sources; 6) changes in foreign exchange
    rates increases exposure; 7) changes in market rates and prices may adversely impact the value of
    financial products; 8) legislation or regulatory environments, requirements or changes adversely affect
    the businesses in which the company is engaged; 9) changes in accounting standards, rules or
    interpretations, 10) litigation liabilities, including costs, expenses, settlements and judgments, may
    adversely affect the company or its businesses; 11) mergers and acquisitions and their integration
    into the company; and 12) decisions to downsize, sell or close units or otherwise change the business
    mix of any of the company. For further information regarding Bank of America Corporation, please
    read the Bank of America reports filed with the SEC and available at www.sec.gov.


2
Summary Earnings Statement –
     Annual Comparison
    ($ in millions)                                            Proforma 1           GAAP
                                                   2006        2005     % Change   2005
    Core net interest income (FTE)               $ 34,164    $ 32,925     4%       $ 29,631
    Market-based net interest income                1,651       1,938                 1,938
    Net interest income (FTE)                      35,815      34,863      3%        31,569
    Noninterest income                             38,432      32,647     18 %       25,354
    Total revenue (FTE)                            74,247      67,510     10 %       56,923
    Provision for credit losses                     5,010       5,082     (1 %)       4,014
    Gains (losses) on sales of debt securities       (443)      1,084      NM         1,084
    Noninterest expense (excl merger charges)      34,792      34,411      1%        28,269
    Merger charge                                     805      1,179                   412
    Noninterest expense                            35,597     35,590                 28,681
    Pre-tax income                                 33,197     27,922                 25,312
    Income tax expense                            12,064       9,765                  8,847
    Net income                                     21,133     18,157      16 %       16,465
    Merger & restructuring charges (after-tax)        507        771                   275
    Net Income before merger charges             $ 21,640    $ 18,928     14 %     $ 16,740


    Diluted EPS reported                         $ 4.59                             $ 4.04
    Merger charge impact                            .11                                .07
    Diluted EPS (excl. merger charge)              4.70                               4.11
    Impact of intangibles amortization              .24                                .13
     1   Proforma results include MBNA
3
2006 Business Results
    ($ in millions)
                                                  REVENUE (FTE)                            EARNINGS
                                                 Change vs. Proforma1 2005              Change vs. Proforma1 2005
                                        2006        Amt.     % Change         2006          Amt.       % Change

    Global Consumer
                                    $ 41,691       $ 2,844      7%           $ 11,171      $ 1,785       19 %
    & Small Business


    Global Corporate &
                                        22,691      1,992      10 %            6,792          358        6%
    Investment Bank


    Global Wealth &
                                        7,779         410       6%             2,403           55        2%
    Investment Mgmt


    All Other                           2,086       1,491       NM              767           778        NM


              Total                 $ 74,247       $ 6,737     10 %          $ 21,133      $ 2,976       16 %


    1   Proforma results include MBNA
4
Short-term Outlook

    •   Continuing flat yield curve environment
    •   Expect GDP growth around 3%
    •   Core net interest income growth in low single digits
    •   Reduced equity investment gains
    •   Credit costs continue to season and normalize
    •   Positive operating leverage


5
Achieving Growth in a Challenging Environment
                  Proforma highlights on a                                               Diluted EPS excluding merger
                      managed basis 1                                                     and restructuring charges 2
                                                   2005            2006


    Revenue growth (FTE)                              5%                 7%

       Net interest income (FTE)                      1%                 1%
       Noninterest income                           12 %            16 %
                                                                                                                                  $4.70
                                                                                                                $4.11
                                                                                             $3.75
    Expense growth:                                    -                 1%
    (excl. merger charges)

    Credit costs                                    12 %           (16 %)
                                                                                              2004               2005              2006
    Securities gains/(losses)                      (39 %)                NM

           Achieved While Completing 2 of Industry’s Largest Acquisitions
    1 Managed basis treats securitized loan receivables as if they were still on the balance sheet and presents the earnings on the sold loan

    receivables as if they were not sold. Managed Noninterest Income includes the impact of the gains recognized on securitized loan principal
    receivables in accordance with SFAS No. 140.
    2 Excludes merger and restructuring charges of $.11, $.07 and $.11
6
    in 2004, 2005 and 2006, respectively
Consistent Attractive Earnings Growth
    Diluted EPS
                                                                                                                          $4.70

                                                                             ow       th                          $4.11
                                                                       nd Gr
                                                         pou
                                                     C om                                    $3.75
                                                 11%        $3.55

                                                 $3.05

       $2.55               $2.88


        2000                2001                 2002                 2003                    2004                2005    2006
    2000 - $2.26 reported EPS has been adjusted to exclude $.10 impact of restructuring charges as well as $.19
    goodwill amortization expense eliminated in 2002 for comparability to other periods.
    2001 - $2.30 reported EPS has been adjusted to exclude $.39 impact of business exit costs as well as $.19
    goodwill amortization expense eliminated in 2002 for comparability to other periods.
    2004 - $3.64 reported EPS has been adjusted $. 11 to exclude charges for merger and restructuring costs.
    2005 - $4.04 reported EPShas been adjusted $.07 to excludes charges for merger and restructuring costs
    2006 - $4.59 reported EPShas been adjusted $.11 to excludes charges for merger and restructuring costs

7
Operating Leverage Provides Good Returns

                                                                                                    Compound Annual
                                                                                                      Growth Rates
    $20.00                                                                                               On a per share basis

                                                                                        $15.89       Revenue              8%
    $15.00


                $9.89
    $10.00
                                                                                         $7.57

                $5.24                                                                                Expense             6%
     $5.00
                                                                                         $4.70
                                                                                                     Earnings          11%
                $2.55
     $0.00
                 2000        2001        2002        2003        2004        2005        2006

                 Revenue per share                Expense per share                 Earnings per share


      Based on originally reported results on a per share basis excluding goodwill amortization
      expense in 2000 and 2001 and merger and restructuring charges in all periods

8
Effectively Managing Costs

                                                     Efficiency Ratio

                                              55%
                            54%
                                                      53%           53%
                                                             52%

                                                                           49%
                                                                                  47%


                             2000             2001    2002   2003   2004   2005   2006


    Excludes merger & restructuring charges

9
Making Good Capital Decisions
               Capital Investment     Primary Advantage
     • Santander Serfin
                                     Enhance multicultural strategy


     • National Processing           Gain scale in merchant services
                                     business


     • China Construction Bank       Tap into tremendous growth of
                                     Chinese economy

     • Fleet
                                     Complete national franchise and
                                     entry into NE wealth markets


     • MBNA                          Become premier payments
                                     provider and leverage products
                                     and distribution


10
Providing Good Returns
         Bank of America
              15%
                                                   JP Morgan
                                                               US Bancorp
                                                     13%
                                        KBW Bank                            Wachovia
                                                                12%
                      S & P 500           Index                                        Wells Fargo
                                                                             11%
                       10%                10%                                            10%         Citigroup
                                  Dow
                                                                                                       9%
                                  8%


                     Total Annualized Shareholder Return From 12/31/03

         Bank of America

              20%
                                                   Wachovia
                                                     16%
                                                              US Bancorp

                                        KBW Bank                12%
                                          Index
                                                                       Wells Fargo
                                           8%                                          Citigroup
                                  Dow                                        7%                    JP Morgan
                                                                                         6%
                     S & P 500    5%                                                                  5%
                       3%


                     Total Annualized Shareholder Return From 12/31/00

11
29 Consecutive Years of Dividend Increases

                                                                                          $2.12
                           Dividend
                             Yield
                            4.30%
                                                                                    wth
                                                                             ed gr o
                                                                         z
                                                                     uali
                                                                  ann
                                                           13%


         1977                                                                              2006
     Yield based on annualized dividend and price as of 1/26/07

12
Aggressively Managing Excess Capital
     $ in millions
     • Including net share repurchases and dividends,
       returned more than $80 billion in capital since 1998
                                                                                             $80,237
     • Since 1998, net share repurchases plus dividends
       have averaged 80% of net income.

                                                                                             $44,626


                                                                                             $35,611
                                                               Repurchases      Dividends


                         1998     1999   2000   2001   2002   2003   2004    2005    2006    Cumulative

 Capital returned as %
                         58 %     88 %   84 %   96 %   89 %   91 %   63 %    63 %    91 %      80 %
      of earnings


                         Tier 1                                                     Tier 1
                         7.06%                                                      8.64%

13
Bank of America Differentiating Factors

       Ubiquitous franchise
        •   Vast customer base
        •   Unparalleled customer convenience
        •   Market and product leadership positions
        •   Information and innovation
       Demonstrated ability to execute
        •   Leverage franchise capabilities
        •   Provide innovative customer solutions
        •   Superior integration expertise
       Opportunities for continued organic growth
        •   Retail banking penetration
        •   Capturing the wealth opportunity
        •   Commercial banking client expansion

14
15

More Related Content

What's hot

progressive mreport-06/05
progressive mreport-06/05progressive mreport-06/05
progressive mreport-06/05finance18
 
3Q 2012 Ryder System, Inc. Earnings Presentation
3Q 2012 Ryder System, Inc. Earnings Presentation3Q 2012 Ryder System, Inc. Earnings Presentation
3Q 2012 Ryder System, Inc. Earnings PresentationRyder System, Inc.
 
2007 Results Presentation
2007 Results Presentation2007 Results Presentation
2007 Results PresentationJBS RI
 
citigroup April 16, 2007 - First Quarter Press Release
citigroup April 16, 2007 - First Quarter Press Releasecitigroup April 16, 2007 - First Quarter Press Release
citigroup April 16, 2007 - First Quarter Press ReleaseQuarterlyEarningsReports
 
allstate Quarterly Investor Information Earnings Press Release 2004 1st
allstate Quarterly Investor Information Earnings Press Release  2004 1stallstate Quarterly Investor Information Earnings Press Release  2004 1st
allstate Quarterly Investor Information Earnings Press Release 2004 1stfinance7
 
Bank of America Corporation Shareholders Meeting
	Bank of America Corporation Shareholders Meeting	Bank of America Corporation Shareholders Meeting
Bank of America Corporation Shareholders MeetingQuarterlyEarningsReports3
 
2Q 2012 Ryder System, Inc. Earnings Presentation
2Q 2012 Ryder System, Inc. Earnings Presentation2Q 2012 Ryder System, Inc. Earnings Presentation
2Q 2012 Ryder System, Inc. Earnings PresentationRyder System, Inc.
 
progressive mreport-07/04
progressive mreport-07/04progressive mreport-07/04
progressive mreport-07/04finance18
 
progressive mreport-11/05
progressive mreport-11/05progressive mreport-11/05
progressive mreport-11/05finance18
 
progressive mreport-09/05
progressive mreport-09/05progressive mreport-09/05
progressive mreport-09/05finance18
 
HSBC 2007 Interim Results Presentation to Investors and Analysts
HSBC 2007 Interim Results Presentation to Investors and AnalystsHSBC 2007 Interim Results Presentation to Investors and Analysts
HSBC 2007 Interim Results Presentation to Investors and AnalystsQuarterlyEarningsReports2
 
allstate Quarterly Investor Information Earnings Press Release 2005 2nd
allstate Quarterly Investor Information Earnings Press Release 2005 2ndallstate Quarterly Investor Information Earnings Press Release 2005 2nd
allstate Quarterly Investor Information Earnings Press Release 2005 2ndfinance7
 
raytheon Q4 Earnings Presentation
raytheon Q4 Earnings Presentationraytheon Q4 Earnings Presentation
raytheon Q4 Earnings Presentationfinance12
 

What's hot (15)

progressive mreport-06/05
progressive mreport-06/05progressive mreport-06/05
progressive mreport-06/05
 
3Q 2012 Ryder System, Inc. Earnings Presentation
3Q 2012 Ryder System, Inc. Earnings Presentation3Q 2012 Ryder System, Inc. Earnings Presentation
3Q 2012 Ryder System, Inc. Earnings Presentation
 
2007 Results Presentation
2007 Results Presentation2007 Results Presentation
2007 Results Presentation
 
citigroup April 16, 2007 - First Quarter Press Release
citigroup April 16, 2007 - First Quarter Press Releasecitigroup April 16, 2007 - First Quarter Press Release
citigroup April 16, 2007 - First Quarter Press Release
 
allstate Quarterly Investor Information Earnings Press Release 2004 1st
allstate Quarterly Investor Information Earnings Press Release  2004 1stallstate Quarterly Investor Information Earnings Press Release  2004 1st
allstate Quarterly Investor Information Earnings Press Release 2004 1st
 
Bank of America Corporation Shareholders Meeting
	Bank of America Corporation Shareholders Meeting	Bank of America Corporation Shareholders Meeting
Bank of America Corporation Shareholders Meeting
 
2Q 2012 Ryder System, Inc. Earnings Presentation
2Q 2012 Ryder System, Inc. Earnings Presentation2Q 2012 Ryder System, Inc. Earnings Presentation
2Q 2012 Ryder System, Inc. Earnings Presentation
 
progressive mreport-07/04
progressive mreport-07/04progressive mreport-07/04
progressive mreport-07/04
 
Third Quarter 2006 Earnings Presentation
Third Quarter 2006 Earnings PresentationThird Quarter 2006 Earnings Presentation
Third Quarter 2006 Earnings Presentation
 
progressive mreport-11/05
progressive mreport-11/05progressive mreport-11/05
progressive mreport-11/05
 
progressive mreport-09/05
progressive mreport-09/05progressive mreport-09/05
progressive mreport-09/05
 
HSBC 2007 Interim Results Presentation to Investors and Analysts
HSBC 2007 Interim Results Presentation to Investors and AnalystsHSBC 2007 Interim Results Presentation to Investors and Analysts
HSBC 2007 Interim Results Presentation to Investors and Analysts
 
allstate Quarterly Investor Information Earnings Press Release 2005 2nd
allstate Quarterly Investor Information Earnings Press Release 2005 2ndallstate Quarterly Investor Information Earnings Press Release 2005 2nd
allstate Quarterly Investor Information Earnings Press Release 2005 2nd
 
raytheon Q4 Earnings Presentation
raytheon Q4 Earnings Presentationraytheon Q4 Earnings Presentation
raytheon Q4 Earnings Presentation
 
Q1 2009 Earning Report of Baldwin & Lyons
Q1 2009 Earning Report of Baldwin & LyonsQ1 2009 Earning Report of Baldwin & Lyons
Q1 2009 Earning Report of Baldwin & Lyons
 

Viewers also liked

standardchartere 2007 Annual Letter to Stockholders -
standardchartere 2007 Annual  Letter to Stockholders -standardchartere 2007 Annual  Letter to Stockholders -
standardchartere 2007 Annual Letter to Stockholders -QuarterlyEarningsReports3
 
dell 2004 Annual Report Cover Fiscal 2004 in
dell 2004 Annual Report Cover 	 Fiscal 2004 in dell 2004 Annual Report Cover 	 Fiscal 2004 in
dell 2004 Annual Report Cover Fiscal 2004 in QuarterlyEarningsReports3
 
BancAnalysts Association of Boston Conference
	BancAnalysts Association of Boston Conference	BancAnalysts Association of Boston Conference
BancAnalysts Association of Boston ConferenceQuarterlyEarningsReports3
 
Supplemental Fourth Quarter 2007 Financial Information
Supplemental Fourth Quarter 2007 Financial InformationSupplemental Fourth Quarter 2007 Financial Information
Supplemental Fourth Quarter 2007 Financial InformationQuarterlyEarningsReports3
 
Piper Jaffray Retail & Financial Services Symposium
Piper Jaffray Retail & Financial Services SymposiumPiper Jaffray Retail & Financial Services Symposium
Piper Jaffray Retail & Financial Services SymposiumQuarterlyEarningsReports3
 
Supplemental Third Quarter 2008 Financial Information
	Supplemental Third Quarter 2008 Financial Information	Supplemental Third Quarter 2008 Financial Information
Supplemental Third Quarter 2008 Financial InformationQuarterlyEarningsReports3
 
Supplemental Second Quarter 2008 Financial Information
	Supplemental Second Quarter 2008 Financial Information	Supplemental Second Quarter 2008 Financial Information
Supplemental Second Quarter 2008 Financial InformationQuarterlyEarningsReports3
 
Merrill Lynch Banking & Financial Services Conference
	Merrill Lynch Banking & Financial Services Conference	Merrill Lynch Banking & Financial Services Conference
Merrill Lynch Banking & Financial Services ConferenceQuarterlyEarningsReports3
 

Viewers also liked (18)

ford 2007 Q3 Financial Result
ford 2007 Q3 Financial Resultford 2007 Q3 Financial Result
ford 2007 Q3 Financial Result
 
standardchartere 2007 Annual Letter to Stockholders -
standardchartere 2007 Annual  Letter to Stockholders -standardchartere 2007 Annual  Letter to Stockholders -
standardchartere 2007 Annual Letter to Stockholders -
 
Second Quarter 2006 Earnings Presentation
Second Quarter 2006 Earnings PresentationSecond Quarter 2006 Earnings Presentation
Second Quarter 2006 Earnings Presentation
 
dell 2004 Annual Report Cover Fiscal 2004 in
dell 2004 Annual Report Cover 	 Fiscal 2004 in dell 2004 Annual Report Cover 	 Fiscal 2004 in
dell 2004 Annual Report Cover Fiscal 2004 in
 
Second Quarter 2007 Earnings Presentation
Second Quarter 2007 Earnings PresentationSecond Quarter 2007 Earnings Presentation
Second Quarter 2007 Earnings Presentation
 
ford 2003 Annual Report
ford 2003 Annual Reportford 2003 Annual Report
ford 2003 Annual Report
 
BancAnalysts Association of Boston Conference
	BancAnalysts Association of Boston Conference	BancAnalysts Association of Boston Conference
BancAnalysts Association of Boston Conference
 
U.S. Financial Crisis
U.S. Financial CrisisU.S. Financial Crisis
U.S. Financial Crisis
 
Supplemental Fourth Quarter 2007 Financial Information
Supplemental Fourth Quarter 2007 Financial InformationSupplemental Fourth Quarter 2007 Financial Information
Supplemental Fourth Quarter 2007 Financial Information
 
Piper Jaffray Retail & Financial Services Symposium
Piper Jaffray Retail & Financial Services SymposiumPiper Jaffray Retail & Financial Services Symposium
Piper Jaffray Retail & Financial Services Symposium
 
hp 2007 Annual Report (pdf)
hp 2007 Annual Report (pdf)hp 2007 Annual Report (pdf)
hp 2007 Annual Report (pdf)
 
First Quarter 2007 Earnings Presentation
	First Quarter 2007 Earnings Presentation	First Quarter 2007 Earnings Presentation
First Quarter 2007 Earnings Presentation
 
Supplemental Third Quarter 2008 Financial Information
	Supplemental Third Quarter 2008 Financial Information	Supplemental Third Quarter 2008 Financial Information
Supplemental Third Quarter 2008 Financial Information
 
Supplemental Second Quarter 2008 Financial Information
	Supplemental Second Quarter 2008 Financial Information	Supplemental Second Quarter 2008 Financial Information
Supplemental Second Quarter 2008 Financial Information
 
Financial Development Report 2008
Financial Development Report 2008Financial Development Report 2008
Financial Development Report 2008
 
hp 2005 Presentation
hp 2005  Presentationhp 2005  Presentation
hp 2005 Presentation
 
Merrill Lynch Banking & Financial Services Conference
	Merrill Lynch Banking & Financial Services Conference	Merrill Lynch Banking & Financial Services Conference
Merrill Lynch Banking & Financial Services Conference
 
Global Corporate & Investment Banking
Global Corporate & Investment BankingGlobal Corporate & Investment Banking
Global Corporate & Investment Banking
 

Similar to Citigroup 2007 Financial Services Conference

omnicom group Q2 2005 Investor Presentation
omnicom group  Q2 2005 Investor Presentationomnicom group  Q2 2005 Investor Presentation
omnicom group Q2 2005 Investor Presentationfinance22
 
progressive mreport-10/05
progressive mreport-10/05progressive mreport-10/05
progressive mreport-10/05finance18
 
Fourth Quarter 2010 Earnings Report
Fourth Quarter 2010 Earnings ReportFourth Quarter 2010 Earnings Report
Fourth Quarter 2010 Earnings ReportRyder System, Inc.
 
unum group StatSupp_Q405
unum group StatSupp_Q405unum group StatSupp_Q405
unum group StatSupp_Q405finance26
 
progressive mreport-12/05
progressive mreport-12/05progressive mreport-12/05
progressive mreport-12/05finance18
 
Q3 2009 Earning Report of Bank of America Corporation
Q3 2009 Earning Report of Bank of America CorporationQ3 2009 Earning Report of Bank of America Corporation
Q3 2009 Earning Report of Bank of America Corporationearningreport earningreport
 
RYDERFINAL R2Q05
RYDERFINAL R2Q05RYDERFINAL R2Q05
RYDERFINAL R2Q05finance44
 
RYDERFINAL R2Q05
RYDERFINAL R2Q05RYDERFINAL R2Q05
RYDERFINAL R2Q05finance44
 
Ryder System, Inc. 3Q 2011 Earnings
Ryder System, Inc. 3Q 2011 EarningsRyder System, Inc. 3Q 2011 Earnings
Ryder System, Inc. 3Q 2011 EarningsRyder System, Inc.
 
progressive mreport-04/05
progressive mreport-04/05progressive mreport-04/05
progressive mreport-04/05finance18
 
progressive mreport-04/05
progressive mreport-04/05progressive mreport-04/05
progressive mreport-04/05finance18
 
raytheon Q4 Earnings Presentation
raytheon Q4 Earnings Presentationraytheon Q4 Earnings Presentation
raytheon Q4 Earnings Presentationfinance12
 
3m Presentation 2006 1st
3m Presentation 2006 1st3m Presentation 2006 1st
3m Presentation 2006 1stfinance10
 
progressive mreport-06/05
progressive mreport-06/05progressive mreport-06/05
progressive mreport-06/05finance18
 
omnicom group Q1 2005 Investor Presentation
omnicom group  Q1 2005 Investor Presentationomnicom group  Q1 2005 Investor Presentation
omnicom group Q1 2005 Investor Presentationfinance22
 

Similar to Citigroup 2007 Financial Services Conference (20)

First Quarter 2006 Earnings Presentation
	First Quarter 2006 Earnings Presentation	First Quarter 2006 Earnings Presentation
First Quarter 2006 Earnings Presentation
 
Q1 2009 Earning Report of Bank of America Corp
Q1 2009 Earning Report of Bank of  America CorpQ1 2009 Earning Report of Bank of  America Corp
Q1 2009 Earning Report of Bank of America Corp
 
Bankofamericaslides
BankofamericaslidesBankofamericaslides
Bankofamericaslides
 
omnicom group Q2 2005 Investor Presentation
omnicom group  Q2 2005 Investor Presentationomnicom group  Q2 2005 Investor Presentation
omnicom group Q2 2005 Investor Presentation
 
Fourth Quarter 2008 Earnings Presentation
	Fourth Quarter 2008 Earnings Presentation	Fourth Quarter 2008 Earnings Presentation
Fourth Quarter 2008 Earnings Presentation
 
1 Q09 Investor Presentation
1 Q09 Investor Presentation1 Q09 Investor Presentation
1 Q09 Investor Presentation
 
progressive mreport-10/05
progressive mreport-10/05progressive mreport-10/05
progressive mreport-10/05
 
Fourth Quarter 2010 Earnings Report
Fourth Quarter 2010 Earnings ReportFourth Quarter 2010 Earnings Report
Fourth Quarter 2010 Earnings Report
 
unum group StatSupp_Q405
unum group StatSupp_Q405unum group StatSupp_Q405
unum group StatSupp_Q405
 
progressive mreport-12/05
progressive mreport-12/05progressive mreport-12/05
progressive mreport-12/05
 
Q3 2009 Earning Report of Bank of America Corporation
Q3 2009 Earning Report of Bank of America CorporationQ3 2009 Earning Report of Bank of America Corporation
Q3 2009 Earning Report of Bank of America Corporation
 
RYDERFINAL R2Q05
RYDERFINAL R2Q05RYDERFINAL R2Q05
RYDERFINAL R2Q05
 
RYDERFINAL R2Q05
RYDERFINAL R2Q05RYDERFINAL R2Q05
RYDERFINAL R2Q05
 
Ryder System, Inc. 3Q 2011 Earnings
Ryder System, Inc. 3Q 2011 EarningsRyder System, Inc. 3Q 2011 Earnings
Ryder System, Inc. 3Q 2011 Earnings
 
progressive mreport-04/05
progressive mreport-04/05progressive mreport-04/05
progressive mreport-04/05
 
progressive mreport-04/05
progressive mreport-04/05progressive mreport-04/05
progressive mreport-04/05
 
raytheon Q4 Earnings Presentation
raytheon Q4 Earnings Presentationraytheon Q4 Earnings Presentation
raytheon Q4 Earnings Presentation
 
3m Presentation 2006 1st
3m Presentation 2006 1st3m Presentation 2006 1st
3m Presentation 2006 1st
 
progressive mreport-06/05
progressive mreport-06/05progressive mreport-06/05
progressive mreport-06/05
 
omnicom group Q1 2005 Investor Presentation
omnicom group  Q1 2005 Investor Presentationomnicom group  Q1 2005 Investor Presentation
omnicom group Q1 2005 Investor Presentation
 

More from QuarterlyEarningsReports3

Innovating Through Recession by Andrew Razeghi of Kellog School of Management
Innovating Through Recession by Andrew Razeghi of Kellog School of ManagementInnovating Through Recession by Andrew Razeghi of Kellog School of Management
Innovating Through Recession by Andrew Razeghi of Kellog School of ManagementQuarterlyEarningsReports3
 
Skive Magazine Quarterly - Issue 10, December 2008
Skive Magazine Quarterly - Issue 10, December 2008Skive Magazine Quarterly - Issue 10, December 2008
Skive Magazine Quarterly - Issue 10, December 2008QuarterlyEarningsReports3
 

More from QuarterlyEarningsReports3 (20)

Heavenly Dishes cookbook
Heavenly Dishes cookbookHeavenly Dishes cookbook
Heavenly Dishes cookbook
 
Innovating Through Recession by Andrew Razeghi of Kellog School of Management
Innovating Through Recession by Andrew Razeghi of Kellog School of ManagementInnovating Through Recession by Andrew Razeghi of Kellog School of Management
Innovating Through Recession by Andrew Razeghi of Kellog School of Management
 
Lehman Brothers Annual Report 2007
Lehman Brothers Annual Report 2007Lehman Brothers Annual Report 2007
Lehman Brothers Annual Report 2007
 
Bear Stearns Annual Report 2006
Bear Stearns Annual Report 2006Bear Stearns Annual Report 2006
Bear Stearns Annual Report 2006
 
AIG Annual Report 2007
AIG Annual Report 2007AIG Annual Report 2007
AIG Annual Report 2007
 
Milken Institute - Mortgage Crisis Overview
Milken Institute - Mortgage Crisis OverviewMilken Institute - Mortgage Crisis Overview
Milken Institute - Mortgage Crisis Overview
 
Fannie Mae Annual Report 2007
Fannie Mae Annual Report 2007Fannie Mae Annual Report 2007
Fannie Mae Annual Report 2007
 
Freddie Mac Annual Report 2007
Freddie Mac Annual Report 2007Freddie Mac Annual Report 2007
Freddie Mac Annual Report 2007
 
Merrill Lynch Annual Report 2007
Merrill Lynch Annual Report 2007Merrill Lynch Annual Report 2007
Merrill Lynch Annual Report 2007
 
Financial Development Report 2008
Financial Development Report 2008Financial Development Report 2008
Financial Development Report 2008
 
Fannie Mae Annual Report 2007
Fannie Mae Annual Report 2007Fannie Mae Annual Report 2007
Fannie Mae Annual Report 2007
 
Skive Magazine Quarterly - Issue 10, December 2008
Skive Magazine Quarterly - Issue 10, December 2008Skive Magazine Quarterly - Issue 10, December 2008
Skive Magazine Quarterly - Issue 10, December 2008
 
Global Risks Report 2009
Global Risks Report 2009Global Risks Report 2009
Global Risks Report 2009
 
Moneytree Analyst Call Q408
Moneytree Analyst Call Q408Moneytree Analyst Call Q408
Moneytree Analyst Call Q408
 
hp 2002 Transcript
hp 2002 Transcripthp 2002 Transcript
hp 2002 Transcript
 
hp 2006 Presentation
hp 2006 Presentationhp 2006 Presentation
hp 2006 Presentation
 
hp 2004 /2003Financial Overview
hp 2004 /2003Financial Overviewhp 2004 /2003Financial Overview
hp 2004 /2003Financial Overview
 
hp 2005 Financial Overview
hp 2005 Financial Overviewhp 2005 Financial Overview
hp 2005 Financial Overview
 
hp 2006 Financial Overview
hp 2006 Financial Overviewhp 2006 Financial Overview
hp 2006 Financial Overview
 
hp Documentation Compaq 2000 annual report
hp Documentation 	Compaq 2000 annual reporthp Documentation 	Compaq 2000 annual report
hp Documentation Compaq 2000 annual report
 

Recently uploaded

Call Girls in DELHI Cantt, ( Call Me )-8377877756-Female Escort- In Delhi / Ncr
Call Girls in DELHI Cantt, ( Call Me )-8377877756-Female Escort- In Delhi / NcrCall Girls in DELHI Cantt, ( Call Me )-8377877756-Female Escort- In Delhi / Ncr
Call Girls in DELHI Cantt, ( Call Me )-8377877756-Female Escort- In Delhi / Ncrdollysharma2066
 
Islamabad Escorts | Call 03274100048 | Escort Service in Islamabad
Islamabad Escorts | Call 03274100048 | Escort Service in IslamabadIslamabad Escorts | Call 03274100048 | Escort Service in Islamabad
Islamabad Escorts | Call 03274100048 | Escort Service in IslamabadAyesha Khan
 
Market Sizes Sample Report - 2024 Edition
Market Sizes Sample Report - 2024 EditionMarket Sizes Sample Report - 2024 Edition
Market Sizes Sample Report - 2024 EditionMintel Group
 
Kenya’s Coconut Value Chain by Gatsby Africa
Kenya’s Coconut Value Chain by Gatsby AfricaKenya’s Coconut Value Chain by Gatsby Africa
Kenya’s Coconut Value Chain by Gatsby Africaictsugar
 
8447779800, Low rate Call girls in Saket Delhi NCR
8447779800, Low rate Call girls in Saket Delhi NCR8447779800, Low rate Call girls in Saket Delhi NCR
8447779800, Low rate Call girls in Saket Delhi NCRashishs7044
 
(Best) ENJOY Call Girls in Faridabad Ex | 8377087607
(Best) ENJOY Call Girls in Faridabad Ex | 8377087607(Best) ENJOY Call Girls in Faridabad Ex | 8377087607
(Best) ENJOY Call Girls in Faridabad Ex | 8377087607dollysharma2066
 
Annual General Meeting Presentation Slides
Annual General Meeting Presentation SlidesAnnual General Meeting Presentation Slides
Annual General Meeting Presentation SlidesKeppelCorporation
 
Intro to BCG's Carbon Emissions Benchmark_vF.pdf
Intro to BCG's Carbon Emissions Benchmark_vF.pdfIntro to BCG's Carbon Emissions Benchmark_vF.pdf
Intro to BCG's Carbon Emissions Benchmark_vF.pdfpollardmorgan
 
Keppel Ltd. 1Q 2024 Business Update Presentation Slides
Keppel Ltd. 1Q 2024 Business Update  Presentation SlidesKeppel Ltd. 1Q 2024 Business Update  Presentation Slides
Keppel Ltd. 1Q 2024 Business Update Presentation SlidesKeppelCorporation
 
Lean: From Theory to Practice — One City’s (and Library’s) Lean Story… Abridged
Lean: From Theory to Practice — One City’s (and Library’s) Lean Story… AbridgedLean: From Theory to Practice — One City’s (and Library’s) Lean Story… Abridged
Lean: From Theory to Practice — One City’s (and Library’s) Lean Story… AbridgedKaiNexus
 
Global Scenario On Sustainable and Resilient Coconut Industry by Dr. Jelfina...
Global Scenario On Sustainable  and Resilient Coconut Industry by Dr. Jelfina...Global Scenario On Sustainable  and Resilient Coconut Industry by Dr. Jelfina...
Global Scenario On Sustainable and Resilient Coconut Industry by Dr. Jelfina...ictsugar
 
The CMO Survey - Highlights and Insights Report - Spring 2024
The CMO Survey - Highlights and Insights Report - Spring 2024The CMO Survey - Highlights and Insights Report - Spring 2024
The CMO Survey - Highlights and Insights Report - Spring 2024christinemoorman
 
Call Girls In Connaught Place Delhi ❤️88604**77959_Russian 100% Genuine Escor...
Call Girls In Connaught Place Delhi ❤️88604**77959_Russian 100% Genuine Escor...Call Girls In Connaught Place Delhi ❤️88604**77959_Russian 100% Genuine Escor...
Call Girls In Connaught Place Delhi ❤️88604**77959_Russian 100% Genuine Escor...lizamodels9
 
NewBase 19 April 2024 Energy News issue - 1717 by Khaled Al Awadi.pdf
NewBase  19 April  2024  Energy News issue - 1717 by Khaled Al Awadi.pdfNewBase  19 April  2024  Energy News issue - 1717 by Khaled Al Awadi.pdf
NewBase 19 April 2024 Energy News issue - 1717 by Khaled Al Awadi.pdfKhaled Al Awadi
 
Call Us 📲8800102216📞 Call Girls In DLF City Gurgaon
Call Us 📲8800102216📞 Call Girls In DLF City GurgaonCall Us 📲8800102216📞 Call Girls In DLF City Gurgaon
Call Us 📲8800102216📞 Call Girls In DLF City Gurgaoncallgirls2057
 
Vip Female Escorts Noida 9711199171 Greater Noida Escorts Service
Vip Female Escorts Noida 9711199171 Greater Noida Escorts ServiceVip Female Escorts Noida 9711199171 Greater Noida Escorts Service
Vip Female Escorts Noida 9711199171 Greater Noida Escorts Serviceankitnayak356677
 
Call Girls Miyapur 7001305949 all area service COD available Any Time
Call Girls Miyapur 7001305949 all area service COD available Any TimeCall Girls Miyapur 7001305949 all area service COD available Any Time
Call Girls Miyapur 7001305949 all area service COD available Any Timedelhimodelshub1
 
8447779800, Low rate Call girls in Shivaji Enclave Delhi NCR
8447779800, Low rate Call girls in Shivaji Enclave Delhi NCR8447779800, Low rate Call girls in Shivaji Enclave Delhi NCR
8447779800, Low rate Call girls in Shivaji Enclave Delhi NCRashishs7044
 
8447779800, Low rate Call girls in Kotla Mubarakpur Delhi NCR
8447779800, Low rate Call girls in Kotla Mubarakpur Delhi NCR8447779800, Low rate Call girls in Kotla Mubarakpur Delhi NCR
8447779800, Low rate Call girls in Kotla Mubarakpur Delhi NCRashishs7044
 
Cash Payment 9602870969 Escort Service in Udaipur Call Girls
Cash Payment 9602870969 Escort Service in Udaipur Call GirlsCash Payment 9602870969 Escort Service in Udaipur Call Girls
Cash Payment 9602870969 Escort Service in Udaipur Call GirlsApsara Of India
 

Recently uploaded (20)

Call Girls in DELHI Cantt, ( Call Me )-8377877756-Female Escort- In Delhi / Ncr
Call Girls in DELHI Cantt, ( Call Me )-8377877756-Female Escort- In Delhi / NcrCall Girls in DELHI Cantt, ( Call Me )-8377877756-Female Escort- In Delhi / Ncr
Call Girls in DELHI Cantt, ( Call Me )-8377877756-Female Escort- In Delhi / Ncr
 
Islamabad Escorts | Call 03274100048 | Escort Service in Islamabad
Islamabad Escorts | Call 03274100048 | Escort Service in IslamabadIslamabad Escorts | Call 03274100048 | Escort Service in Islamabad
Islamabad Escorts | Call 03274100048 | Escort Service in Islamabad
 
Market Sizes Sample Report - 2024 Edition
Market Sizes Sample Report - 2024 EditionMarket Sizes Sample Report - 2024 Edition
Market Sizes Sample Report - 2024 Edition
 
Kenya’s Coconut Value Chain by Gatsby Africa
Kenya’s Coconut Value Chain by Gatsby AfricaKenya’s Coconut Value Chain by Gatsby Africa
Kenya’s Coconut Value Chain by Gatsby Africa
 
8447779800, Low rate Call girls in Saket Delhi NCR
8447779800, Low rate Call girls in Saket Delhi NCR8447779800, Low rate Call girls in Saket Delhi NCR
8447779800, Low rate Call girls in Saket Delhi NCR
 
(Best) ENJOY Call Girls in Faridabad Ex | 8377087607
(Best) ENJOY Call Girls in Faridabad Ex | 8377087607(Best) ENJOY Call Girls in Faridabad Ex | 8377087607
(Best) ENJOY Call Girls in Faridabad Ex | 8377087607
 
Annual General Meeting Presentation Slides
Annual General Meeting Presentation SlidesAnnual General Meeting Presentation Slides
Annual General Meeting Presentation Slides
 
Intro to BCG's Carbon Emissions Benchmark_vF.pdf
Intro to BCG's Carbon Emissions Benchmark_vF.pdfIntro to BCG's Carbon Emissions Benchmark_vF.pdf
Intro to BCG's Carbon Emissions Benchmark_vF.pdf
 
Keppel Ltd. 1Q 2024 Business Update Presentation Slides
Keppel Ltd. 1Q 2024 Business Update  Presentation SlidesKeppel Ltd. 1Q 2024 Business Update  Presentation Slides
Keppel Ltd. 1Q 2024 Business Update Presentation Slides
 
Lean: From Theory to Practice — One City’s (and Library’s) Lean Story… Abridged
Lean: From Theory to Practice — One City’s (and Library’s) Lean Story… AbridgedLean: From Theory to Practice — One City’s (and Library’s) Lean Story… Abridged
Lean: From Theory to Practice — One City’s (and Library’s) Lean Story… Abridged
 
Global Scenario On Sustainable and Resilient Coconut Industry by Dr. Jelfina...
Global Scenario On Sustainable  and Resilient Coconut Industry by Dr. Jelfina...Global Scenario On Sustainable  and Resilient Coconut Industry by Dr. Jelfina...
Global Scenario On Sustainable and Resilient Coconut Industry by Dr. Jelfina...
 
The CMO Survey - Highlights and Insights Report - Spring 2024
The CMO Survey - Highlights and Insights Report - Spring 2024The CMO Survey - Highlights and Insights Report - Spring 2024
The CMO Survey - Highlights and Insights Report - Spring 2024
 
Call Girls In Connaught Place Delhi ❤️88604**77959_Russian 100% Genuine Escor...
Call Girls In Connaught Place Delhi ❤️88604**77959_Russian 100% Genuine Escor...Call Girls In Connaught Place Delhi ❤️88604**77959_Russian 100% Genuine Escor...
Call Girls In Connaught Place Delhi ❤️88604**77959_Russian 100% Genuine Escor...
 
NewBase 19 April 2024 Energy News issue - 1717 by Khaled Al Awadi.pdf
NewBase  19 April  2024  Energy News issue - 1717 by Khaled Al Awadi.pdfNewBase  19 April  2024  Energy News issue - 1717 by Khaled Al Awadi.pdf
NewBase 19 April 2024 Energy News issue - 1717 by Khaled Al Awadi.pdf
 
Call Us 📲8800102216📞 Call Girls In DLF City Gurgaon
Call Us 📲8800102216📞 Call Girls In DLF City GurgaonCall Us 📲8800102216📞 Call Girls In DLF City Gurgaon
Call Us 📲8800102216📞 Call Girls In DLF City Gurgaon
 
Vip Female Escorts Noida 9711199171 Greater Noida Escorts Service
Vip Female Escorts Noida 9711199171 Greater Noida Escorts ServiceVip Female Escorts Noida 9711199171 Greater Noida Escorts Service
Vip Female Escorts Noida 9711199171 Greater Noida Escorts Service
 
Call Girls Miyapur 7001305949 all area service COD available Any Time
Call Girls Miyapur 7001305949 all area service COD available Any TimeCall Girls Miyapur 7001305949 all area service COD available Any Time
Call Girls Miyapur 7001305949 all area service COD available Any Time
 
8447779800, Low rate Call girls in Shivaji Enclave Delhi NCR
8447779800, Low rate Call girls in Shivaji Enclave Delhi NCR8447779800, Low rate Call girls in Shivaji Enclave Delhi NCR
8447779800, Low rate Call girls in Shivaji Enclave Delhi NCR
 
8447779800, Low rate Call girls in Kotla Mubarakpur Delhi NCR
8447779800, Low rate Call girls in Kotla Mubarakpur Delhi NCR8447779800, Low rate Call girls in Kotla Mubarakpur Delhi NCR
8447779800, Low rate Call girls in Kotla Mubarakpur Delhi NCR
 
Cash Payment 9602870969 Escort Service in Udaipur Call Girls
Cash Payment 9602870969 Escort Service in Udaipur Call GirlsCash Payment 9602870969 Escort Service in Udaipur Call Girls
Cash Payment 9602870969 Escort Service in Udaipur Call Girls
 

Citigroup 2007 Financial Services Conference

  • 1. Bank of America Opportunities For Growth Ken Lewis Chairman, President and Chief Executive Officer Citigroup Financial Services Conference January 31, 2007
  • 2. Forward Looking Statements This presentation contains forward-looking statements, including statements about the financial conditions, results of operations and earnings outlook of Bank of America Corporation. The forward- looking statements involve certain risks and uncertainties. Factors that may cause actual results or earnings to differ materially from such forward-looking statements include, among others, the following: 1) projected business increases following process changes and other investments are lower than expected; 2) competitive pressure among financial services companies increases significantly; 3) general economic conditions are less favorable than expected; 4) political conditions including the threat of future terrorist activity and related actions by the United States abroad may adversely affect the company’s businesses and economic conditions as a whole; 5) changes in the interest rate environment reduce interest margins and impact funding sources; 6) changes in foreign exchange rates increases exposure; 7) changes in market rates and prices may adversely impact the value of financial products; 8) legislation or regulatory environments, requirements or changes adversely affect the businesses in which the company is engaged; 9) changes in accounting standards, rules or interpretations, 10) litigation liabilities, including costs, expenses, settlements and judgments, may adversely affect the company or its businesses; 11) mergers and acquisitions and their integration into the company; and 12) decisions to downsize, sell or close units or otherwise change the business mix of any of the company. For further information regarding Bank of America Corporation, please read the Bank of America reports filed with the SEC and available at www.sec.gov. 2
  • 3. Summary Earnings Statement – Annual Comparison ($ in millions) Proforma 1 GAAP 2006 2005 % Change 2005 Core net interest income (FTE) $ 34,164 $ 32,925 4% $ 29,631 Market-based net interest income 1,651 1,938 1,938 Net interest income (FTE) 35,815 34,863 3% 31,569 Noninterest income 38,432 32,647 18 % 25,354 Total revenue (FTE) 74,247 67,510 10 % 56,923 Provision for credit losses 5,010 5,082 (1 %) 4,014 Gains (losses) on sales of debt securities (443) 1,084 NM 1,084 Noninterest expense (excl merger charges) 34,792 34,411 1% 28,269 Merger charge 805 1,179 412 Noninterest expense 35,597 35,590 28,681 Pre-tax income 33,197 27,922 25,312 Income tax expense 12,064 9,765 8,847 Net income 21,133 18,157 16 % 16,465 Merger & restructuring charges (after-tax) 507 771 275 Net Income before merger charges $ 21,640 $ 18,928 14 % $ 16,740 Diluted EPS reported $ 4.59 $ 4.04 Merger charge impact .11 .07 Diluted EPS (excl. merger charge) 4.70 4.11 Impact of intangibles amortization .24 .13 1 Proforma results include MBNA 3
  • 4. 2006 Business Results ($ in millions) REVENUE (FTE) EARNINGS Change vs. Proforma1 2005 Change vs. Proforma1 2005 2006 Amt. % Change 2006 Amt. % Change Global Consumer $ 41,691 $ 2,844 7% $ 11,171 $ 1,785 19 % & Small Business Global Corporate & 22,691 1,992 10 % 6,792 358 6% Investment Bank Global Wealth & 7,779 410 6% 2,403 55 2% Investment Mgmt All Other 2,086 1,491 NM 767 778 NM Total $ 74,247 $ 6,737 10 % $ 21,133 $ 2,976 16 % 1 Proforma results include MBNA 4
  • 5. Short-term Outlook • Continuing flat yield curve environment • Expect GDP growth around 3% • Core net interest income growth in low single digits • Reduced equity investment gains • Credit costs continue to season and normalize • Positive operating leverage 5
  • 6. Achieving Growth in a Challenging Environment Proforma highlights on a Diluted EPS excluding merger managed basis 1 and restructuring charges 2 2005 2006 Revenue growth (FTE) 5% 7% Net interest income (FTE) 1% 1% Noninterest income 12 % 16 % $4.70 $4.11 $3.75 Expense growth: - 1% (excl. merger charges) Credit costs 12 % (16 %) 2004 2005 2006 Securities gains/(losses) (39 %) NM Achieved While Completing 2 of Industry’s Largest Acquisitions 1 Managed basis treats securitized loan receivables as if they were still on the balance sheet and presents the earnings on the sold loan receivables as if they were not sold. Managed Noninterest Income includes the impact of the gains recognized on securitized loan principal receivables in accordance with SFAS No. 140. 2 Excludes merger and restructuring charges of $.11, $.07 and $.11 6 in 2004, 2005 and 2006, respectively
  • 7. Consistent Attractive Earnings Growth Diluted EPS $4.70 ow th $4.11 nd Gr pou C om $3.75 11% $3.55 $3.05 $2.55 $2.88 2000 2001 2002 2003 2004 2005 2006 2000 - $2.26 reported EPS has been adjusted to exclude $.10 impact of restructuring charges as well as $.19 goodwill amortization expense eliminated in 2002 for comparability to other periods. 2001 - $2.30 reported EPS has been adjusted to exclude $.39 impact of business exit costs as well as $.19 goodwill amortization expense eliminated in 2002 for comparability to other periods. 2004 - $3.64 reported EPS has been adjusted $. 11 to exclude charges for merger and restructuring costs. 2005 - $4.04 reported EPShas been adjusted $.07 to excludes charges for merger and restructuring costs 2006 - $4.59 reported EPShas been adjusted $.11 to excludes charges for merger and restructuring costs 7
  • 8. Operating Leverage Provides Good Returns Compound Annual Growth Rates $20.00 On a per share basis $15.89 Revenue 8% $15.00 $9.89 $10.00 $7.57 $5.24 Expense 6% $5.00 $4.70 Earnings 11% $2.55 $0.00 2000 2001 2002 2003 2004 2005 2006 Revenue per share Expense per share Earnings per share Based on originally reported results on a per share basis excluding goodwill amortization expense in 2000 and 2001 and merger and restructuring charges in all periods 8
  • 9. Effectively Managing Costs Efficiency Ratio 55% 54% 53% 53% 52% 49% 47% 2000 2001 2002 2003 2004 2005 2006 Excludes merger & restructuring charges 9
  • 10. Making Good Capital Decisions Capital Investment Primary Advantage • Santander Serfin Enhance multicultural strategy • National Processing Gain scale in merchant services business • China Construction Bank Tap into tremendous growth of Chinese economy • Fleet Complete national franchise and entry into NE wealth markets • MBNA Become premier payments provider and leverage products and distribution 10
  • 11. Providing Good Returns Bank of America 15% JP Morgan US Bancorp 13% KBW Bank Wachovia 12% S & P 500 Index Wells Fargo 11% 10% 10% 10% Citigroup Dow 9% 8% Total Annualized Shareholder Return From 12/31/03 Bank of America 20% Wachovia 16% US Bancorp KBW Bank 12% Index Wells Fargo 8% Citigroup Dow 7% JP Morgan 6% S & P 500 5% 5% 3% Total Annualized Shareholder Return From 12/31/00 11
  • 12. 29 Consecutive Years of Dividend Increases $2.12 Dividend Yield 4.30% wth ed gr o z uali ann 13% 1977 2006 Yield based on annualized dividend and price as of 1/26/07 12
  • 13. Aggressively Managing Excess Capital $ in millions • Including net share repurchases and dividends, returned more than $80 billion in capital since 1998 $80,237 • Since 1998, net share repurchases plus dividends have averaged 80% of net income. $44,626 $35,611 Repurchases Dividends 1998 1999 2000 2001 2002 2003 2004 2005 2006 Cumulative Capital returned as % 58 % 88 % 84 % 96 % 89 % 91 % 63 % 63 % 91 % 80 % of earnings Tier 1 Tier 1 7.06% 8.64% 13
  • 14. Bank of America Differentiating Factors Ubiquitous franchise • Vast customer base • Unparalleled customer convenience • Market and product leadership positions • Information and innovation Demonstrated ability to execute • Leverage franchise capabilities • Provide innovative customer solutions • Superior integration expertise Opportunities for continued organic growth • Retail banking penetration • Capturing the wealth opportunity • Commercial banking client expansion 14
  • 15. 15