This document discusses several theories of stock market fluctuations:
1) The efficient market hypothesis which states prices reflect all known information and movements are due to new information.
2) The random walk hypothesis which claims fluctuations are totally random and unpredictable.
3) Behavioral economics perspectives which emphasize the role of human psychology in driving mass movements.
It also examines the work of Fama on market efficiency forms, Malkiel's refutation of fundamental and technical analysis, and Taleb's criticisms of attempts to explain movements with structured models. The document aims to statistically test and potentially refute these theories of market predictability.
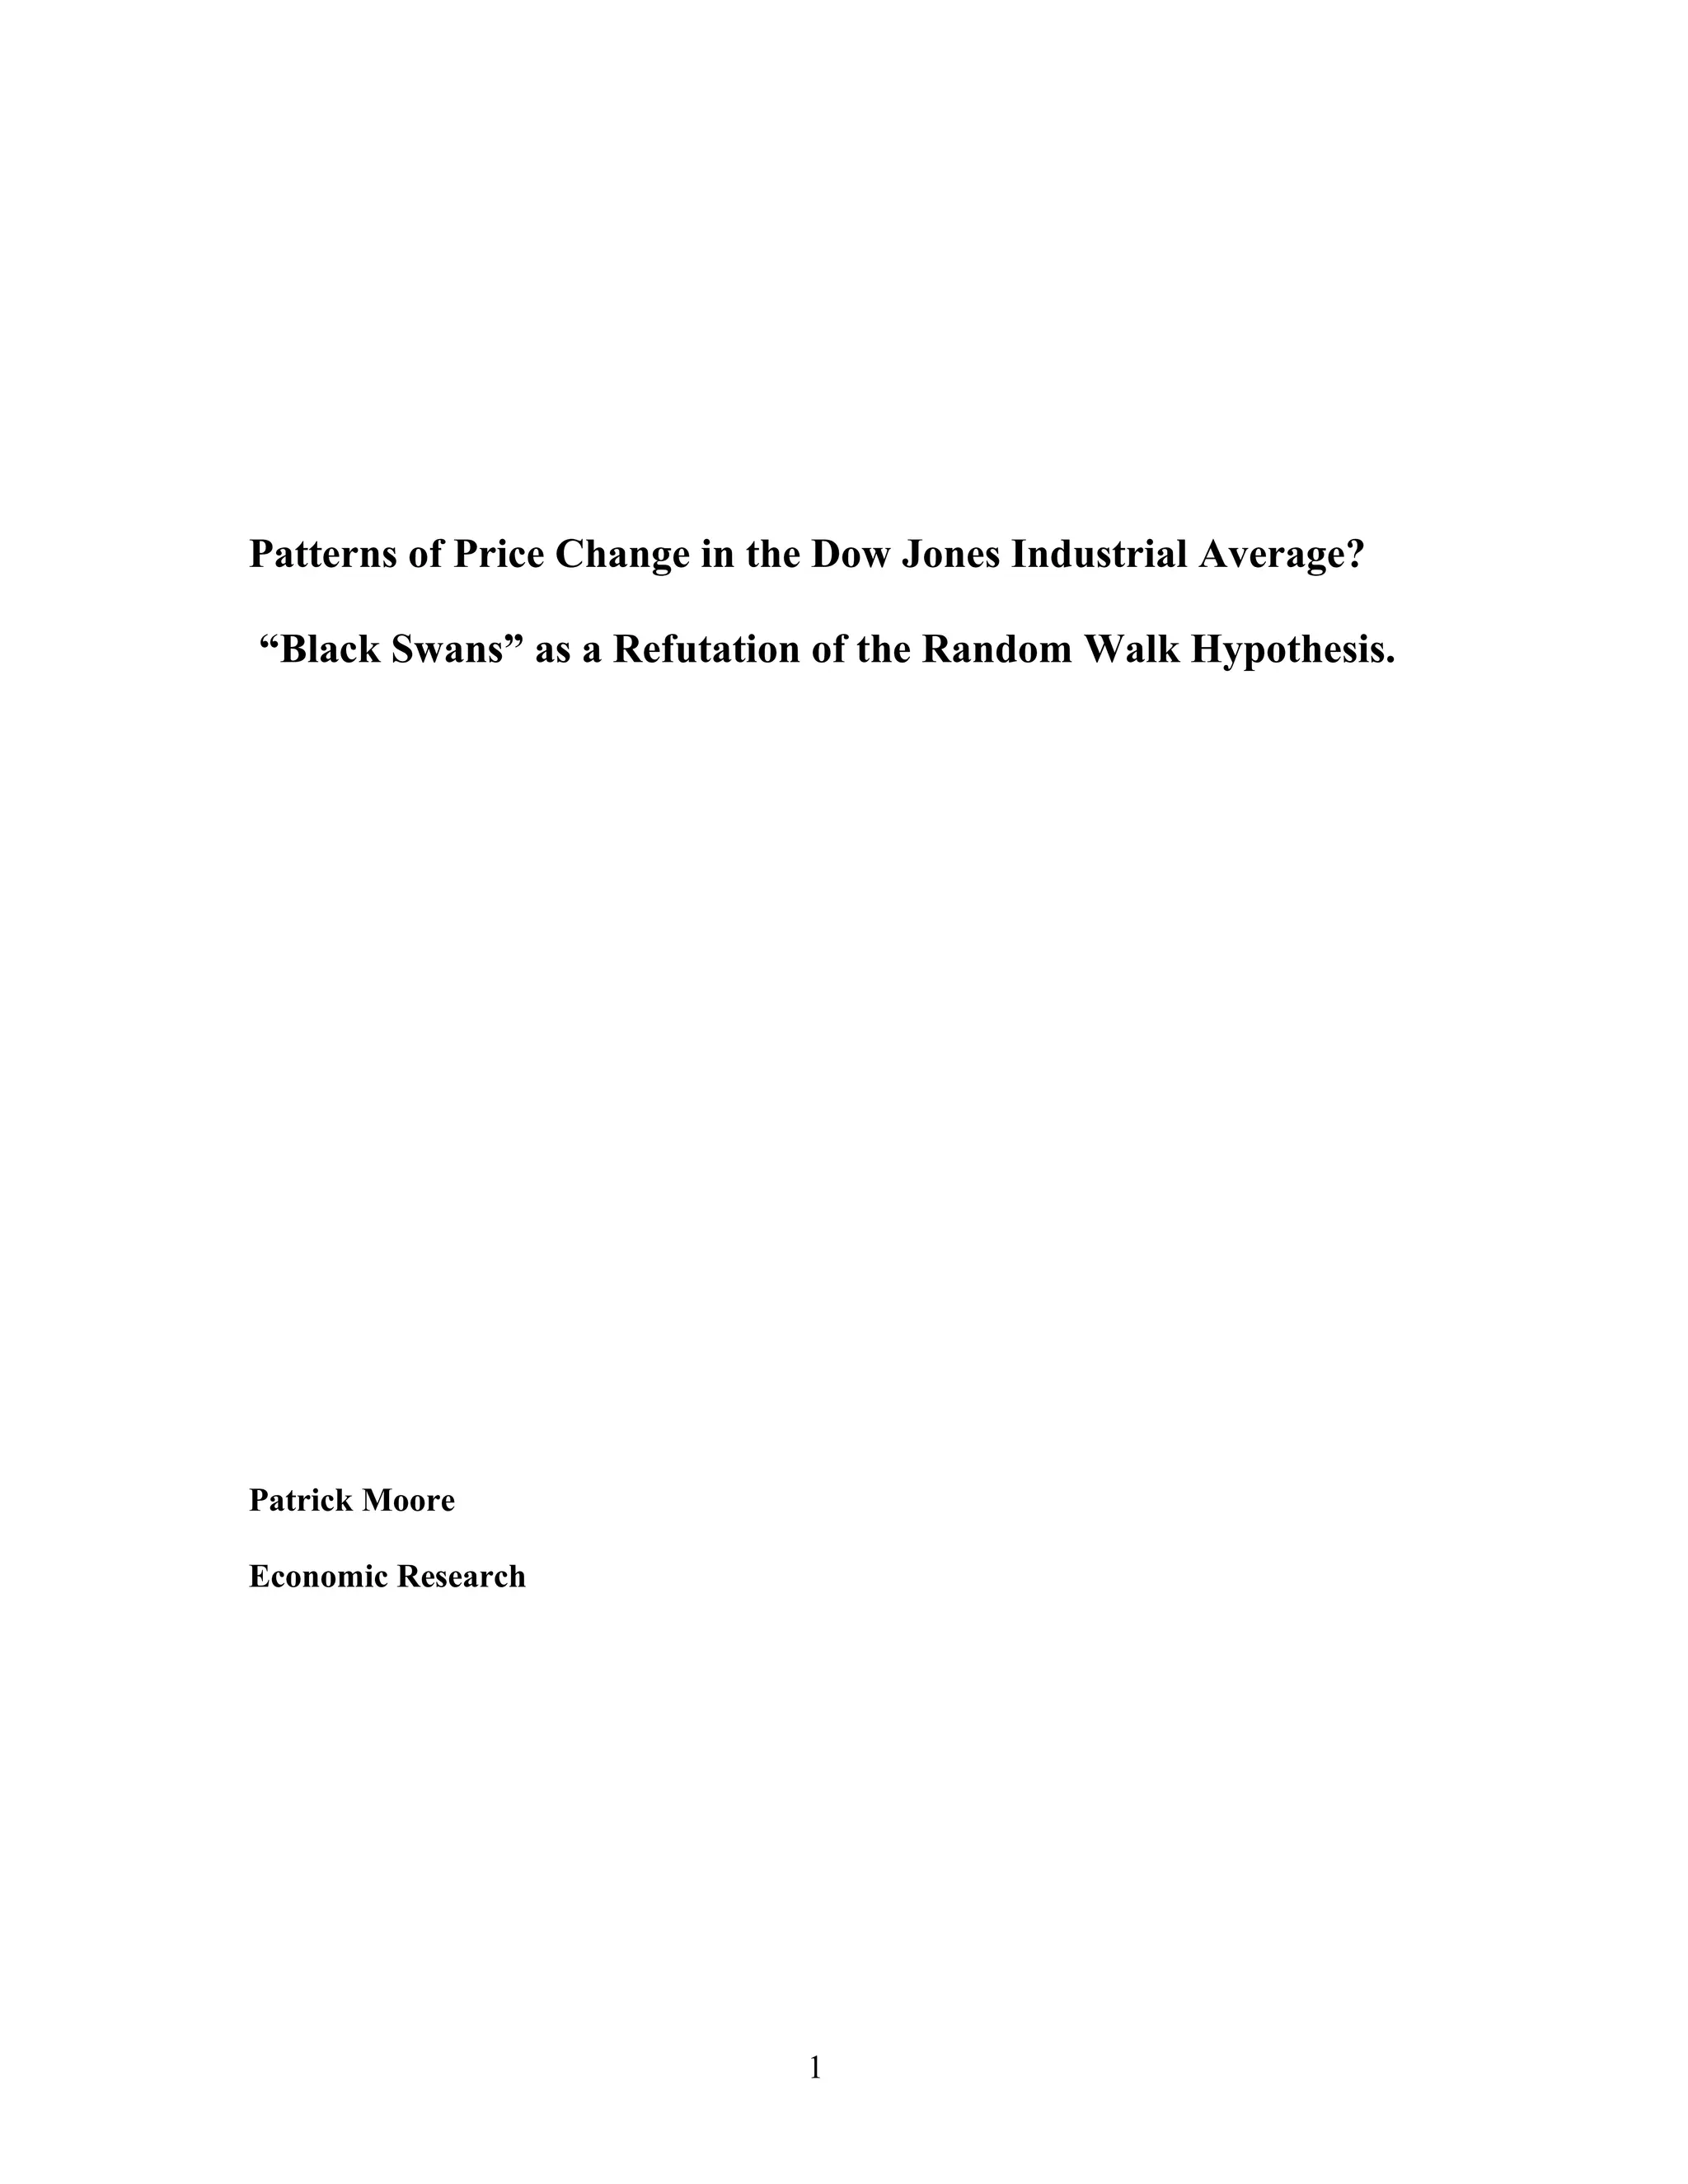


![3 1.1068585E11 3.6895284E10 8061852.2560413 <.0001
7016 32108913.1018989 4576.5269530
7019 1.1071796E11
DF Sum of Squares Mean Square F-Value P-Value
Regression
Residual
Total
ANOVA Table
Price vs. 3 Independents
7020
4
.9998550
.9997100
.9997099
67.6500329
Count
Num. Missing
R
R Squared
Adjusted R Squared
RMS Residual
Regression Summary
Price vs. 3 Independents
1.5625101 1.3646751 1.5625101 1.1449686 .2523
1.0000201 .0002038 .9997947 4906.6283393 <.0001
.0126629 .0030698 .0016132 4.1250226 <.0001
-41.1891952 20.6173606 -.0007807 -1.9977919 .0458
Coefficient Std. Error Std. Coeff. t-Value P-Value
Intercept
Pricet-1
BlackPast
BlackL1
Regression Coefficients
Price vs. 3 Independents
3468
3552
64002230.911805
1.993286
.003081
# >= 0
# < 0
SS[e(i) - e(i-1)]
Durbin-Watson
Serial Autocorrelation
Residual Statistics
Price vs. 3 Independents
12](https://image.slidesharecdn.com/516d36ca-3908-4361-bcb0-ae44158f820a-160313014736/75/thesisdone-12-2048.jpg)


![[2 Session] TA controversis, Indicator, divergence, 9 rule for Divergence [29...](https://cdn.slidesharecdn.com/ss_thumbnails/4925acdd-c978-4683-b19c-f158d103b5f8-150325005159-conversion-gate01-thumbnail.jpg?width=640&height=640&fit=bounds)


