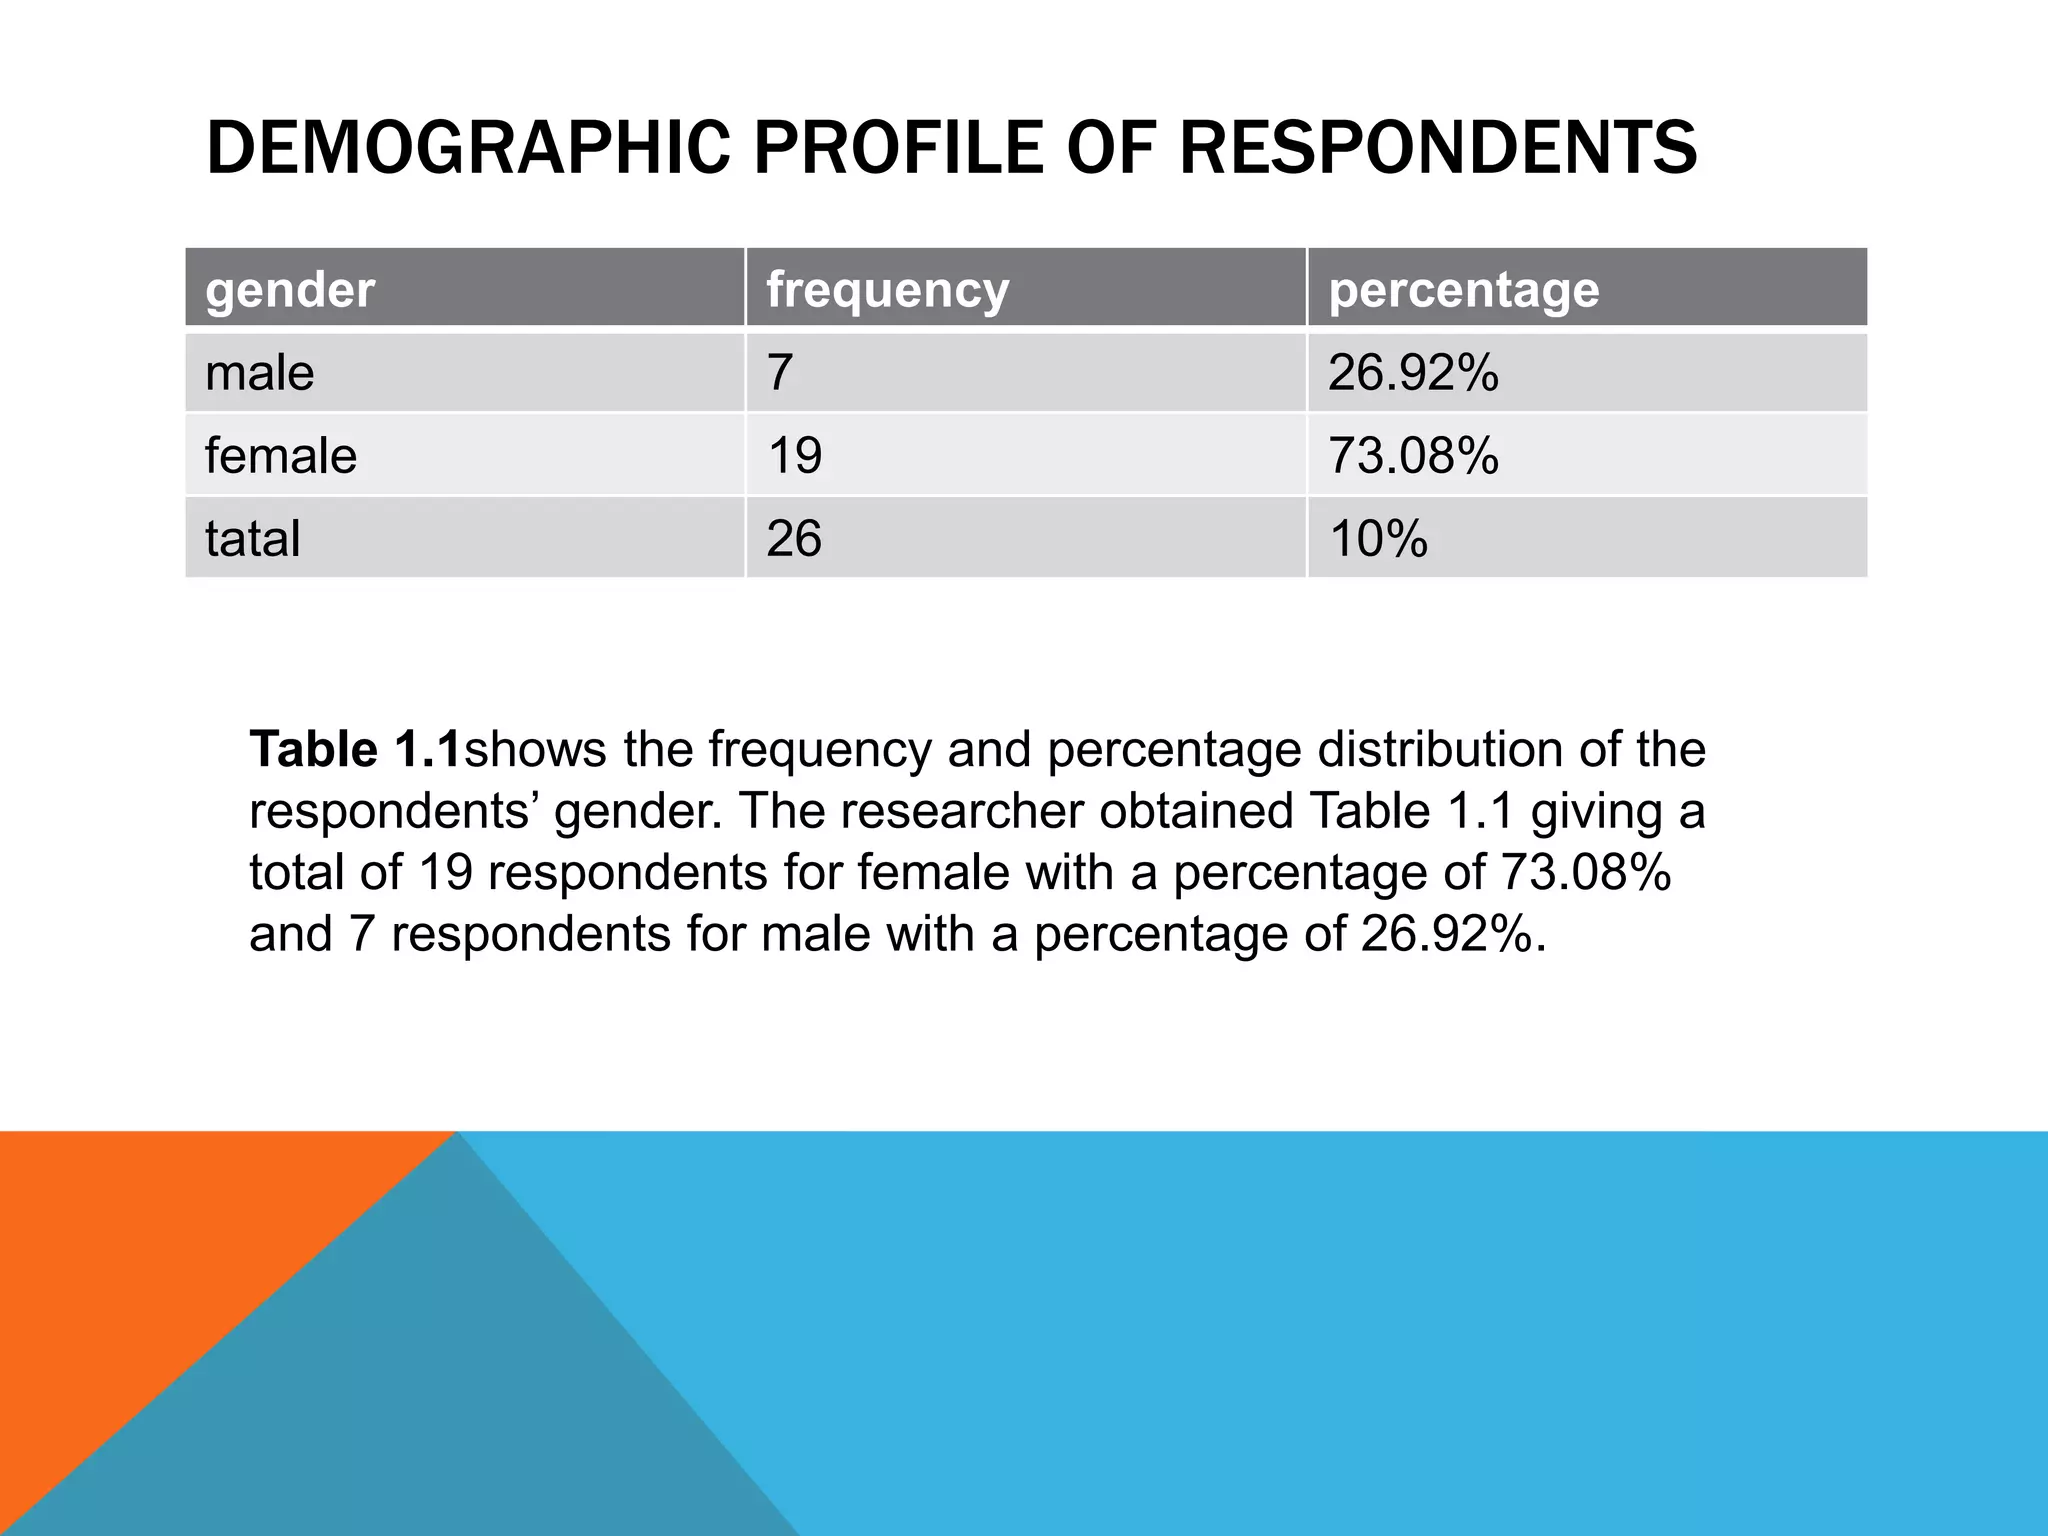
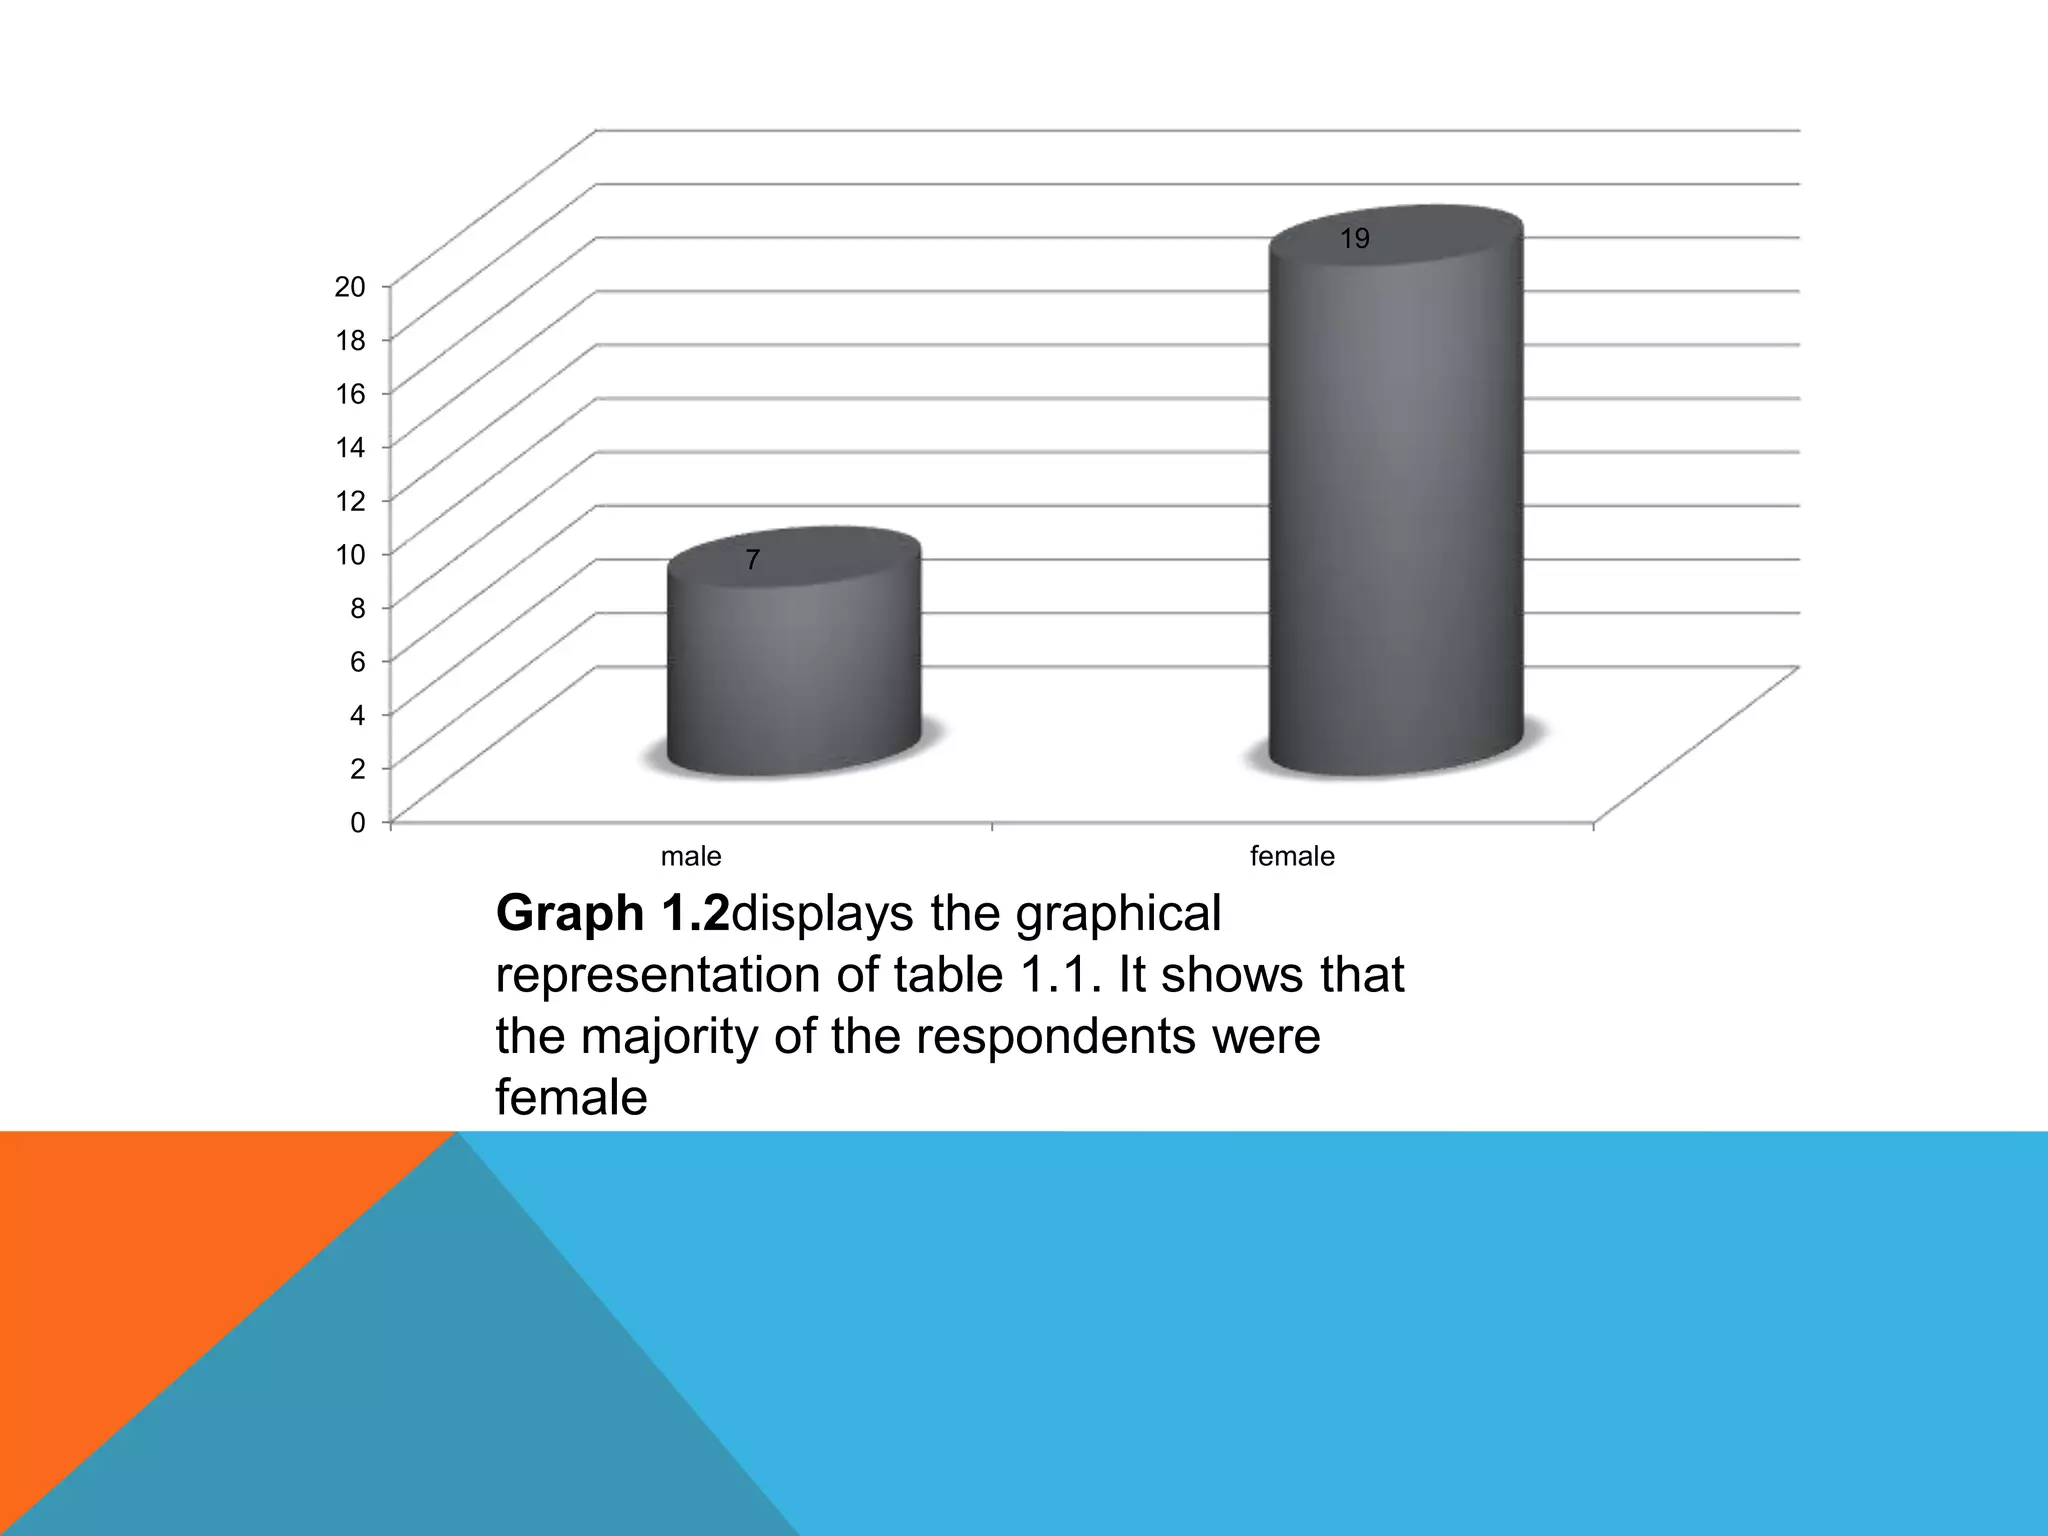
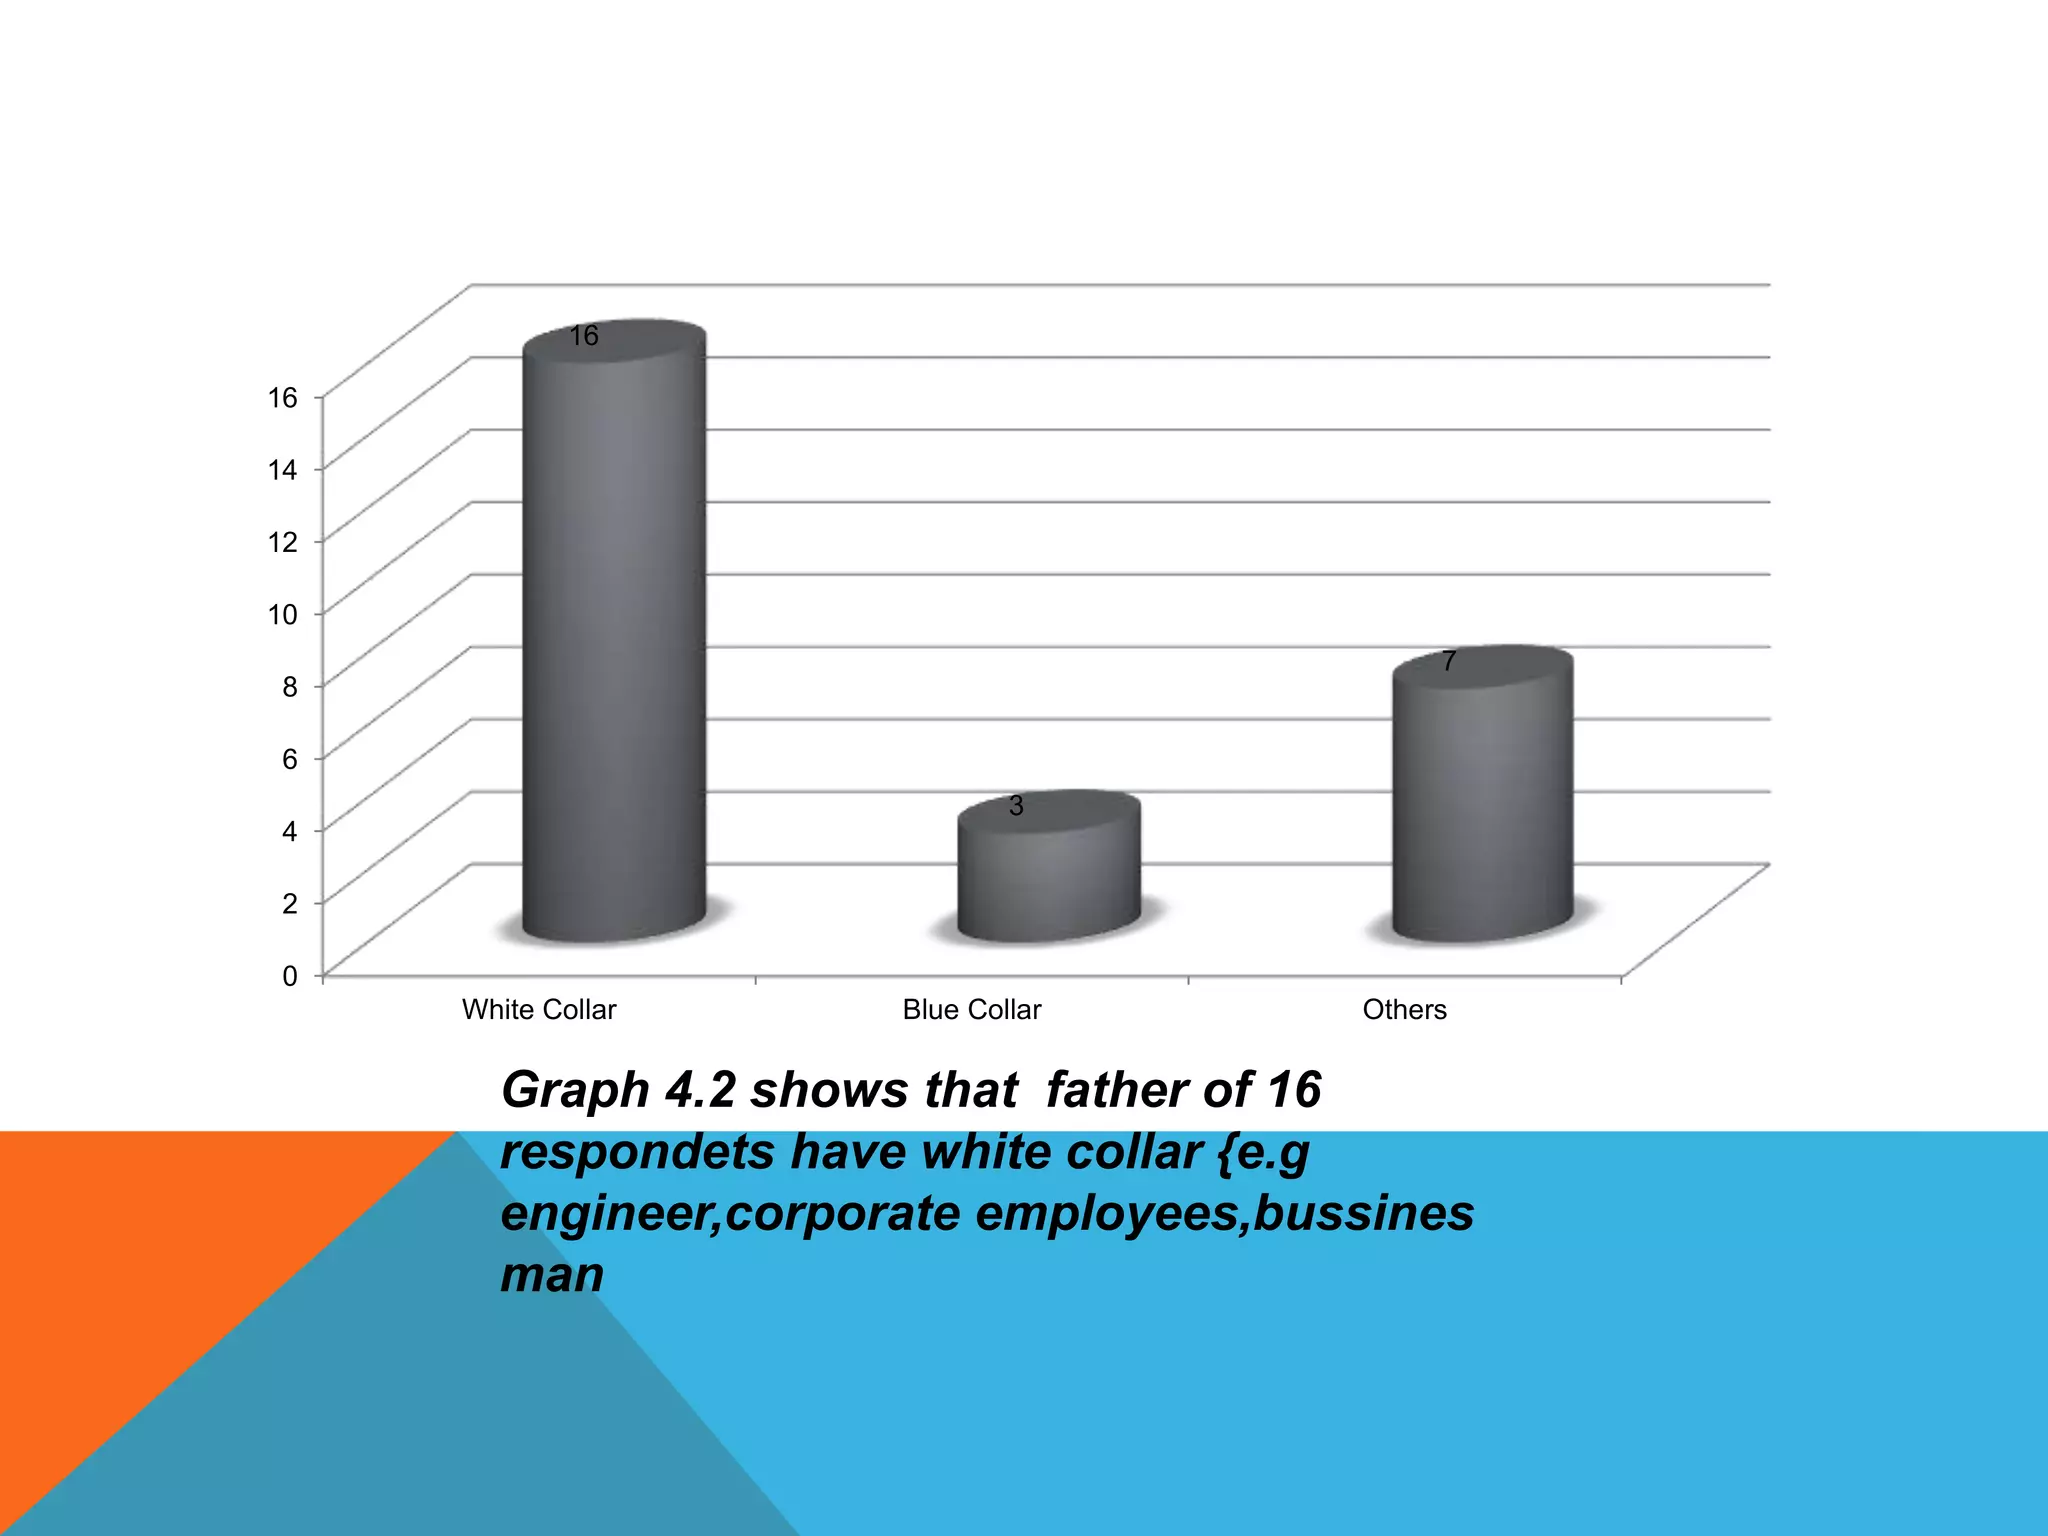
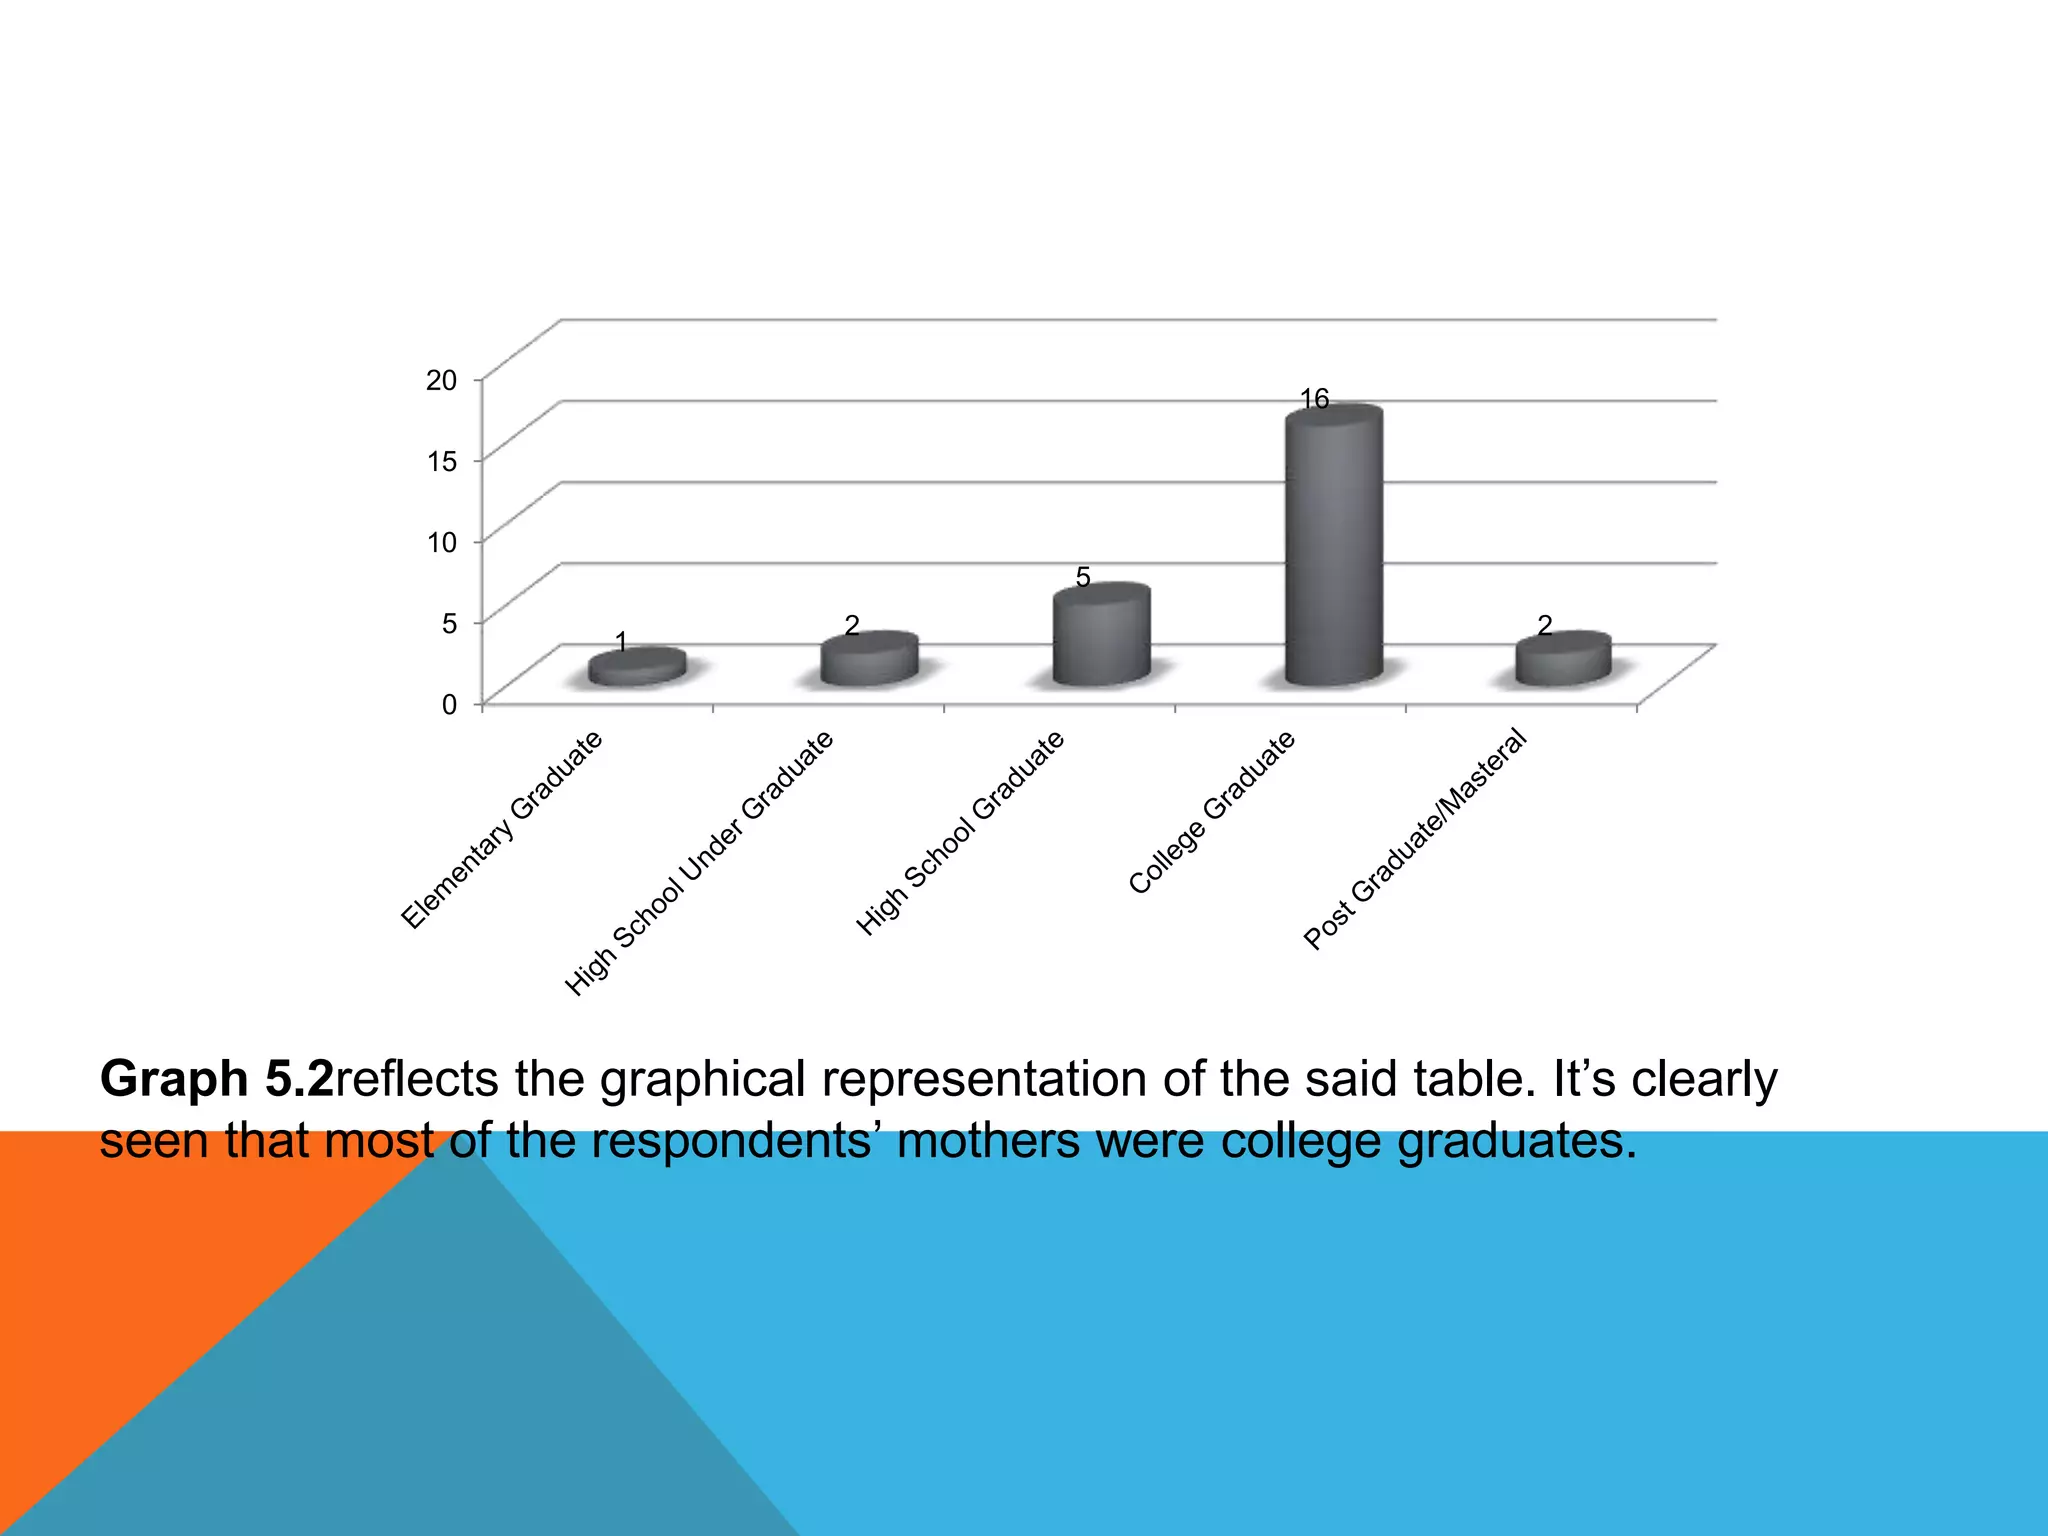
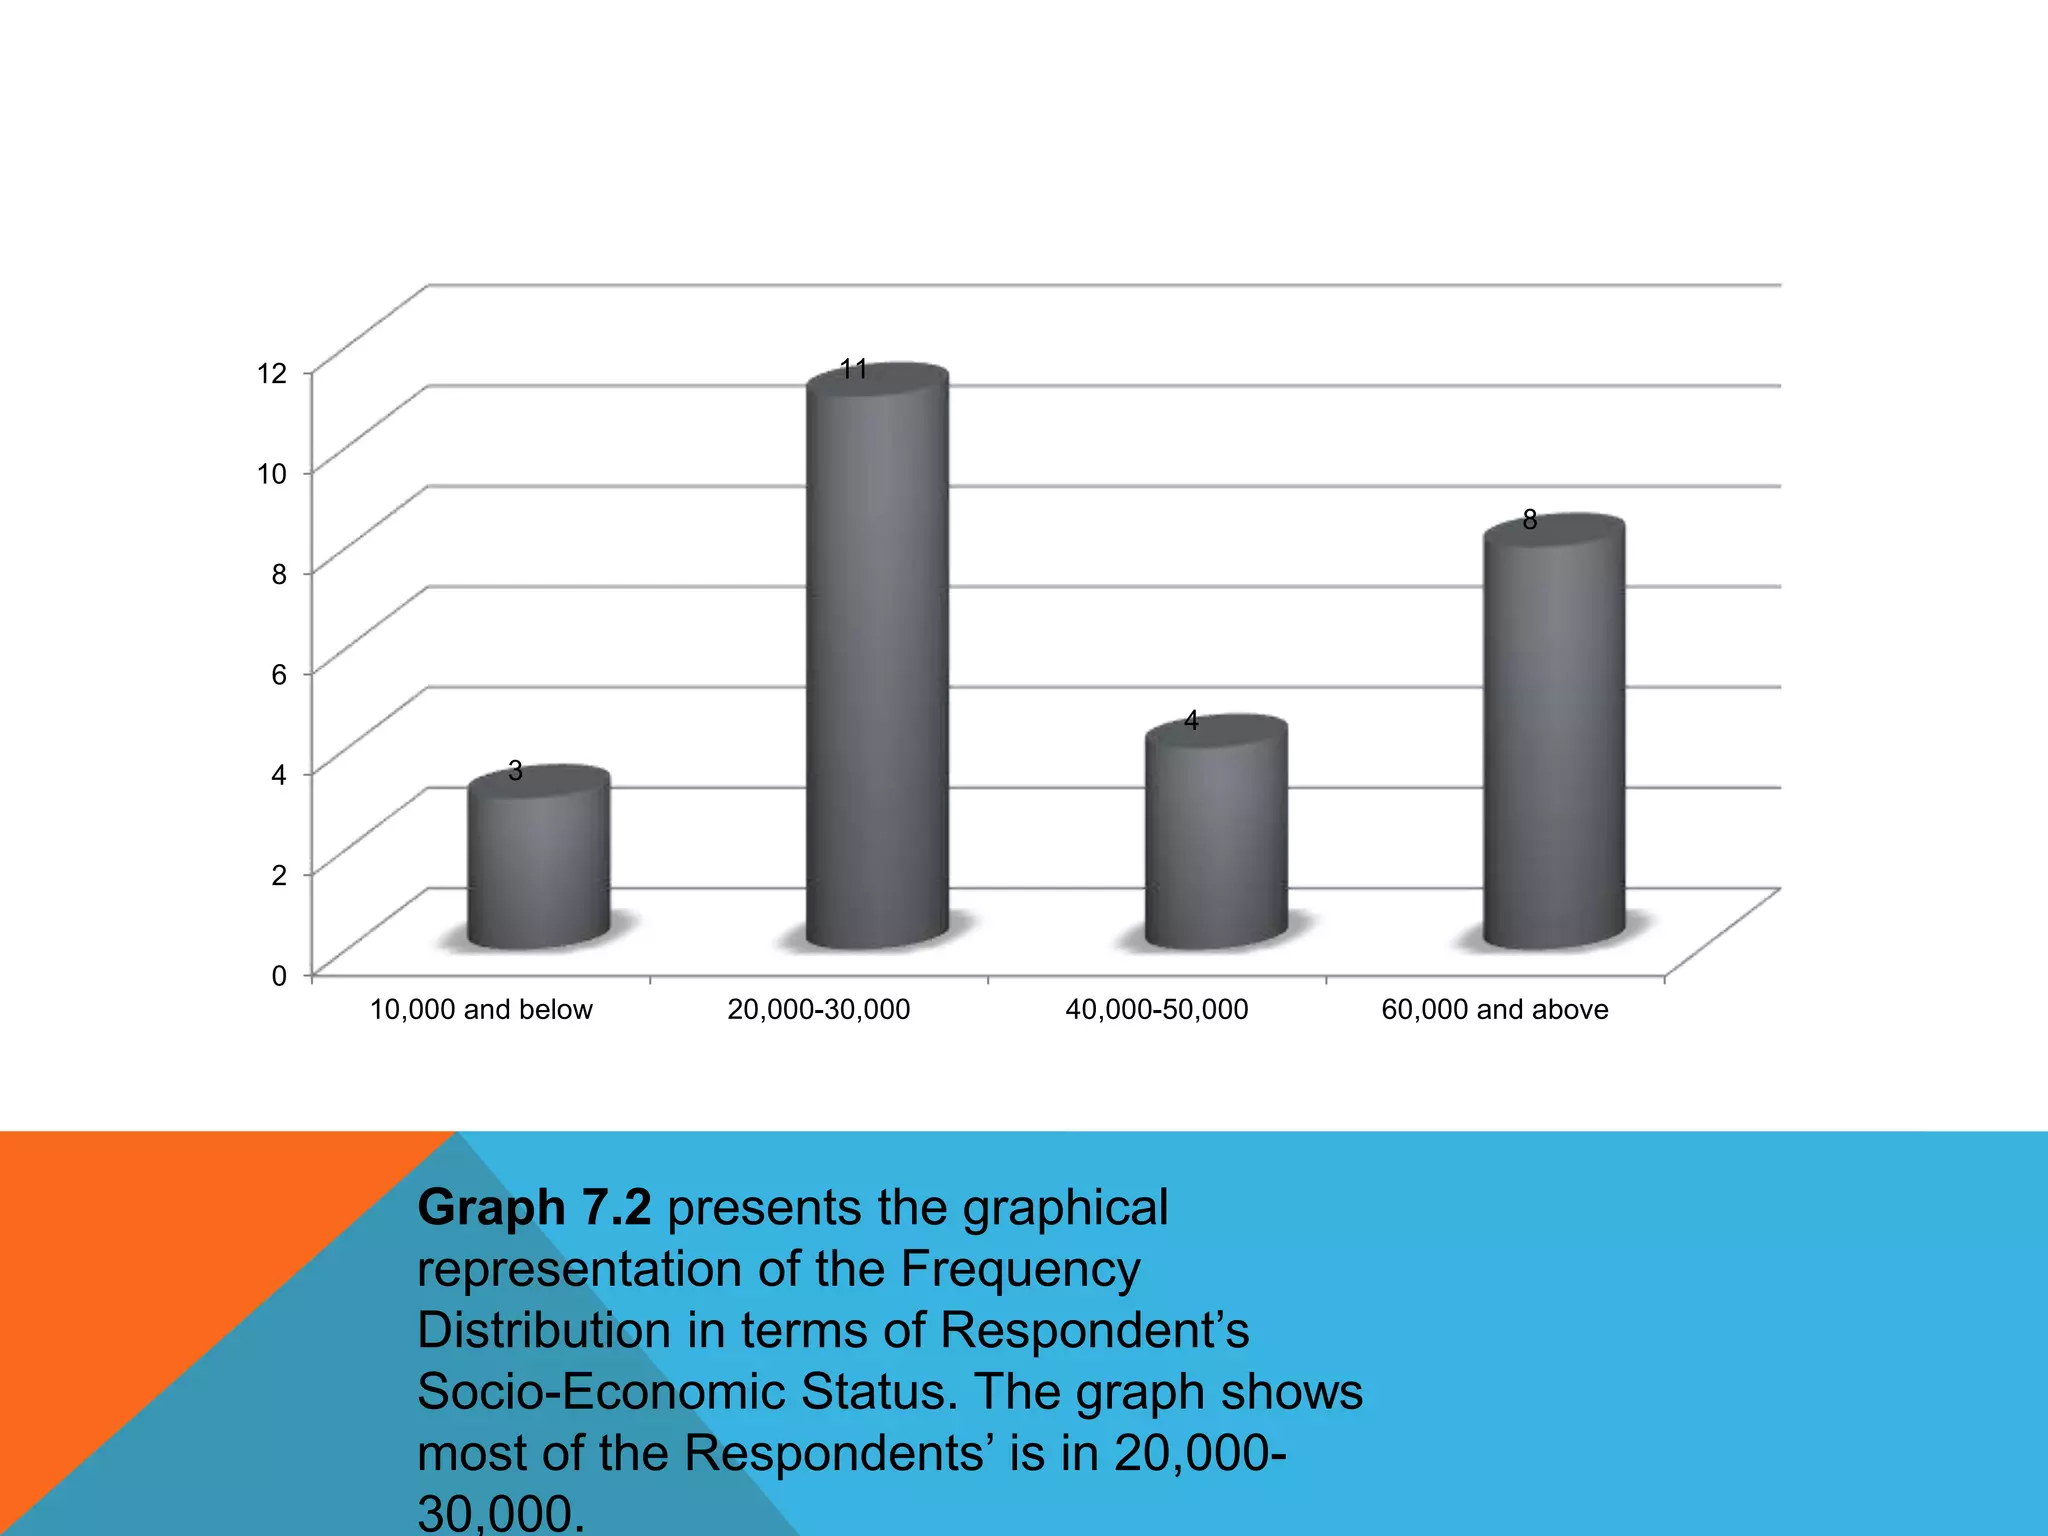
BEING A FOREIGNER AS A FACTOR AFFECTING
THE ACADEMIC PERFORMANCE OF UPPER
ELEMENTARY
PROBLEM AND ITS SETTING
In our lives, we call people who are not from our country foreigners. Oftentimes, we are curious
about their origin and what they do in our country. In a textbook concept, a foreigner is a
person born in or coming from a country other than one’s own.
If you have ever been to another country, then, congratulations ladies and gentleman, you have
become a foreigner. It is a privilege and a responsibility at the same time. Privilege, for being
able to travel. Not all people can travel out of the country. Responsibility, because you
represent your entire country. How people see you in a foreign land will most probably be
their perception of generalization of your race.
You have to make your own image to them and talk with them. The difficult part is when you talk
to them but they don’t understand you and vice versa. Language barrier, especially if the
language is quite difficult to learn.
For some, being a foreigner is a part their live. Some are with their parents because of work and
business. It is always a challenge at first especially in the adjustment period on almost
everything – food, weather, language, culture, and many others. But the brighter side of this
is you get to have new friends, new classmates, you learn about the country and its culture.
More or less, you will eventually learn speaking their language. It is not a walk in the park, but
everybody gets there eventually.
The downside is the harsh reality that not all people will be kind to you. Racism is a very, very
difficult challenge to overcome. This triggers bullying, especially with regard to the physical
aspects. Being a foreigner also means looking different. Skin color varies, fashion, hair,
manner of speaking and many others. These can either make or break a person and thus,
have both negative and positive impact on a foreign student
SCOPE AND DELIMITATION
This study is just for the selected upper elementary student
of St. Therese School, attending a secondary education,
from the school year 2017-2018. This is only for foreign
students.
Significance of the Study
The focus of this study will just focus on the foreign student
As Factor Affecting The Selected upper elemtary
Student of St. Therese School 2017-2018
STATEMENT OF THE PROBLEM
This study aims to answer and explain the fallowing question
1. What is foreign student?
2. What are the challenges faced by a foreign student?
3. Is there an effect on he academic performance? How?
Demographic Profile
a. Age
b. Gender
c. Economic Status
d. Parents Educational
e. Parents Attainment
f. Parents Occupation
CONCEPTUAL FRAME
foreign student
academic
performance
effect
HYPOTHESIS
There are t relationships between foreign student
and academic performance. Both can be used
in life or not . when they particpate in school
activities they can help thier self to learn more
.so they can improve thier self esteem .it also
help them to comunnicate with other people
1
The Business School, University of Hertfordshire APRIL 8 2007 The aim of
study is to investigate the factors affecting the academic performance
of international students in project management courses. To achieve
this aim, a conceptual framework including three categories of factors:
(i) Teaching Style, (ii) English Language and Communication and (iii)
Assessment Methods was developed and empirically tested on a
sample of international students from a British Post 92 University.The
results suggest that the factors: level of details given in lectures, speed
of lectures, academic internet sources, English Language skills, group
or individual assessment, the qualitative/quantitative content of
assessment are important drivers of the academic performance of
international students in project management.
2
FOREIGN STUDENTS MAY 1 1961The academic success of foreign students
in the United States depends heavily upon the selection process, which
is an effort to predict whether the student will profit personally and for
the countries involved through a period of study in an American
university. Significant factors in the selection process include the
demonstrated academic ability of the student, his English proficiency,
the adequacy and reliabil ity of his financial resources, his adaptability
to a strange en vironment and to a new role upon his return home, and
the facilities of the university of his choice for satisfying his edu
cational desires.
3
Human psychological stress involves a state of emotional strain resulting
from a demanding circumstance. IN 1993 The objective of this study is
to critically examine the factors causing the stress among the
international students studying in South Texas University. In this study,
67 surveys were administered to international undergraduate and
graduate students at South Texas University. According to the results,
97% of the international students are experiencing many of the types of
stress found in the literature reviewed for this project. The results of the
present study also indicated that environmental and cultural change
also has a great impact on their emotional stability.
4
24 JULY 2007 Western university. A common belief among educators is that
international students are insufficiently adjusted to higher education in
their host country, both academically and socially. Furthermore, several
groups of international students experience considerable amounts of
stress while adapting to the culture of the host-institute. Several
researchers argue that studies on adaptation of international students
should widen its focus to the underlying mechanisms that leads
towards this “misalignment”. In a cross-institutional comparison among
958 students at five business schools in the Netherlands, differences in
academic performance between local and international students were
identified by focussing on their levels of academic and social
integration.
5
This study I was conducted ON 1997 examine different factors influencing
the academic performance of students in a tertiary institution in
Singapore. The main method of data collection was a semi-structured
questionnaire administered to 144 students. The specific objectives of
the study were to determine if factors such as gender, age, nationality
of student, part-time employment, extracurricular activities and interest
in pursuing higher studies affected academic success.
6-7
ACCORDING TO Many studies have examined the factors of being
foreigner student academic performanceprimary and secondary
education as well as at university, with the purpose of
enhancingearning at these stages and reducing drop-out rates. It is
within this research framework
accoding to Foreign study is a multifaceted phenomenon - its impact is felt
on academic institutions in both the 'host' and 'sending' countries, on
the economies of nations, and of course on the individuals involved.
With more than one million students studying abroad, foreign study has
assumed considerable importance in higher education planning. This
article considers the many aspects of foreig study and discusses the
interrelationships of these elements.
8
Adrian furnham he aim of this study was to replicate and extend the study
of Bochner et al. (1977) which presented a functional model for the
development of overseas student friendship patterns. Whereas Bochner
et al. (1977) used only 30 Far Eastern foreign students and 6 host
nationals in his Hawaian study, this study used 140 foreign students
from each continent. Subjects were asked to specify various aspects
(including nationality) of their three best friends, and also their
preferred companion for each of a range of everyday situations. The
friendship network data revealed a strong preference for co-national
friends first, other nationals second and host nationals third, while the
preferred companion data showed co-nationals first, then host nationals
and finally ‘other’ nationals. The results closely match the results of
Bochner et al. (1977) and provide further evidence for the functional
model.
9
More than 3 million students study outside their home country, primarily at
a Western university. A common belief among educators is that
international students are insufficiently adjusted to higher education in
their host country, both academically and socially. Furthermore, several
groups of international students experience considerable amounts of
stress while adapting to the culture of the host-institute. Several
researchers argue that studies on adaptation of international students
should widen its focus to the underlying mechanisms that leads
towards this “misalignment”.
10
ACCORDING TO Foreign study is a multifaceted phenomenon 1991 - its
impact is felt on academic institutions in both the ‘host’ and ‘sending’
countries, on the economies of nations, and of course on the
individuals involved. With more than one million students studying
abroad, foreign study has assumed considerable importance in higher
education planning. This article considers the many aspects of foreign
study and discusses the interrelationships of these elements.
RESEARCH DESIGN
The method used in the research is the descriptive research, general to
specific wherein it will include all those studies that will support to
represent facts concerning the nature and status of the school. It is
concerned with the condition of relationships that exist; effects that are
being felt
RESEARCH LOCALE
The researcher would focus this study at Saint Therese School, located at
#27 Aurora Drive, Vergonville Subdivision, Las Piñas City Metro Manila
RESPONDENTS OF THE STUDY
The respondents of the study are from the selected upper elementary
students of the Saint Therese School, School Year 2017-2018
Research Instrument
In order to measure being a foreigner affects the academic performance of
the selected upper elementary students of Saint Therese School, the
researcher surveyed the students with the use of questionnaire it was
composed of a ten yes-no questions on how to be a foreigner student
by plotting a “ ✓” mark on Yes for agreeing and No for disagreeing to
calculate the said study.
SAMPLING TECHNIQUE
The researcher used selected sampling, involves active selection of
members of the population that are considered to be most
representative of the objectives outlined in the inventory or monitoring
program. The research consisted by grade4,5 and 6.
STATISTICAL TREATMENT DATA
Frequency distribution is a table that displays the frequency of various outcomes in a
sample. Each entry in the table contains the frequency or count of the occurrences of
values within a particular group or interval, and in this way, the table summarizes the
distribution of values in the sample.
P = F x 100
Total Frequency
Likert Scale is a psychometric scale commonly involved in research that employs
questionnaires. This type of scale uses fixed choice response formats and is designed
to measure attitudes or opinions. This scale measures levels of
agreement/disagreement. It is the most widely used approach to scaling responses in
every survey research.
Pearson Product-Moment Correlation Coefficient (PPMCC) is a measure of the linear
correlation between two variables X and Y, giving a value between +1 and −1 inclusive,
where 1 is total positive correlation, 0 is no correlation, and −1 is total negative
correlation. It is widely used in the sciences as a measure of the degree of linear
dependence between two variables.
For a Sample:
Pearson's correlation coefficient when applied to a sample is commonly
represented by the letter r. We can obtain a formula for r by substituting estimates of the
covariance and variances based on a sample.
DATA GATHERING
The researcher created a ten yes-or-no questionnaire and it was approved
by their thesis teacher. The researcher will then prepare for the survey.
The researcher conducted the survey within the selected upper
elementary school students of Saint Therese School. With the
researcher’s formal attire the researcher will then go to the designated
classroom. The researcher will first introduce herself afterwards he will
explain his topic and instructions to the students carefully and clearly.
The given time for answering the questionnaire is a minimum of 5
minutes and the maximum time is 10 minutes. If the respondents are
done answering the questionnaire, the researcher will thank the
respondents for answering truthfully
DEMOGRAPHIC PROFILE OF RESPONDENTS
gender frequency percentage
male 7 26.92%
female 19 73.08%
tatal 26 10%
Table 1.1shows the frequency and percentage distribution of the
respondents’ gender. The researcher obtained Table 1.1 giving a
total of 19 respondents for female with a percentage of 73.08%
and 7 respondents for male with a percentage of 26.92%.
0
2
4
6
8
10
12
14
16
18
20
male female
7
19
Graph 1.2displays the graphical
representation of table 1.1. It shows that
the majority of the respondents were
female
AGE FREQUENCY PERCENTAGE
9-10 11 33.33%
12-13 13 50%
14-15 2 16.67%
TOTAL 26 100%
0
5
10
15
9-10 yo 12-13 yo 14-15 yo
11
13
2
Table 2.1 and graph 2.2show the Frequency and Percentage
Distribution of the Age of the Respondents. It shows that out of 26
respondents, 11 are aged 9-10 yrs old which is 42.31%.
13 respondents are from 12-13 yrs old which is 50 %. And 2
respondents are aged 14-15 yrs old . it is evident that half of the
respondence are 12-13 yrs old
EDUCATIONAL ATTAINMENT OF FATHER
EDUCATIONAL
ATTAINMENT
FREQUENCY PERCENTAGE
ELEMENTARY GRAD 1 3.85%
HIGH SCHOOL
UNDER GRAD
1 3.85%
HIGH SCHOOL GRAD 4 15.38%
COLLEGE GRAD 18 69.23%
MASTERAL 2 7.69%
TOTAL 26 10%
Table 3.1shows that 18 or 71.43 % of the respondents’ father are
College Graduates . 4 or 15.38% are high school graduate. 2 or 7.69%
from the Post Graduate or the Masteral. 1 or 3.85 % is from the high
school under graduate and elementary graduate.
0
5
10
15
20
1 1
4
18
2
Graph 3.2reflects the graphical
representation of the said table. It’s clearly
seen that most of the respondents’ father
were college graduates
OCCUPATION OF FATHER
OCCUPATION FREQUENCY PERCENTAGE
WHITE COLLAR 16 61.54%
BLUE COLLAR 3 11.54%
OTHERS 7 26.93%
TOTAL 26 100%
Table 4.1 Frequency Distributions and
Percentage of the respondents in terms
of Occupation of Father
0
2
4
6
8
10
12
14
16
White Collar Blue Collar Others
16
3
7
Graph 4.2 shows that father of 16
respondets have white collar {e.g
engineer,corporate employees,bussines
man
EDUCATIONAL ATTAINMENT OF MOTHER
EDUCATIONAL
ATTAINMENT
FREQUENCY PERCENTAGE
ELEM GRAD 1 3.85%
HIGH SCHOOL
UNDER GRAD
2 7.69%
HIGH SCHOOL GRAD 5 19.23%
COLLEGE GRAD 16 61.54%
MASTERAL 2 7.69%
TOTAL 26 100%
Table 5.1 states that majority of the respondents’ mothers were College
Graduate having 16 or 61.54% then it was followed by 5 19.23% from the
high school graduate. 2 or 7.69% of respondence mother are high school
under graduate and masteral graduate respectively.from elementary
graduate 1 or 3.85% .
0
5
10
15
20
1
2
5
16
2
Graph 5.2reflects the graphical representation of the said table. It’s clearly
seen that most of the respondents’ mothers were college graduates.
OCCUPATION
occupation frequency percentage
White Collar 14 53.85%
Blue Collar 5 19.23%
Others 7 26.92%
Total 26 100%
Table 6.1 The researcher obtained Table 6
giving a total of 14 or 53.85 of them having
White Collar, 5or 19.23 from Blue Collar
and 7 or 26.92 having other jobs
0
2
4
6
8
10
12
14
White Collar Blue Collar Others
14
5
7
Graph 6.2is just a graphic representation
of table 6.1. It can be seen that in majority,
the white collar is the highest among other
occupations
SOCIO ECONOMIC STATUS
Socio-Economic Status Frequency Percentage
10,000 and below 3 11.54%
20,000-30,000 11 42.31%
40,000-50,000 4 15.38%
60,000 and above 8 30.77%
Total Frequency 100%
Table 7.1The researcher obtained Table 7.1 having a majority of 11or
42.31 %in the 20,000-30,000, 8 or 30.77% in the 60,000 above while
4 or 15.38% in the 40,000-50,000 and above and 3 or 11.54% in the
10,000 and below
0
2
4
6
8
10
12
10,000 and below 20,000-30,000 40,000-50,000 60,000 and above
3
11
4
8
Graph 7.2 presents the graphical
representation of the Frequency
Distribution in terms of Respondent’s
Socio-Economic Status. The graph shows
most of the Respondents’ is in 20,000-
30,000.
LIKERT
Table 8.1For the question number one, majority answered No with a frequency of
17 or 65.38%.
In question number two, majority answered NO with a frequency of 18 or
69.23%
. For question number three, majority answered NO with a frequency of 16 or
61.54%.
Then for question number four, majority answered NO with a frequency of 13or
50%
. For the fifth question, majority answered NO with a frequency of 19 or 73.08%.
Then for the sixth question, majority answered YES and NO with a frequency of
13 or 50%.
The seventh question, the majority answered Yes with a frequency of 21 or
80.77%
The distribution of the eighth question, majority answered NO with a frequency
of 18 or 19.23%.
For the ninth question, majority answered NO with a frequency of 17 or 65.38%.
Then for the last question number majority answered NO 20 or 76.92%
0
5
10
15
20
25
Series1
Series3
Graph 8.2 Frequency of Distributions
and Percentage of the respondents in
terms of Yes-No Questionnaire
GENERAL AVERAGE
average
Table 9.1 reveals that there is 1 or 3.85% respondents, who had an average
grade of 74 and below, 0 or 0 % respondent who had an average grade of 75-79.
It is followed by those who had an average grade of 80-84, having a total of 6 or
23.08% , 9 or 34.62% respondents who had an average grade of 85-89, 10 or
Summary of Findings
The respondents are all in upper elementary Department and are from Saint
Therese School.
Respondent’s Gender
The researcher has calculated that majority of the respondents are female, with the
frequency of 19 out of 26, while the male respondents got a frequency of 7 out of
26.
Respondent’s Age
The Researcher has calculated that majority of the respondents are aged 12-13
years old with the frequency of 13 out of 26. On the other hand, respondents aged
9-10 years old have a frequency of 11 out of 26 and respondents aged 14-15 years
old has a frequency of 2 out of 26 .
Respondent’s Educational Attainment of Father
Most of the researcher’s respondents’ fathers are College Graduates with a
frequency of out of 18 or 69.23 percent. On the contrary, 4 out of 26 or 15.38
percent are High School Graduate, 2 out of 26 or 7.69 percent are Post
Graduate/Masteral, and 1 out of 26 or 3.84percent are High School Under Graduate
and 1 ot of 26 or 3.84 Elementary Graduate.
Respondent’s Educational Attainment of Mother
Most of the researcher’s respondents’ mothers are College Graduates with a frequency of 16 out
of 26 or 61.54 percent. On the contrary, 5 out of 26 or 19.23 percent are High School Graduate, 2
out of 26 or 7.69 percent are Post Graduate/Masteral and 1 ou of 26 or3.85 percent and no one is
elemtary graduate
Respondent’s Occupation of Father
Majority of the respondents’ fathers are engaged in White Collar Jobs with a frequency of 16 out
of 26 or 61.54 percent, 3 out of 26 or 11.54 percent respondents’ fathers are engaged in Blue
Collar Jobs and 7 out of 26or 26.92percent have other jobs or none at all.
Respondent’s Occupation of Mother
Majority of the respondents’ mothers are engaged in White Collar Jobs with a frequency of 14
out of 26 or 53.85 percent, 5 out of 26 or 19.23 percent respondents’ mothers are engaged in
Blue Collar Jobs and 7 out of 26 or 26.93 percent have other jobs or it is either a housewife or
OFW.
Respondent’s Socio-Economic Status
Most of the respondents have a monthly family income of 20,000 pesos to 30,000 pesos with a
frequency of 11 out of 26 or 42.31 percent.60,000 pesos and above with a frequency of 8 out of
26 or 30.77 percent .40,000 pesos to 50,000 pesos with a frequency 4 ot of 26 or 15.38 percent
10,000 and below 3 out of 26 or 11.54 percent it is there monthly income
Respondent’sGeneral Average
Majority of the researcher’s respondents have a general average grade of 90-94 with a frequency
of 10 out of 26 or 38.46 percent. On the other hand the respondents got a general average grade
of 85-89 with a frequency of 9 out of 26 or 34.62 percent, 6 out of 26 or 23.08 respondents got a
general average grade of 80-84 and 1 out of 26 or 3.85 percent. Is 74 and below None of his
respondents got a general average grade of 75-79 Likert Scale of Questions
For the question number one, majority answered No with a frequency of 17 or 65.38%. In
question number two, majority answered NO with a frequency of 18 or 69.23%. For question
number three, majority answered NO with a frequency of 16 or 61.54%. Then for question
number four, majority answered NO with a frequency of 13or 50%. For the fifth question,
majority answered NO with a frequency of 19 or 73.08%. Then for the sixth question, majority
answered YES and NO with a frequency of 13 or 50%. The seventh question, the majority
answered Yes with a frequency of 21 or 80.77%. The distribution of the eighth question, majority
answered NO with a frequency of 18 or 19.23%. For the ninth question, majority answered NO
with a frequency of 17 or 65.38%. Then for the last question number majority answered NO 20 or
76.92%
Conclusions Therefore, the research has proven that there is no significant relationship
Between Being a foreigner and the Academic Performance of the selected upper elementary students
of Saint Therese School.
Recommendations
1. To the students, they should not worry about being a foreigner because it does not affect their academic performance
2. To the teachers, they should be aware that being a "foreigner" does not affect their studies so they should see them equal to other
students
3. To the parents, Motivate their children more so that they can achieve more in class because being a foreigner is not a hindrance to
their studies
4. To the Future Researchers, the subject of the study is about Being a foreigner. The researcher recommends the conducted study as
a basis. To develop more about the study and to guide them.
Bibliography
www.csus.edu/faculty/m/fred.molitor/docs/student%20performance
ww.american.edu/ocl/isss/academic resources
https://www.ncbi.nlm.nih.gov › NCBI › Literature › PubMed Central (PMC)
https://www.jstor.org/stable/41477908
pubs.sciepub.com/education/2/9/8/
https://link.springer.com/article/10.1007/BF00132723
PEARSON R
APPENDIX C
Pearson R
The researcher also used the Pearson Product Moment Correlation Coefficient ®,
which is the mean of two variables X and Y and measured on the same object to
increase or decrease together. It is linearly related and has a dimensionless index
that may take any value ranging from -1.0 to 1.0 inclusive, which is done by using
the formula:
SOLUTIONS
r=nΣxy-ΣxΣynΣx2-Σx2nΣy2-Σy2
r=26138.3-39.11002663.7-39.1226412-1002
r=3595.8-39101656.2-1528.8110,712-10,000
r=-314127,39712
r=5690,701.68
r=56301.1671960888171
r=-1.0426102313858856753375512165175 or-1.04
=rn-21-r2
t=-1.0426-21-(-1.04)2
t=-1.04241-1.0816
t=-1.0424-0.816
t=-1.04-29.4117647059
t=-1.04(5.42326145 I)
t = 5.6401919
Computed t
Tabulated t
5.6401919 < 1.706
It means there no significant relationship between the being a Foreigner and the Academic
Performance of selected upper elementary of St. Therese School

thesis learning

  • 1.
    BEING A FOREIGNERAS A FACTOR AFFECTING THE ACADEMIC PERFORMANCE OF UPPER ELEMENTARY
  • 2.
    PROBLEM AND ITSSETTING In our lives, we call people who are not from our country foreigners. Oftentimes, we are curious about their origin and what they do in our country. In a textbook concept, a foreigner is a person born in or coming from a country other than one’s own. If you have ever been to another country, then, congratulations ladies and gentleman, you have become a foreigner. It is a privilege and a responsibility at the same time. Privilege, for being able to travel. Not all people can travel out of the country. Responsibility, because you represent your entire country. How people see you in a foreign land will most probably be their perception of generalization of your race. You have to make your own image to them and talk with them. The difficult part is when you talk to them but they don’t understand you and vice versa. Language barrier, especially if the language is quite difficult to learn. For some, being a foreigner is a part their live. Some are with their parents because of work and business. It is always a challenge at first especially in the adjustment period on almost everything – food, weather, language, culture, and many others. But the brighter side of this is you get to have new friends, new classmates, you learn about the country and its culture. More or less, you will eventually learn speaking their language. It is not a walk in the park, but everybody gets there eventually. The downside is the harsh reality that not all people will be kind to you. Racism is a very, very difficult challenge to overcome. This triggers bullying, especially with regard to the physical aspects. Being a foreigner also means looking different. Skin color varies, fashion, hair, manner of speaking and many others. These can either make or break a person and thus, have both negative and positive impact on a foreign student
  • 4.
    SCOPE AND DELIMITATION Thisstudy is just for the selected upper elementary student of St. Therese School, attending a secondary education, from the school year 2017-2018. This is only for foreign students. Significance of the Study The focus of this study will just focus on the foreign student As Factor Affecting The Selected upper elemtary Student of St. Therese School 2017-2018
  • 5.
    STATEMENT OF THEPROBLEM This study aims to answer and explain the fallowing question 1. What is foreign student? 2. What are the challenges faced by a foreign student? 3. Is there an effect on he academic performance? How? Demographic Profile a. Age b. Gender c. Economic Status d. Parents Educational e. Parents Attainment f. Parents Occupation
  • 6.
  • 7.
    HYPOTHESIS There are trelationships between foreign student and academic performance. Both can be used in life or not . when they particpate in school activities they can help thier self to learn more .so they can improve thier self esteem .it also help them to comunnicate with other people
  • 9.
    1 The Business School,University of Hertfordshire APRIL 8 2007 The aim of study is to investigate the factors affecting the academic performance of international students in project management courses. To achieve this aim, a conceptual framework including three categories of factors: (i) Teaching Style, (ii) English Language and Communication and (iii) Assessment Methods was developed and empirically tested on a sample of international students from a British Post 92 University.The results suggest that the factors: level of details given in lectures, speed of lectures, academic internet sources, English Language skills, group or individual assessment, the qualitative/quantitative content of assessment are important drivers of the academic performance of international students in project management.
  • 10.
    2 FOREIGN STUDENTS MAY1 1961The academic success of foreign students in the United States depends heavily upon the selection process, which is an effort to predict whether the student will profit personally and for the countries involved through a period of study in an American university. Significant factors in the selection process include the demonstrated academic ability of the student, his English proficiency, the adequacy and reliabil ity of his financial resources, his adaptability to a strange en vironment and to a new role upon his return home, and the facilities of the university of his choice for satisfying his edu cational desires.
  • 11.
    3 Human psychological stressinvolves a state of emotional strain resulting from a demanding circumstance. IN 1993 The objective of this study is to critically examine the factors causing the stress among the international students studying in South Texas University. In this study, 67 surveys were administered to international undergraduate and graduate students at South Texas University. According to the results, 97% of the international students are experiencing many of the types of stress found in the literature reviewed for this project. The results of the present study also indicated that environmental and cultural change also has a great impact on their emotional stability.
  • 12.
    4 24 JULY 2007Western university. A common belief among educators is that international students are insufficiently adjusted to higher education in their host country, both academically and socially. Furthermore, several groups of international students experience considerable amounts of stress while adapting to the culture of the host-institute. Several researchers argue that studies on adaptation of international students should widen its focus to the underlying mechanisms that leads towards this “misalignment”. In a cross-institutional comparison among 958 students at five business schools in the Netherlands, differences in academic performance between local and international students were identified by focussing on their levels of academic and social integration.
  • 13.
    5 This study Iwas conducted ON 1997 examine different factors influencing the academic performance of students in a tertiary institution in Singapore. The main method of data collection was a semi-structured questionnaire administered to 144 students. The specific objectives of the study were to determine if factors such as gender, age, nationality of student, part-time employment, extracurricular activities and interest in pursuing higher studies affected academic success.
  • 14.
    6-7 ACCORDING TO Manystudies have examined the factors of being foreigner student academic performanceprimary and secondary education as well as at university, with the purpose of enhancingearning at these stages and reducing drop-out rates. It is within this research framework accoding to Foreign study is a multifaceted phenomenon - its impact is felt on academic institutions in both the 'host' and 'sending' countries, on the economies of nations, and of course on the individuals involved. With more than one million students studying abroad, foreign study has assumed considerable importance in higher education planning. This article considers the many aspects of foreig study and discusses the interrelationships of these elements.
  • 15.
    8 Adrian furnham heaim of this study was to replicate and extend the study of Bochner et al. (1977) which presented a functional model for the development of overseas student friendship patterns. Whereas Bochner et al. (1977) used only 30 Far Eastern foreign students and 6 host nationals in his Hawaian study, this study used 140 foreign students from each continent. Subjects were asked to specify various aspects (including nationality) of their three best friends, and also their preferred companion for each of a range of everyday situations. The friendship network data revealed a strong preference for co-national friends first, other nationals second and host nationals third, while the preferred companion data showed co-nationals first, then host nationals and finally ‘other’ nationals. The results closely match the results of Bochner et al. (1977) and provide further evidence for the functional model.
  • 16.
    9 More than 3million students study outside their home country, primarily at a Western university. A common belief among educators is that international students are insufficiently adjusted to higher education in their host country, both academically and socially. Furthermore, several groups of international students experience considerable amounts of stress while adapting to the culture of the host-institute. Several researchers argue that studies on adaptation of international students should widen its focus to the underlying mechanisms that leads towards this “misalignment”.
  • 17.
    10 ACCORDING TO Foreignstudy is a multifaceted phenomenon 1991 - its impact is felt on academic institutions in both the ‘host’ and ‘sending’ countries, on the economies of nations, and of course on the individuals involved. With more than one million students studying abroad, foreign study has assumed considerable importance in higher education planning. This article considers the many aspects of foreign study and discusses the interrelationships of these elements.
  • 19.
    RESEARCH DESIGN The methodused in the research is the descriptive research, general to specific wherein it will include all those studies that will support to represent facts concerning the nature and status of the school. It is concerned with the condition of relationships that exist; effects that are being felt RESEARCH LOCALE The researcher would focus this study at Saint Therese School, located at #27 Aurora Drive, Vergonville Subdivision, Las Piñas City Metro Manila
  • 20.
    RESPONDENTS OF THESTUDY The respondents of the study are from the selected upper elementary students of the Saint Therese School, School Year 2017-2018 Research Instrument In order to measure being a foreigner affects the academic performance of the selected upper elementary students of Saint Therese School, the researcher surveyed the students with the use of questionnaire it was composed of a ten yes-no questions on how to be a foreigner student by plotting a “ ✓” mark on Yes for agreeing and No for disagreeing to calculate the said study.
  • 21.
    SAMPLING TECHNIQUE The researcherused selected sampling, involves active selection of members of the population that are considered to be most representative of the objectives outlined in the inventory or monitoring program. The research consisted by grade4,5 and 6.
  • 22.
    STATISTICAL TREATMENT DATA Frequencydistribution is a table that displays the frequency of various outcomes in a sample. Each entry in the table contains the frequency or count of the occurrences of values within a particular group or interval, and in this way, the table summarizes the distribution of values in the sample. P = F x 100 Total Frequency Likert Scale is a psychometric scale commonly involved in research that employs questionnaires. This type of scale uses fixed choice response formats and is designed to measure attitudes or opinions. This scale measures levels of agreement/disagreement. It is the most widely used approach to scaling responses in every survey research. Pearson Product-Moment Correlation Coefficient (PPMCC) is a measure of the linear correlation between two variables X and Y, giving a value between +1 and −1 inclusive, where 1 is total positive correlation, 0 is no correlation, and −1 is total negative correlation. It is widely used in the sciences as a measure of the degree of linear dependence between two variables. For a Sample: Pearson's correlation coefficient when applied to a sample is commonly represented by the letter r. We can obtain a formula for r by substituting estimates of the covariance and variances based on a sample.
  • 23.
    DATA GATHERING The researchercreated a ten yes-or-no questionnaire and it was approved by their thesis teacher. The researcher will then prepare for the survey. The researcher conducted the survey within the selected upper elementary school students of Saint Therese School. With the researcher’s formal attire the researcher will then go to the designated classroom. The researcher will first introduce herself afterwards he will explain his topic and instructions to the students carefully and clearly. The given time for answering the questionnaire is a minimum of 5 minutes and the maximum time is 10 minutes. If the respondents are done answering the questionnaire, the researcher will thank the respondents for answering truthfully
  • 25.
    DEMOGRAPHIC PROFILE OFRESPONDENTS gender frequency percentage male 7 26.92% female 19 73.08% tatal 26 10% Table 1.1shows the frequency and percentage distribution of the respondents’ gender. The researcher obtained Table 1.1 giving a total of 19 respondents for female with a percentage of 73.08% and 7 respondents for male with a percentage of 26.92%.
  • 26.
    0 2 4 6 8 10 12 14 16 18 20 male female 7 19 Graph 1.2displaysthe graphical representation of table 1.1. It shows that the majority of the respondents were female
  • 27.
    AGE FREQUENCY PERCENTAGE 9-1011 33.33% 12-13 13 50% 14-15 2 16.67% TOTAL 26 100% 0 5 10 15 9-10 yo 12-13 yo 14-15 yo 11 13 2 Table 2.1 and graph 2.2show the Frequency and Percentage Distribution of the Age of the Respondents. It shows that out of 26 respondents, 11 are aged 9-10 yrs old which is 42.31%. 13 respondents are from 12-13 yrs old which is 50 %. And 2 respondents are aged 14-15 yrs old . it is evident that half of the respondence are 12-13 yrs old
  • 28.
    EDUCATIONAL ATTAINMENT OFFATHER EDUCATIONAL ATTAINMENT FREQUENCY PERCENTAGE ELEMENTARY GRAD 1 3.85% HIGH SCHOOL UNDER GRAD 1 3.85% HIGH SCHOOL GRAD 4 15.38% COLLEGE GRAD 18 69.23% MASTERAL 2 7.69% TOTAL 26 10% Table 3.1shows that 18 or 71.43 % of the respondents’ father are College Graduates . 4 or 15.38% are high school graduate. 2 or 7.69% from the Post Graduate or the Masteral. 1 or 3.85 % is from the high school under graduate and elementary graduate.
  • 29.
    0 5 10 15 20 1 1 4 18 2 Graph 3.2reflectsthe graphical representation of the said table. It’s clearly seen that most of the respondents’ father were college graduates
  • 30.
    OCCUPATION OF FATHER OCCUPATIONFREQUENCY PERCENTAGE WHITE COLLAR 16 61.54% BLUE COLLAR 3 11.54% OTHERS 7 26.93% TOTAL 26 100% Table 4.1 Frequency Distributions and Percentage of the respondents in terms of Occupation of Father
  • 31.
    0 2 4 6 8 10 12 14 16 White Collar BlueCollar Others 16 3 7 Graph 4.2 shows that father of 16 respondets have white collar {e.g engineer,corporate employees,bussines man
  • 32.
    EDUCATIONAL ATTAINMENT OFMOTHER EDUCATIONAL ATTAINMENT FREQUENCY PERCENTAGE ELEM GRAD 1 3.85% HIGH SCHOOL UNDER GRAD 2 7.69% HIGH SCHOOL GRAD 5 19.23% COLLEGE GRAD 16 61.54% MASTERAL 2 7.69% TOTAL 26 100% Table 5.1 states that majority of the respondents’ mothers were College Graduate having 16 or 61.54% then it was followed by 5 19.23% from the high school graduate. 2 or 7.69% of respondence mother are high school under graduate and masteral graduate respectively.from elementary graduate 1 or 3.85% .
  • 33.
    0 5 10 15 20 1 2 5 16 2 Graph 5.2reflects thegraphical representation of the said table. It’s clearly seen that most of the respondents’ mothers were college graduates.
  • 34.
    OCCUPATION occupation frequency percentage WhiteCollar 14 53.85% Blue Collar 5 19.23% Others 7 26.92% Total 26 100% Table 6.1 The researcher obtained Table 6 giving a total of 14 or 53.85 of them having White Collar, 5or 19.23 from Blue Collar and 7 or 26.92 having other jobs
  • 35.
    0 2 4 6 8 10 12 14 White Collar BlueCollar Others 14 5 7 Graph 6.2is just a graphic representation of table 6.1. It can be seen that in majority, the white collar is the highest among other occupations
  • 36.
    SOCIO ECONOMIC STATUS Socio-EconomicStatus Frequency Percentage 10,000 and below 3 11.54% 20,000-30,000 11 42.31% 40,000-50,000 4 15.38% 60,000 and above 8 30.77% Total Frequency 100% Table 7.1The researcher obtained Table 7.1 having a majority of 11or 42.31 %in the 20,000-30,000, 8 or 30.77% in the 60,000 above while 4 or 15.38% in the 40,000-50,000 and above and 3 or 11.54% in the 10,000 and below
  • 37.
    0 2 4 6 8 10 12 10,000 and below20,000-30,000 40,000-50,000 60,000 and above 3 11 4 8 Graph 7.2 presents the graphical representation of the Frequency Distribution in terms of Respondent’s Socio-Economic Status. The graph shows most of the Respondents’ is in 20,000- 30,000.
  • 38.
  • 39.
    Table 8.1For thequestion number one, majority answered No with a frequency of 17 or 65.38%. In question number two, majority answered NO with a frequency of 18 or 69.23% . For question number three, majority answered NO with a frequency of 16 or 61.54%. Then for question number four, majority answered NO with a frequency of 13or 50% . For the fifth question, majority answered NO with a frequency of 19 or 73.08%. Then for the sixth question, majority answered YES and NO with a frequency of 13 or 50%. The seventh question, the majority answered Yes with a frequency of 21 or 80.77% The distribution of the eighth question, majority answered NO with a frequency of 18 or 19.23%. For the ninth question, majority answered NO with a frequency of 17 or 65.38%. Then for the last question number majority answered NO 20 or 76.92%
  • 40.
    0 5 10 15 20 25 Series1 Series3 Graph 8.2 Frequencyof Distributions and Percentage of the respondents in terms of Yes-No Questionnaire
  • 41.
    GENERAL AVERAGE average Table 9.1reveals that there is 1 or 3.85% respondents, who had an average grade of 74 and below, 0 or 0 % respondent who had an average grade of 75-79. It is followed by those who had an average grade of 80-84, having a total of 6 or 23.08% , 9 or 34.62% respondents who had an average grade of 85-89, 10 or
  • 43.
    Summary of Findings Therespondents are all in upper elementary Department and are from Saint Therese School. Respondent’s Gender The researcher has calculated that majority of the respondents are female, with the frequency of 19 out of 26, while the male respondents got a frequency of 7 out of 26. Respondent’s Age The Researcher has calculated that majority of the respondents are aged 12-13 years old with the frequency of 13 out of 26. On the other hand, respondents aged 9-10 years old have a frequency of 11 out of 26 and respondents aged 14-15 years old has a frequency of 2 out of 26 . Respondent’s Educational Attainment of Father Most of the researcher’s respondents’ fathers are College Graduates with a frequency of out of 18 or 69.23 percent. On the contrary, 4 out of 26 or 15.38 percent are High School Graduate, 2 out of 26 or 7.69 percent are Post Graduate/Masteral, and 1 out of 26 or 3.84percent are High School Under Graduate and 1 ot of 26 or 3.84 Elementary Graduate.
  • 44.
    Respondent’s Educational Attainmentof Mother Most of the researcher’s respondents’ mothers are College Graduates with a frequency of 16 out of 26 or 61.54 percent. On the contrary, 5 out of 26 or 19.23 percent are High School Graduate, 2 out of 26 or 7.69 percent are Post Graduate/Masteral and 1 ou of 26 or3.85 percent and no one is elemtary graduate Respondent’s Occupation of Father Majority of the respondents’ fathers are engaged in White Collar Jobs with a frequency of 16 out of 26 or 61.54 percent, 3 out of 26 or 11.54 percent respondents’ fathers are engaged in Blue Collar Jobs and 7 out of 26or 26.92percent have other jobs or none at all. Respondent’s Occupation of Mother Majority of the respondents’ mothers are engaged in White Collar Jobs with a frequency of 14 out of 26 or 53.85 percent, 5 out of 26 or 19.23 percent respondents’ mothers are engaged in Blue Collar Jobs and 7 out of 26 or 26.93 percent have other jobs or it is either a housewife or OFW. Respondent’s Socio-Economic Status Most of the respondents have a monthly family income of 20,000 pesos to 30,000 pesos with a frequency of 11 out of 26 or 42.31 percent.60,000 pesos and above with a frequency of 8 out of 26 or 30.77 percent .40,000 pesos to 50,000 pesos with a frequency 4 ot of 26 or 15.38 percent 10,000 and below 3 out of 26 or 11.54 percent it is there monthly income
  • 45.
    Respondent’sGeneral Average Majority ofthe researcher’s respondents have a general average grade of 90-94 with a frequency of 10 out of 26 or 38.46 percent. On the other hand the respondents got a general average grade of 85-89 with a frequency of 9 out of 26 or 34.62 percent, 6 out of 26 or 23.08 respondents got a general average grade of 80-84 and 1 out of 26 or 3.85 percent. Is 74 and below None of his respondents got a general average grade of 75-79 Likert Scale of Questions For the question number one, majority answered No with a frequency of 17 or 65.38%. In question number two, majority answered NO with a frequency of 18 or 69.23%. For question number three, majority answered NO with a frequency of 16 or 61.54%. Then for question number four, majority answered NO with a frequency of 13or 50%. For the fifth question, majority answered NO with a frequency of 19 or 73.08%. Then for the sixth question, majority answered YES and NO with a frequency of 13 or 50%. The seventh question, the majority answered Yes with a frequency of 21 or 80.77%. The distribution of the eighth question, majority answered NO with a frequency of 18 or 19.23%. For the ninth question, majority answered NO with a frequency of 17 or 65.38%. Then for the last question number majority answered NO 20 or 76.92% Conclusions Therefore, the research has proven that there is no significant relationship Between Being a foreigner and the Academic Performance of the selected upper elementary students of Saint Therese School.
  • 46.
    Recommendations 1. To thestudents, they should not worry about being a foreigner because it does not affect their academic performance 2. To the teachers, they should be aware that being a "foreigner" does not affect their studies so they should see them equal to other students 3. To the parents, Motivate their children more so that they can achieve more in class because being a foreigner is not a hindrance to their studies 4. To the Future Researchers, the subject of the study is about Being a foreigner. The researcher recommends the conducted study as a basis. To develop more about the study and to guide them. Bibliography www.csus.edu/faculty/m/fred.molitor/docs/student%20performance ww.american.edu/ocl/isss/academic resources https://www.ncbi.nlm.nih.gov › NCBI › Literature › PubMed Central (PMC) https://www.jstor.org/stable/41477908 pubs.sciepub.com/education/2/9/8/ https://link.springer.com/article/10.1007/BF00132723
  • 47.
    PEARSON R APPENDIX C PearsonR The researcher also used the Pearson Product Moment Correlation Coefficient ®, which is the mean of two variables X and Y and measured on the same object to increase or decrease together. It is linearly related and has a dimensionless index that may take any value ranging from -1.0 to 1.0 inclusive, which is done by using the formula:
  • 49.
  • 50.
    t=-1.0426-21-(-1.04)2 t=-1.04241-1.0816 t=-1.0424-0.816 t=-1.04-29.4117647059 t=-1.04(5.42326145 I) t =5.6401919 Computed t Tabulated t 5.6401919 < 1.706 It means there no significant relationship between the being a Foreigner and the Academic Performance of selected upper elementary of St. Therese School