Download as PDF, PPTX
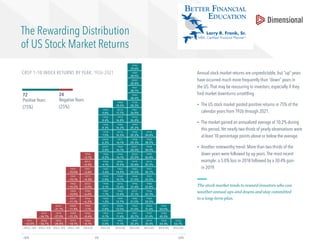


This document presents data on annual stock market returns in the US from 1926 to 2021. It shows that the market had positive returns in 75% of years, and the average annualized return was 10.2%. However, nearly two-thirds of yearly returns were at least 10 percentage points above or below the average. It also notes that more than two-thirds of down years were followed by up years, such as the 5% loss in 2018 followed by a 30.4% gain in 2019. The document concludes that investors who can withstand short-term volatility and maintain a long-term perspective tend to be rewarded in the stock market.


![After Crash[1]](https://cdn.slidesharecdn.com/ss_thumbnails/AfterCrash1-123549214485-phpapp02-thumbnail.jpg?width=640&height=640&fit=bounds)


