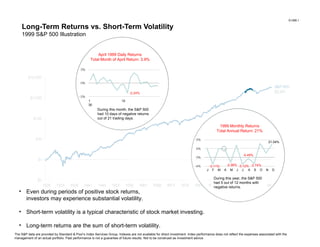
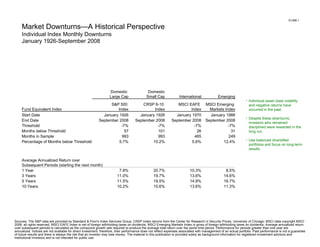
Long-Term Returns vs. Short-Term Volatility 1999 S&P 500 Illustration S1388.1 The S&P data are provided by Standard & Poor's Index Services Group. Indexes are not available for direct investment. Index performance does not reflect the expenses associated with the management of an actual portfolio. Past performance is not a guarantee of future results. Not to be construed as investment advice.  April 1999 Daily Returns Total Month of April Return: 3.9% During this month, the S&P 500 had 10 days of negative returns out of 21 trading days. 1999 Monthly Returns Total Annual Return: 21% During this year, the S&P 500 had 5 out of 12 months with negative returns. Even during periods of positive stock returns,  investors may experience substantial volatility. Short-term volatility is a typical characteristic of stock market investing. Long-term returns are the sum of short-term volatility. J  F  M  A  M  J  J  A  S  O  N  D 1  15  30 -2.24% -0.49% -3.11% -2.36% -3.12% -2.74% 21.04%
Market Downturns — A Historical Perspective Individual Index Monthly Downturns January 1926-September 2008 Individual asset class volatility and negative returns have occurred in the past. Despite these downturns, investors who remained disciplined were rewarded in the long run. Use balanced diversified portfolios and focus on long-term results. Sources: The S&P data are provided by Standard & Poor's Index Services Group; CRSP Index returns from the Center for Research in Security Prices, University of Chicago; MSCI data copyright MSCI 2008, all rights reserved. MSCI EAFE Index is net of foreign withholding taxes on dividends. MSCI Emerging Markets Index is gross of foreign withholding taxes on dividends. Average annualized return over subsequent periods is calculated as the compound growth rate required to produce the average total return over the same time period. Performance for periods greater than one year are annualized. Indices are not available for direct investment; therefore, their performance does not reflect expenses associated with management of an actual portfolio. Past performance is not a guarantee of future results and there is always the risk that an investor may lose money. The material in this publication is provided solely as background information for registered investment advisors and institutional investors and is not intended for public use. S1388.1 Domestic  Large Cap Domestic Small Cap International Emerging Fund Equivalent Index S&P 500  Index CRSP 6-10  Index MSCI EAFE  Index MSCI Emerging  Markets Index Start Date January 1926 January 1926 January 1970 January 1988 End Date September 2008 September 2008 September 2008 September 2008 Threshold -7% -7% -7% -7% Months below Threshold 57 101 26 31 Months in Sample 993 993 465 249 Percentage of Months below Threshold  5.7 % 10.2 % 5.6 % 12.4 % Average Annualized Return over  Subsequent Periods (starting the next month) 1 Year 7.8 % 20.7 % 10.3 % 8.5 % 3 Years 11.0 % 19.7 % 13.6 % 14.6 % 5 Years 11.5 % 19.5 % 14.9 % 16.7 % 10 Years 10.2 % 15.6 % 13.6 % 11.3 %
Market Downturns — A Historical Perspective Simultaneous Index Monthly Downturns January 1970-September 2008 S1388.1 Simultaneous asset class volatility and negative returns have occurred in the past. Despite these downturns, investors who remained disciplined were rewarded in the long run. Use balanced diversified portfolios and focus on long-term results. Sources: The S&P data are provided by Standard & Poor's Index Services Group; CRSP Index returns from the Center for Research in Security Prices, University of Chicago; MSCI data copyright MSCI 2008, all rights reserved. MSCI EAFE Index is net of foreign withholding taxes on dividends. MSCI Emerging Markets Index is gross of foreign withholding taxes on dividends. Average annualized return over subsequent periods is calculated as the compound growth rate required to produce the average total return over the same time period. Performance for periods greater than one year are annualized. Indices are not available for direct investment; therefore, their performance does not reflect expenses associated with management of an actual portfolio. Past performance is not a guarantee of future results and there is always the risk that an investor may lose money. The material in this publication is provided solely as background information for registered investment advisors and institutional investors and is not intended for public use. Domestic  Large Cap Domestic Small Cap International Emerging Fund Equivalent Index S&P 500  Index CRSP 6-10  Index MSCI EAFE  Index MSCI Emerging  Markets Index Start Date January 1970 January 1970 January 1970 January 1988 End Date September 2008 September 2008 September 2008 September 2008 Threshold -7% -7% -7% -7% Historical Simultaneous Index  Monthly Downturns (7% threshold) April 1970 -8.9% -16.9 % -8.4 % – November 1973 -10.8% -18.9 % -14.4 % – August 1974 -8.3% 18.2 % -10.4 % – September 1974 -11.7% -8.4 % -7.4 % – March 1980 -9.9% -17.5 % -10.7 % – October 1987 -21.5% -28.7 % -14.0 % – August 1990 -9.0% -12.6 % -9.7 % -12.8 % August 1998 -14.5% -20.6 % -12.4 % -28.9 % February 2001 -9.1% -10.0 % -7.5 % -7.8 % September 2001 -8.1% -14.9 % -10.1 % -15.5 % July 2002 -7.8% -14.8 % -9.9 % -7.6 % September 2002 -10.9% -7.3 % -10.7 % -10.8 % June 2008 -8.4% -9.4 % -8.2 % -10.0 % September 2008 -8.9% -8.8 % -14.5 % -17.5 % Average -10.6% -14.1 % -10.6 % -13.9 % Average Annualized Return over  Subsequent Periods (starting the next month) 1 Year 16.6% 30.2 % 9.0 % 28.4 % 3 Years 12.1% 22.6 % 11.1 % 24.8 % 5 Years 11.1% 20.8 % 12.6 % 27.0 % 10 Years 14.2% 20.2 % 11.6 % 14.1 %

Volatility and Market Downturns

  • 1.
    Long-Term Returns vs.Short-Term Volatility 1999 S&P 500 Illustration S1388.1 The S&P data are provided by Standard & Poor's Index Services Group. Indexes are not available for direct investment. Index performance does not reflect the expenses associated with the management of an actual portfolio. Past performance is not a guarantee of future results. Not to be construed as investment advice. April 1999 Daily Returns Total Month of April Return: 3.9% During this month, the S&P 500 had 10 days of negative returns out of 21 trading days. 1999 Monthly Returns Total Annual Return: 21% During this year, the S&P 500 had 5 out of 12 months with negative returns. Even during periods of positive stock returns, investors may experience substantial volatility. Short-term volatility is a typical characteristic of stock market investing. Long-term returns are the sum of short-term volatility. J F M A M J J A S O N D 1 15 30 -2.24% -0.49% -3.11% -2.36% -3.12% -2.74% 21.04%
  • 2.
    Market Downturns —A Historical Perspective Individual Index Monthly Downturns January 1926-September 2008 Individual asset class volatility and negative returns have occurred in the past. Despite these downturns, investors who remained disciplined were rewarded in the long run. Use balanced diversified portfolios and focus on long-term results. Sources: The S&P data are provided by Standard & Poor's Index Services Group; CRSP Index returns from the Center for Research in Security Prices, University of Chicago; MSCI data copyright MSCI 2008, all rights reserved. MSCI EAFE Index is net of foreign withholding taxes on dividends. MSCI Emerging Markets Index is gross of foreign withholding taxes on dividends. Average annualized return over subsequent periods is calculated as the compound growth rate required to produce the average total return over the same time period. Performance for periods greater than one year are annualized. Indices are not available for direct investment; therefore, their performance does not reflect expenses associated with management of an actual portfolio. Past performance is not a guarantee of future results and there is always the risk that an investor may lose money. The material in this publication is provided solely as background information for registered investment advisors and institutional investors and is not intended for public use. S1388.1 Domestic Large Cap Domestic Small Cap International Emerging Fund Equivalent Index S&P 500 Index CRSP 6-10 Index MSCI EAFE Index MSCI Emerging Markets Index Start Date January 1926 January 1926 January 1970 January 1988 End Date September 2008 September 2008 September 2008 September 2008 Threshold -7% -7% -7% -7% Months below Threshold 57 101 26 31 Months in Sample 993 993 465 249 Percentage of Months below Threshold 5.7 % 10.2 % 5.6 % 12.4 % Average Annualized Return over Subsequent Periods (starting the next month) 1 Year 7.8 % 20.7 % 10.3 % 8.5 % 3 Years 11.0 % 19.7 % 13.6 % 14.6 % 5 Years 11.5 % 19.5 % 14.9 % 16.7 % 10 Years 10.2 % 15.6 % 13.6 % 11.3 %
  • 3.
    Market Downturns —A Historical Perspective Simultaneous Index Monthly Downturns January 1970-September 2008 S1388.1 Simultaneous asset class volatility and negative returns have occurred in the past. Despite these downturns, investors who remained disciplined were rewarded in the long run. Use balanced diversified portfolios and focus on long-term results. Sources: The S&P data are provided by Standard & Poor's Index Services Group; CRSP Index returns from the Center for Research in Security Prices, University of Chicago; MSCI data copyright MSCI 2008, all rights reserved. MSCI EAFE Index is net of foreign withholding taxes on dividends. MSCI Emerging Markets Index is gross of foreign withholding taxes on dividends. Average annualized return over subsequent periods is calculated as the compound growth rate required to produce the average total return over the same time period. Performance for periods greater than one year are annualized. Indices are not available for direct investment; therefore, their performance does not reflect expenses associated with management of an actual portfolio. Past performance is not a guarantee of future results and there is always the risk that an investor may lose money. The material in this publication is provided solely as background information for registered investment advisors and institutional investors and is not intended for public use. Domestic Large Cap Domestic Small Cap International Emerging Fund Equivalent Index S&P 500 Index CRSP 6-10 Index MSCI EAFE Index MSCI Emerging Markets Index Start Date January 1970 January 1970 January 1970 January 1988 End Date September 2008 September 2008 September 2008 September 2008 Threshold -7% -7% -7% -7% Historical Simultaneous Index Monthly Downturns (7% threshold) April 1970 -8.9% -16.9 % -8.4 % – November 1973 -10.8% -18.9 % -14.4 % – August 1974 -8.3% 18.2 % -10.4 % – September 1974 -11.7% -8.4 % -7.4 % – March 1980 -9.9% -17.5 % -10.7 % – October 1987 -21.5% -28.7 % -14.0 % – August 1990 -9.0% -12.6 % -9.7 % -12.8 % August 1998 -14.5% -20.6 % -12.4 % -28.9 % February 2001 -9.1% -10.0 % -7.5 % -7.8 % September 2001 -8.1% -14.9 % -10.1 % -15.5 % July 2002 -7.8% -14.8 % -9.9 % -7.6 % September 2002 -10.9% -7.3 % -10.7 % -10.8 % June 2008 -8.4% -9.4 % -8.2 % -10.0 % September 2008 -8.9% -8.8 % -14.5 % -17.5 % Average -10.6% -14.1 % -10.6 % -13.9 % Average Annualized Return over Subsequent Periods (starting the next month) 1 Year 16.6% 30.2 % 9.0 % 28.4 % 3 Years 12.1% 22.6 % 11.1 % 24.8 % 5 Years 11.1% 20.8 % 12.6 % 27.0 % 10 Years 14.2% 20.2 % 11.6 % 14.1 %

Editor's Notes

  • #2 Talking Points: Equities offer a higher expected return than fixed income assets over the long term. However, this return premium comes with higher risk, which is manifested in short-term volatility.   This slide illustrates that short-term losses are often embedded in longer-term gains. The graph shows the growth of $1 invested in the S&P 500 Index in 1926 until the present, and details the index’s performance during a single year (1999). The first bubble plots monthly returns and the adjacent bubble shows daily returns for a single month (April 1999). Although the S&P 500 Index delivered a strong 21.04% return in 1999, five of the months had negative returns. The market delivered a 3.9% total return during April, even though it closed with losses on many days.   Investors who want to capture the higher returns of stocks must accept the possibility of experiencing daily, monthly, and yearly losses along the way. Disciplined investors must focus on the big picture while knowing that short-term volatility will often test their resolve.