
Recommended
Recommended
More Related Content
What's hot
What's hot (20)
Similar to The world this week 3rd august
Similar to The world this week 3rd august (20)
Recently uploaded
Recently uploaded (20)
The world this week 3rd august
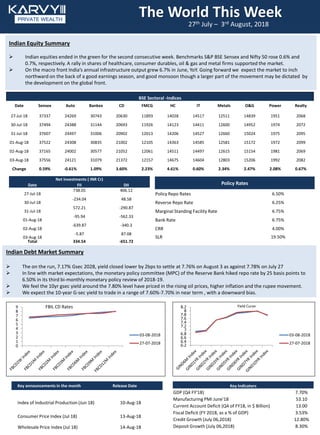
- 1. The World This Week 27th July – 3rd August, 2018 Policy Rates Policy Repo Rates 6.50% Reverse Repo Rate 6.25% Marginal Standing Facility Rate 6.75% Bank Rate 6.75% CRR 4.00% SLR 19.50% Indian Equity Summary Indian equities ended in the green for the second consecutive week. Benchmarks S&P BSE Sensex and Nifty 50 rose 0.6% and 0.7%, respectively. A rally in shares of healthcare, consumer durables, oil & gas and metal firms supported the market. On the macro front India’s annual infrastructure output grew 6.7% in June, YoY. Going forward we expect the market to inch northward on the back of a good earnings season, and good monsoon though a larger part of the movement may be dictated by the development on the global front. Indian Debt Market Summary The on the run, 7.17% Gsec 2028, yield closed lower by 2bps to settle at 7.76% on August 3 as against 7.78% on July 27 In line with market expectations, the monetary policy committee (MPC) of the Reserve Bank hiked repo rate by 25 basis points to 6.50% in its third bi-monthly monetary policy review of 2018-19. We feel the 10yr gsec yield around the 7.80% level have priced in the rising oil prices, higher inflation and the rupee movement. We expect the 10-year G-sec yield to trade in a range of 7.60%-7.70% in near term , with a downward bias. Key announcements in the month Release Date Index of Industrial Production (Jun 18) 10-Aug-18 Consumer Price Index (Jul 18) 13-Aug-18 Wholesale Price Index (Jul 18) 14-Aug-18 BSE Sectoral -Indices Date Sensex Auto Bankex CD FMCG HC IT Metals O&G Power Realty 27-Jul-18 37337 24269 30743 20630 11893 14028 14517 12511 14839 1951 2068 30-Jul-18 37494 24388 31144 20693 11926 14123 14411 12600 14952 1974 2072 31-Jul-18 37607 24497 31006 20902 12013 14206 14527 12660 15024 1975 2095 01-Aug-18 37522 24308 30835 21002 12105 14363 14585 12581 15172 1972 2099 02-Aug-18 37165 24002 30577 21052 12061 14511 14497 12615 15154 1981 2069 03-Aug-18 37556 24121 31079 21372 12157 14675 14604 12803 15206 1992 2082 Change 0.59% -0.61% 1.09% 3.60% 2.23% 4.61% 0.60% 2.34% 2.47% 2.08% 0.67% Key Indicators GDP (Q4 FY'18) 7.70% Manufacturing PMI June'18 53.10 Current Account Deficit (Q4 of FY18, in $ Billion) 13.00 Fiscal Deficit (FY 2018, as a % of GDP) 3.53% Credit Growth (July 06,2018) 12.80% Deposit Growth (July 06,2018) 8.30% Yield CurveFBIL CD Rates Net Investments ( INR Cr) Date FII DII 27-Jul-18 738.05 406.12 30-Jul-18 -234.04 48.58 31-Jul-18 572.21 -290.87 01-Aug-18 -95.94 -562.33 02-Aug-18 -639.87 -340.3 03-Aug-18 -5.87 87.08 Total 334.54 -651.72 6.2 6.4 6.6 6.8 7 7.2 7.4 7.6 7.8 8 8.2 03-08-2018 27-07-2018 0 1 2 3 4 5 6 7 8 9 03-08-2018 27-07-2018
- 2. Domestic News In line with market expectations, the monetary policy committee (MPC) of the Reserve Bank hiked repo rate by 25 basis points to 6.50% Biocon is aiming to register a 66 per cent growth in its biologics business this fiscal, which the company hopes will help it clock revenue of $200 million on the back of emerging markets growth. According to the government data, eight core sector industries register seven-month high growth of 6.7 percent in June. According to the Finance Ministry statement, GST collections rose to Rs 964.83 billion in July from Rs 956.1 billion mopped up in the previous month. International News Eurozone Producer prices advanced 3.6 percent annually in June, faster than the 3 percent rise in May President Donald Trump is weighing the idea of increasing from 10% to 25% the tariffs imposed on some $200 billion of Chinese products, mainly consumer goods China tempts Britain with free trade, says door to US talks open U.S. consumer spending increased solidly in June as households spent more at restaurants and on accommodation, building a strong base for the economy heading into the third quarter, while inflation rose moderately Source: Reuters, NSDL, FIMMDA, CARE,RBI, MCX SX, BSE, NSE, Bloomberg, Business Standard, Economic Times Abbreviations: FII (Foreign Institution Investors), PMI Purchasing Manager index WPI (Wholesale Price Index), P/E (Price/Earnings ratio), CP (Commercial Papers), G- sec (Government Securities), MTD – Month to Date, YTD – Year to Date Disclaimer The information and views presented here are prepared by Karvy Private Wealth (a division of Karvy Stock Broking Limited) or other Karvy Group companies. The information contained herein is based upon sources that we consider reliable. We, however, do not vouch for the accuracy or the completeness thereof. This material is for personal information and we are not responsible for any loss incurred based upon it. Karvy Private Wealth is only a distributor of securities and financial market products Investment in securities market are subject to market risks, read all the related documents carefully before investing. The investments discussed or recommended here may not be suitable for all investors. Investors must make their own investment decisions based on their specific investment objectives and financial position and using such independent advice, as they believe necessary. The securities quoted are exemplary and are not recommendatory While acting upon any information or analysis mentioned here, investors may please note that neither Karvy nor any person connected with any associated companies of Karvy accepts any liability arising from the use of this information and views mentioned here. The author, directors and other employees of Karvy and its affiliates may hold long or short positions in the above-mentioned companies from time to time. Every employee of Karvy and its associated companies are required to disclose their individual stock holdings and details of trades, if any, that they undertake. The team rendering corporate analysis and investment recommendations are restricted in purchasing/selling of shares or other securities till such a time this recommendation has either been displayed or has been forwarded to clients of Karvy. All employees are further restricted to place orders only through Karvy Stock Broking Ltd Representations made about the performance or activities are not indicative of future results. The information given in this video on tax is for guidance only, and should not be construed as tax advice. Investors are advised to consult their respective tax advisers to understand the specific tax incidence applicable to them. We also expect significant changes in the tax laws once the new Direct Tax Code is in force – this could change the applicability and incidence of tax on investments Karvy Private Wealth (A division of Karvy Stock Broking Limited) operates from within India and is subject to Indian regulations. Karvy Stock Broking Ltd. is a SEBI registered stock broker, depository participant having its offices at: 702, Hallmark Business plaza, Sant Dnyaneshwar Marg, Bandra (East), off Bandra Kurla Complex, Mumbai 400 051 . (Registered office Address: KARVY CENTRE, 8-2-609/K, AVENUE 4, STREET NO.1, BANJARA HILLS, HYDERABAD-500034) SEBI registration No’s:”NSE(CM):INB230770138, NSE(F&O): INF230770138, BSE: INB010770130, BSE(F&O): INF010770131,NCDEX(00236, NSE(CDS):INE230770138, MSEI: Registration number INE 260770138NSDL and CDSL – SEBI Registration No: IN-DP-175-2015PMS Registration No.: INP000001512, Commodities and Currency Date USD /INR GBP /INR EURO /INR YEN/INR Crude Gold (USD/ BBL) (USD/ozt) 27-Jul-18 68.66 89.94 79.84 0.6184 74.29 1224.22 30-Jul-18 68.68 90.11 80.23 0.6185 74.97 1221.45 31-Jul-18 68.55 90.23 80.46 0.6154 74.25 1224.15 01-Aug-18 68.43 89.88 79.94 0.612 72.39 1215.96 02-Aug-18 68.71 89.98 79.81 0.6161 73.45 1207.83 03-Aug-18 68.62 89.44 79.59 0.6157 73.21 1214.90 Change -0.07% -0.56% -0.32% -0.44% -1.45% -0.76%