Download to read offline

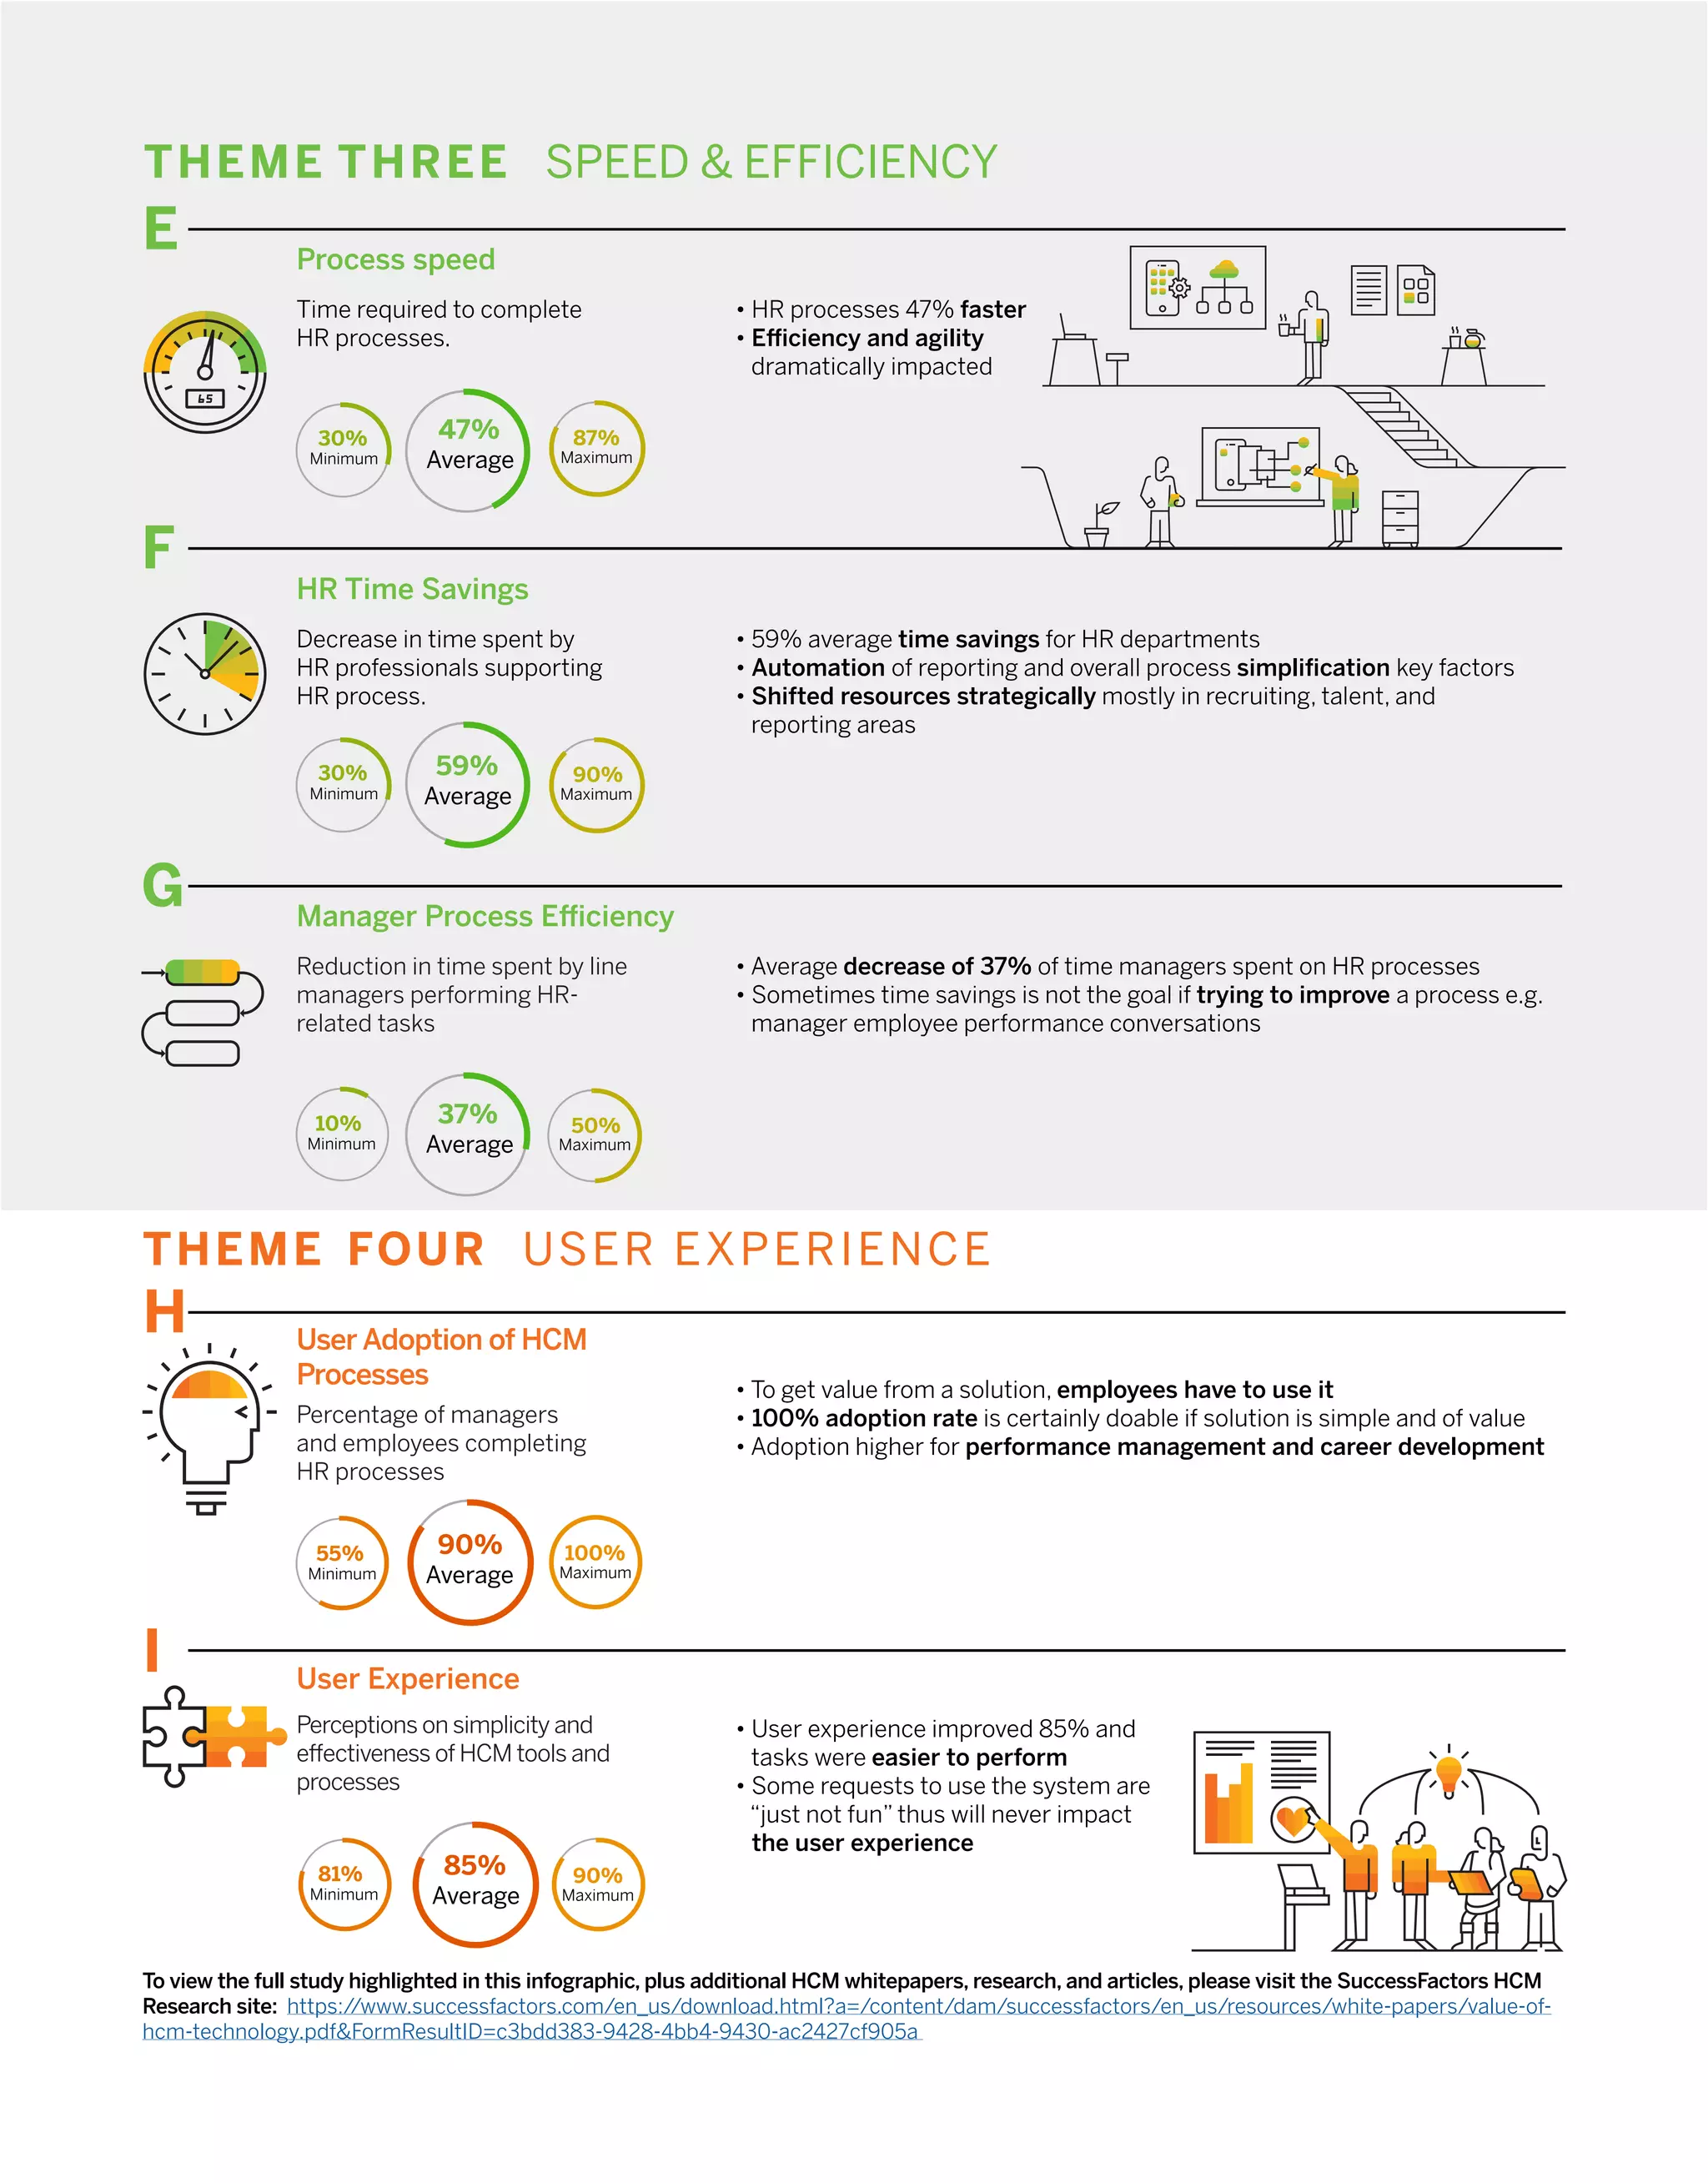

This document summarizes key findings from a study of 105 SAP SuccessFactors customers on the value of human capital management technology. It found that on average customers experienced: - A 12% increase in productivity, a 30% decrease in turnover, and a 34% increase in employee engagement after implementing SuccessFactors solutions. - Data accuracy increased by an average of 61% by moving to a single integrated system. - HR processes became 47% faster and HR time savings averaged 59% through automation and simplification of reporting and processes.


