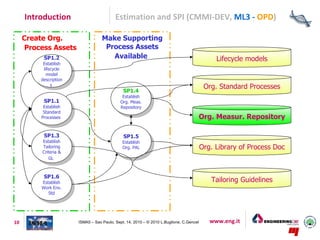
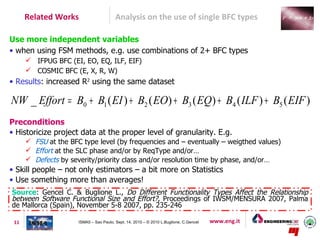
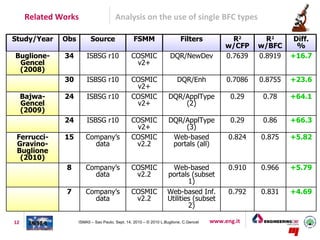
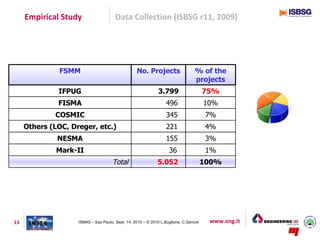
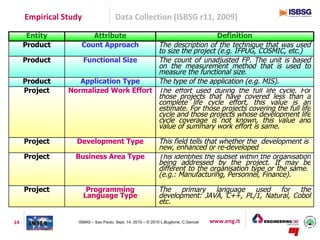
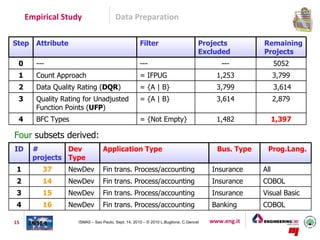
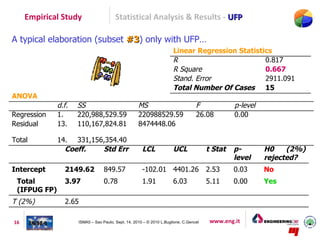
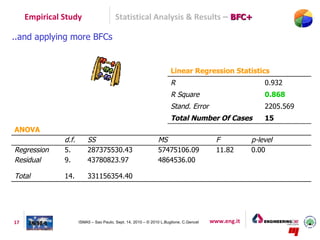
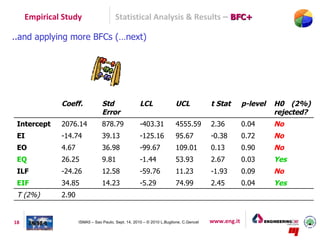
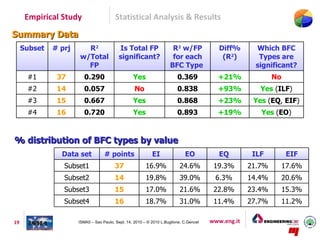
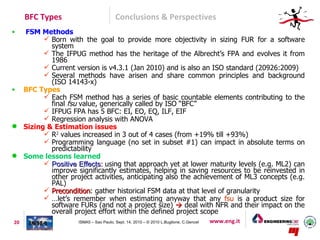
ISMA 5 – 5° IFPUG International Software
  BLEKINGE INSTITUTE OF TECHNOLOGY       Measurement & Analysis Conference
                                         Sao Paulo (Brazil), Sept. 13-15 2010


The Significance of IFPUG Base             An Empirical Study
  Functionality Types in Effort
                     Estimation
                                                        Luigi Buglione, Ph.D.
                                                              Buglione
                                             Proc. Improv. & Measur. Specialist
                                                        Industry Business Unit
                                                                Engineering.IT
                                                       Cigdem Gencel, Ph.D.
                                                                  Gencel
                                                           Assistant Professor
                                               Systems & Software Department
                                               Blekinge Institute of Technology
                                                                          (BTH)
                                                www.eng.it
Engineering              At a glance


 _ The first Italian ICT player
   _ more than 730 M/€ revenues          Research and       PA & HC       Finance      Industry        TELCO      Utilities
                                         Development
   _ 1000 clients
   _ 6,300 IT specialists              System Int. &
                                       Consultancy
                                                        %     46            70            54           80            80

                                       Outsourcing      %     35            10            27           10

                                       Software
                                                        %     19            20            19           10            20


                                                                   ERP                 IT Security             ECM


                                                                                    Plant Management
                                                            Managed Operations                           Broadband & Media
                                                                                          System


                                                     www.eng.it


                                                              www.eng.it
BFC Types                      Goals of the presentation

 G1. Help project managers and estimators to obtain better estimates using
the same historical data
 G2. Propose a list of filtering criteria helping in obtaining better
homogeneous clusters for data analysis and process improvements
 G3. Identify and manage 'not visible' outliers in your own historical data
 G4. Go into a deeper detail when gathering more granular data in your
historical database, that help in consolidating CMMI ML2 goals and achieving
faster ML3 ones with better PALs (Process Asset Libraries)
 G5. Stimulate improvements in your organization supporting more and more
experience by quantitative data


 3               ISMA5 – Sao Paulo, Sept. 14, 2010 – © 2010 L.Buglione, C.Gencel   www.eng.it
BFC Types                          Agenda


•   Introduction
     – A FSM History
     – Estimation Techniques
     – Top 10 Measurement problems
     – Estimation and SPI
•   Related works
•   Empirical Study
     – Data Collection
     – Data Preparation
     – Statistical Analysis & Results
•   Conclusions & Prospects
•   Q&A


4                   ISMA5 – Sao Paulo, Sept. 14, 2010 – © 2010 L.Buglione, C.Gencel   www.eng.it
Introduction                      A FSM History


Source: FSM webpage: http://www.semq.eu/leng/sizestfsm.htm

5                  ISMA5 – Sao Paulo, Sept. 14, 2010 – © 2010 L.Buglione, C.Gencel   www.eng.it
Introduction                      Estimation Techniques


Source: Briand L., Wieczorek I., Resource Estimation in Software Engineering, ISERN
Technical Report 00-05, International Software Engineering Research Network, 2000, URL:
http://isern.iese.de/moodle/

 6                  ISMA5 – Sao Paulo, Sept. 14, 2010 – © 2010 L.Buglione, C.Gencel   www.eng.it
Introduction                      Top-10 Problems in Measurement


1. Betting the Measurement Program on a Single Metric;
2. Trying to Find a Single Metric that Solves All Problems and Has No Evils
3. The Quest for an Industry Standard Set of Measures
4. Not Linking Measures to Behaviour; Failing to Realize that the
   Measures Are the System
5. Assuming that One Set of Measures Will Be Good for "All Time"
6. Measuring the Wrong IT Output
7. Measuring in Business Terms, but the Wrong Business Terms
8. Failure to Quantify in Business Terms; Failure to Plan for Benefits
9. Neglecting the Full Range of IT-Related Outcomes
10. Lack of Commitment; Treating Measurement As a Non-Value-Added
   Add-On
Source: Rubin H.A., The Top 10 Mistakes in IT Measurement, IT Metrics Strategies, Vol.II,
No.11, November 1996, URL:
http://web.archive.org/web/20030119070257/www.cutter.com/benchmark/1996toc.htm

 7                  ISMA5 – Sao Paulo, Sept. 14, 2010 – © 2010 L.Buglione, C.Gencel   www.eng.it
Introduction                      Estimation and SPI (CMMI-DEV, ML2)

MA – Measurement & Analysis                                                           PP – Project Planning


                                                  SG1
                                              Establish                                  Planning Data
                                             Estimates
 Measurement
    Data
                                                                 SG2
                                                           Develop a                              Project Plans
                                                          Project Plan


            An agreed-to set
            of requirements                                            SG3 Obtain
                                                                     Committment
                                                                      to the Plan


      REQM – Requirement Mgmt                                          PMC – Project Monitoring & Control

8                  ISMA5 – Sao Paulo, Sept. 14, 2010 – © 2010 L.Buglione, C.Gencel   www.eng.it
Introduction                           Estimation and SPI (CMMI-DEV, ML3)

                                                     n’s
                                               izatio    d
                                        O rgan eeds an
Senior Management                          es s n es
                                       proc bjectiv
                                            o

           Organization’s
           business objectives                                                         Training for projects and support
                                                             OT Org.                   groups in std process and assets

                                                              Training
                                                                                                  Tra
                                                                                                      i   nin
                                                                                                             g   ne
                                                                                                                    ed
                                                                                                                       s
                                                                    Std processes and
                                                                    other assets
                                                                                             Std process,
                                                                                                 work
                                                                                           environment std,
      OPF Org.                                               OPD Org.                      and other assets                 Project Mgmt,
       Process                                                Process                                                         Support &
        Focus               Resources and
                             Coordination
                                                             Definition                       Improvement
                                                                                           Information (e.g.
                                                                                                                           Engineering PAs
                                                                                            lessons learned,
                                                                                             data, artifacts)

                                                    Process Improvement proposals;
                                                participation in definining, assessing, and
                                                            deploying processes


 9                       ISMA5 – Sao Paulo, Sept. 14, 2010 – © 2010 L.Buglione, C.Gencel        www.eng.it
Introduction                          Estimation and SPI (CMMI-DEV, ML3 - OPD)

     Create Org.                    Make Supporting
      Process Assets                 Process Assets
           SP1.2                       Available                                               Lifecycle models
           Establish
           lifecycle
             model
          description
               s
                                                                                           Org. Standard Processes
                                               SP1.4
                                              Establish
           SP1.1                             Org. Meas.
           Establish                         Repository
           Standard
          Processes                                                                       Org. Measur. Repository

           SP1.3                               SP1.5
          Establish                            Establish
          Tailoring                            Org. PAL                                   Org. Library of Process Doc
          Criteria &
             GL


           SP1.6
          Establish                                                                          Tailoring Guidelines
          Work Env.
             Std


10                      ISMA5 – Sao Paulo, Sept. 14, 2010 – © 2010 L.Buglione, C.Gencel      www.eng.it
Related Works                      Analysis on the use of single BFC types

Use more independent variables
• when using FSM methods, e.g. use combinations of 2+ BFC types
       IFPUG BFC (EI, EO, EQ, ILF, EIF)
       COSMIC BFC (E, X, R, W)
• Results: increased R2 using the same dataset

NW _ Effort = B0 + B1 ( EI ) + B2 ( EO) + B3 ( EQ) + B4 ( ILF ) + B5 ( EIF )
Preconditions
• Historicize project data at the proper level of granularity. E.g.
       FSU at the BFC type level (by frequencies and – eventually – weigthed values)
       Effort at the SLC phase and/or by ReqType and/or…
       Defects by severity/priority class and/or resolution time by phase, and/or…
• Skill people – not only estimators – a bit more on Statistics
• Use something more than averages!
Source: Gencel C. & Buglione L., Do Different Functionality Types Affect the Relationship
between Software Functional Size and Effort?, Proceedings of IWSM/MENSURA 2007, Palma
de Mallorca (Spain), November 5-8 2007, pp. 235-246

 11                   ISMA5 – Sao Paulo, Sept. 14, 2010 – © 2010 L.Buglione, C.Gencel   www.eng.it
Related Works                     Analysis on the use of single BFC types

Study/Year     Obs         Source                FSMM                     Filters             R2       R2      Diff.
                                                                                            w/CFP    w/BFC      %
Buglione-      34        ISBSG r10              COSMIC               DQR/NewDev             0.7639   0.8919   +16.7
 Gencel                                          v2+
 (2008)
               30        ISBSG r10              COSMIC                  DQR/Enh             0.7086   0.8755   +23.6
                                                 v2+
     Bajwa-    24        ISBSG r10              COSMIC              DQR/ApplType             0.29     0.78    +64.1
     Gencel                                      v2+                    (2)
     (2009)
               24        ISBSG r10              COSMIC              DQR/ApplType             0.29     0.86    +66.3
                                                 v2+                     (3)
 Ferrucci-     15       Company’s               COSMIC               Web-based               0.824   0.875    +5.82
 Gravino-                 data                   v2.2                portals (all)
 Buglione
  (2010)
                8       Company’s               COSMIC               Web-based               0.910   0.966    +5.79
                          data                   v2.2              portals (subset
                                                                           1)
                7       Company’s               COSMIC             Web-based Inf.            0.792   0.831    +4.69
                          data                   v2.2              Utilities (subset
                                                                           2)

12                   ISMA5 – Sao Paulo, Sept. 14, 2010 – © 2010 L.Buglione, C.Gencel   www.eng.it
Empirical Study                   Data Collection (ISBSG r11, 2009)


               FSMM                               No. Projects                   % of the
                                                                                 projects
              IFPUG                                          3.799                    75%
              FISMA                                              496                  10%
             COSMIC                                              345                   7%
     Others (LOC, Dreger, etc.)                                  221                   4%
              NESMA                                              155                   3%
              Mark-II                                              36                  1%
                                     Total                   5.052                    100%


13                  ISMA5 – Sao Paulo, Sept. 14, 2010 – © 2010 L.Buglione, C.Gencel    www.eng.it
Empirical Study                  Data Collection (ISBSG r11, 2009)

      Entity           Attribute                           Definition
     Product        Count Approach     The description of the technique that was used
                                       to size the project (e.g. IFPUG, COSMIC, etc.)
     Product        Functional Size    The count of unadjusted FP. The unit is based
                                       on the measurement method that is used to
                                       measure the functional size.
     Product       Application Type    The type of the application (e.g. MIS).
     Project    Normalized Work Effort The effort used during the full life cycle. For
                                       those projects that have covered less than a
                                       complete life cycle effort, this value is an
                                       estimate. For those projects covering the full life
                                       cycle and those projects whose development life
                                       cycle coverage is not known, this value and
                                       value of summary work effort is same.

     Project      Development Type                           This field tells that whether the development is
                                                             new, enhanced or re-developed
     Project      Business Area Type                         This identifies the subset within the organisation
                                                             being addressed by the project. It may be
                                                             different to the organisation type or the same.
                                                             (e.g.: Manufacturing, Personnel, Finance).

     Project            Programming                          The primary language used for the
                       Language Type                         development: JAVA, C++, PL/1, Natural, Cobol
                                                             etc.

14                 ISMA5 – Sao Paulo, Sept. 14, 2010 – © 2010 L.Buglione, C.Gencel   www.eng.it
Empirical Study                    Data Preparation

Step    Attribute                                    Filter                        Projects          Remaining
                                                                                   Excluded          Projects
 0      ---                                          ---                                  ---              5052
 1      Count Approach                               = IFPUG                             1,253             3,799
 2      Data Quality Rating (DQR)                    = {A | B}                           3,799             3,614
 3      Quality Rating for Unadjusted                = {A | B}                           3,614             2,879
        Function Points (UFP)
 4      BFC Types                                    = {Not Empty}                       1,482             1,397

Four subsets derived:
ID     #        Dev              Application Type                                        Bus. Type     Prog.Lang.
       projects Type
 1        37      NewDev         Fin trans. Process/accounting                         Insurance     All
 2        14      NewDev         Fin trans. Process/accounting                         Insurance     COBOL
 3        15      NewDev         Fin trans. Process/accounting                         Insurance     Visual Basic
 4        16      NewDev         Fin trans. Process/accounting                         Banking       COBOL

15                   ISMA5 – Sao Paulo, Sept. 14, 2010 – © 2010 L.Buglione, C.Gencel   www.eng.it
Empirical Study                    Statistical Analysis & Results - UFP

A typical elaboration (subset #3) only with UFP…
                              #3
                                                             Linear Regression Statistics
                                                             R                         0.817
                                                             R Square                  0.667
                                                             Stand. Error              2911.091
                                                             Total Number Of Cases 15
ANOVA                                                                         
              d.f.   SS                             MS              F        p-level
Regression    1.     220,988,529.59                 220988529.59    26.08    0.00
Residual      13.    110,167,824.81                 8474448.06

Total         14. 331,156,354.40                                                                   
                Coeff.   Std Err                        LCL           UCL              t Stat     p-      H0    (2%)
                                                                                                  level   rejected?
Intercept       2149.62           849.57                -102.01 4401.26                2.53       0.03    No
 Total          3.97              0.78                  1.91          6.03             5.11       0.00    Yes
 (IFPUG FP)
T (2%)          2.65                                                                                       

16                   ISMA5 – Sao Paulo, Sept. 14, 2010 – © 2010 L.Buglione, C.Gencel       www.eng.it
Empirical Study                     Statistical Analysis & Results – BFC+

..and applying more BFCs


                                                                      Linear Regression Statistics
                                                                      R                                  0.932
                                                                      R Square                           0.868
                                                                      Stand. Error                       2205.569
                                                                      Total Number Of Cases              15
ANOVA                                                                                                 
               d.f.       SS                                   MS                         F          p-level
Regression     5.         287375530.43                         57475106.09                11.82      0.00
Residual       9.         43780823.97                          4864536.00

Total          14.        331156354.40                                                                


17                    ISMA5 – Sao Paulo, Sept. 14, 2010 – © 2010 L.Buglione, C.Gencel   www.eng.it
Empirical Study                    Statistical Analysis & Results – BFC+

..and applying more BFCs (…next)


              Coeff.             Std                 LCL               UCL             t Stat       p-level   H0 (2%)
                                 Error                                                                        rejected?
 Intercept    2076.14            878.79              -403.31           4555.59         2.36         0.04      No
 EI           -14.74             39.13               -125.16           95.67           -0.38        0.72      No
 EO           4.67               36.98               -99.67            109.01          0.13         0.90      No
 EQ           26.25              9.81                -1.44             53.93           2.67         0.03      Yes
 ILF          -24.26             12.58               -59.76            11.23           -1.93        0.09      No
 EIF          34.85              14.23               -5.29             74.99           2.45         0.04      Yes
 T (2%)       2.90                                                                                             


18                   ISMA5 – Sao Paulo, Sept. 14, 2010 – © 2010 L.Buglione, C.Gencel   www.eng.it
Empirical Study                    Statistical Analysis & Results
Summary Data
     Subset   # prj     R2                 Is Total FP                 R2 w/FP             Diff%       Which BFC
                      w/Total              significant?                for each             (R2)        Types are
                        FP                                            BFC Type                         significant?
      #1       37        0.290                    Yes                    0.369            +21%               No
      #2       14        0.057                     No                    0.838            +93%          Yes (ILF)
      #3       15        0.667                    Yes                    0.868            +23%        Yes (EQ, EIF)
      #4       16        0.720                    Yes                    0.893            +19%          Yes (EO)


% distribution of BFC types by value
                Data set           # points                 EI               EO            EQ         ILF          EIF
                 Subset1                37               16.9%             24.6%         19.3%       21.7%        17.6%
                 Subset2                14               19.8%             39.0%         6.3%        14.4%        20.6%
                 Subset3                15               17.0%             21.6%         22.8%       23.4%        15.3%
                 Subset4                16               18.7%             31.0%         11.4%       27.7%        11.2%

19                    ISMA5 – Sao Paulo, Sept. 14, 2010 – © 2010 L.Buglione, C.Gencel   www.eng.it
BFC Types                         Conclusions & Perspectives
• FSM Methods
         Born with the goal to provide more objectivity in sizing FUR for a software
          system
         The IFPUG method has the heritage of the Albrecht’s FPA and evolves it from
          1986
         Current version is v4.3.1 (Jan 2010) and is also an ISO standard (20926:2009)
         Several methods have arisen and share common principles and background
          (ISO 14143-x)
• BFC Types
         Each FSM method has a series of basic countable elements contributing to the
          final fsu value, generically called by ISO “BFC”
         IFPUG FPA has 5 BFC: EI, EO, EQ, ILF, EIF
         Regression analysis with ANOVA
 Sizing & Estimation issues
         R2 values increased in 3 out of 4 cases (from +19% till +93%)
         Programming language (no set in subset #1) can impact in absolute terms on
          predictability
 Some lessons learned
         Positive Effects: using that approach yet at lower maturity levels (e.g. ML2) can
          improve significantly estimates, helping in saving resources to be reinvested in
          other project activities, anticipating also the achievement of ML3 concepts (e.g.
          PAL)
         Precondition: gather historical FSM data at that level of granularity
          Precondition
         …let’s remember when estimating anyway that any fsu is a product size for
          software FURs (and not a project size)  deal with NFR and their impact on the
          overall project effort within the defined project scope
20                  ISMA5 – Sao Paulo, Sept. 14, 2010 – © 2010 L.Buglione, C.Gencel   www.eng.it
BFC Types                      Q&A


           Obrigado pela sua atenção!
           Thanks for your attention!
21               ISMA5 – Sao Paulo, Sept. 14, 2010 – © 2010 L.Buglione, C.Gencel   www.eng.it
Thanks for your Attention !


     We care of your problems and we have in mind a solution

                          Luigi Buglione                                                          Cigdem Gencel


       Industry, Services & Infrastructures                                Blekinge Institute of Technology

      Via R.Morandi 32   Tel. +39-06.8307.4472                            SE-371 79 Karlskrona   Tel. +46 -455-385736
          00148 Roma     Fax +39-06.8307.4200                                          Sweden    Fax +46 -455 38 50 57
                         Cell. +39 -335.1214813

         www.eng.it      luigi.buglione@eng.it                              www.bth.se           cigdem.gencel@bth.se


22      ISMA5 – Sao Paulo, Sept. 14, 2010 – © 2010 L.Buglione, C.Gencel        www.eng.it

The Significance of IFPUG in Effort Estimation Base Functionality Types

  • 1.
    ISMA 5 –5° IFPUG International Software BLEKINGE INSTITUTE OF TECHNOLOGY Measurement & Analysis Conference Sao Paulo (Brazil), Sept. 13-15 2010 The Significance of IFPUG Base An Empirical Study Functionality Types in Effort Estimation Luigi Buglione, Ph.D. Buglione Proc. Improv. & Measur. Specialist Industry Business Unit Engineering.IT Cigdem Gencel, Ph.D. Gencel Assistant Professor Systems & Software Department Blekinge Institute of Technology (BTH) www.eng.it
  • 2.
    Engineering At a glance _ The first Italian ICT player _ more than 730 M/€ revenues Research and PA & HC Finance Industry TELCO Utilities Development _ 1000 clients _ 6,300 IT specialists System Int. & Consultancy % 46 70 54 80 80 Outsourcing % 35 10 27 10 Software % 19 20 19 10 20 ERP IT Security ECM Plant Management Managed Operations Broadband & Media System www.eng.it www.eng.it
  • 3.
    BFC Types Goals of the presentation  G1. Help project managers and estimators to obtain better estimates using the same historical data  G2. Propose a list of filtering criteria helping in obtaining better homogeneous clusters for data analysis and process improvements  G3. Identify and manage 'not visible' outliers in your own historical data  G4. Go into a deeper detail when gathering more granular data in your historical database, that help in consolidating CMMI ML2 goals and achieving faster ML3 ones with better PALs (Process Asset Libraries)  G5. Stimulate improvements in your organization supporting more and more experience by quantitative data 3 ISMA5 – Sao Paulo, Sept. 14, 2010 – © 2010 L.Buglione, C.Gencel www.eng.it
  • 4.
    BFC Types Agenda • Introduction – A FSM History – Estimation Techniques – Top 10 Measurement problems – Estimation and SPI • Related works • Empirical Study – Data Collection – Data Preparation – Statistical Analysis & Results • Conclusions & Prospects • Q&A 4 ISMA5 – Sao Paulo, Sept. 14, 2010 – © 2010 L.Buglione, C.Gencel www.eng.it
  • 5.
    Introduction A FSM History Source: FSM webpage: http://www.semq.eu/leng/sizestfsm.htm 5 ISMA5 – Sao Paulo, Sept. 14, 2010 – © 2010 L.Buglione, C.Gencel www.eng.it
  • 6.
    Introduction Estimation Techniques Source: Briand L., Wieczorek I., Resource Estimation in Software Engineering, ISERN Technical Report 00-05, International Software Engineering Research Network, 2000, URL: http://isern.iese.de/moodle/ 6 ISMA5 – Sao Paulo, Sept. 14, 2010 – © 2010 L.Buglione, C.Gencel www.eng.it
  • 7.
    Introduction Top-10 Problems in Measurement 1. Betting the Measurement Program on a Single Metric; 2. Trying to Find a Single Metric that Solves All Problems and Has No Evils 3. The Quest for an Industry Standard Set of Measures 4. Not Linking Measures to Behaviour; Failing to Realize that the Measures Are the System 5. Assuming that One Set of Measures Will Be Good for "All Time" 6. Measuring the Wrong IT Output 7. Measuring in Business Terms, but the Wrong Business Terms 8. Failure to Quantify in Business Terms; Failure to Plan for Benefits 9. Neglecting the Full Range of IT-Related Outcomes 10. Lack of Commitment; Treating Measurement As a Non-Value-Added Add-On Source: Rubin H.A., The Top 10 Mistakes in IT Measurement, IT Metrics Strategies, Vol.II, No.11, November 1996, URL: http://web.archive.org/web/20030119070257/www.cutter.com/benchmark/1996toc.htm 7 ISMA5 – Sao Paulo, Sept. 14, 2010 – © 2010 L.Buglione, C.Gencel www.eng.it
  • 8.
    Introduction Estimation and SPI (CMMI-DEV, ML2) MA – Measurement & Analysis PP – Project Planning SG1 Establish Planning Data Estimates Measurement Data SG2 Develop a Project Plans Project Plan An agreed-to set of requirements SG3 Obtain Committment to the Plan REQM – Requirement Mgmt PMC – Project Monitoring & Control 8 ISMA5 – Sao Paulo, Sept. 14, 2010 – © 2010 L.Buglione, C.Gencel www.eng.it
  • 9.
    Introduction Estimation and SPI (CMMI-DEV, ML3) n’s izatio d O rgan eeds an Senior Management es s n es proc bjectiv o Organization’s business objectives Training for projects and support OT Org. groups in std process and assets Training Tra i nin g ne ed s Std processes and other assets Std process, work environment std, OPF Org. OPD Org. and other assets Project Mgmt, Process Process Support & Focus Resources and Coordination Definition Improvement Information (e.g. Engineering PAs lessons learned, data, artifacts) Process Improvement proposals; participation in definining, assessing, and deploying processes 9 ISMA5 – Sao Paulo, Sept. 14, 2010 – © 2010 L.Buglione, C.Gencel www.eng.it
  • 10.
    Introduction Estimation and SPI (CMMI-DEV, ML3 - OPD) Create Org. Make Supporting Process Assets Process Assets SP1.2 Available Lifecycle models Establish lifecycle model description s Org. Standard Processes SP1.4 Establish SP1.1 Org. Meas. Establish Repository Standard Processes Org. Measur. Repository SP1.3 SP1.5 Establish Establish Tailoring Org. PAL Org. Library of Process Doc Criteria & GL SP1.6 Establish Tailoring Guidelines Work Env. Std 10 ISMA5 – Sao Paulo, Sept. 14, 2010 – © 2010 L.Buglione, C.Gencel www.eng.it
  • 11.
    Related Works Analysis on the use of single BFC types Use more independent variables • when using FSM methods, e.g. use combinations of 2+ BFC types  IFPUG BFC (EI, EO, EQ, ILF, EIF)  COSMIC BFC (E, X, R, W) • Results: increased R2 using the same dataset NW _ Effort = B0 + B1 ( EI ) + B2 ( EO) + B3 ( EQ) + B4 ( ILF ) + B5 ( EIF ) Preconditions • Historicize project data at the proper level of granularity. E.g.  FSU at the BFC type level (by frequencies and – eventually – weigthed values)  Effort at the SLC phase and/or by ReqType and/or…  Defects by severity/priority class and/or resolution time by phase, and/or… • Skill people – not only estimators – a bit more on Statistics • Use something more than averages! Source: Gencel C. & Buglione L., Do Different Functionality Types Affect the Relationship between Software Functional Size and Effort?, Proceedings of IWSM/MENSURA 2007, Palma de Mallorca (Spain), November 5-8 2007, pp. 235-246 11 ISMA5 – Sao Paulo, Sept. 14, 2010 – © 2010 L.Buglione, C.Gencel www.eng.it
  • 12.
    Related Works Analysis on the use of single BFC types Study/Year Obs Source FSMM Filters R2 R2 Diff. w/CFP w/BFC % Buglione- 34 ISBSG r10 COSMIC DQR/NewDev 0.7639 0.8919 +16.7 Gencel v2+ (2008) 30 ISBSG r10 COSMIC DQR/Enh 0.7086 0.8755 +23.6 v2+ Bajwa- 24 ISBSG r10 COSMIC DQR/ApplType 0.29 0.78 +64.1 Gencel v2+ (2) (2009) 24 ISBSG r10 COSMIC DQR/ApplType 0.29 0.86 +66.3 v2+ (3) Ferrucci- 15 Company’s COSMIC Web-based 0.824 0.875 +5.82 Gravino- data v2.2 portals (all) Buglione (2010) 8 Company’s COSMIC Web-based 0.910 0.966 +5.79 data v2.2 portals (subset 1) 7 Company’s COSMIC Web-based Inf. 0.792 0.831 +4.69 data v2.2 Utilities (subset 2) 12 ISMA5 – Sao Paulo, Sept. 14, 2010 – © 2010 L.Buglione, C.Gencel www.eng.it
  • 13.
    Empirical Study Data Collection (ISBSG r11, 2009) FSMM No. Projects % of the projects IFPUG 3.799 75% FISMA 496 10% COSMIC 345 7% Others (LOC, Dreger, etc.) 221 4% NESMA 155 3% Mark-II 36 1% Total 5.052 100% 13 ISMA5 – Sao Paulo, Sept. 14, 2010 – © 2010 L.Buglione, C.Gencel www.eng.it
  • 14.
    Empirical Study Data Collection (ISBSG r11, 2009) Entity Attribute Definition Product Count Approach The description of the technique that was used to size the project (e.g. IFPUG, COSMIC, etc.) Product Functional Size The count of unadjusted FP. The unit is based on the measurement method that is used to measure the functional size. Product Application Type The type of the application (e.g. MIS). Project Normalized Work Effort The effort used during the full life cycle. For those projects that have covered less than a complete life cycle effort, this value is an estimate. For those projects covering the full life cycle and those projects whose development life cycle coverage is not known, this value and value of summary work effort is same. Project Development Type This field tells that whether the development is new, enhanced or re-developed Project Business Area Type This identifies the subset within the organisation being addressed by the project. It may be different to the organisation type or the same. (e.g.: Manufacturing, Personnel, Finance). Project Programming The primary language used for the Language Type development: JAVA, C++, PL/1, Natural, Cobol etc. 14 ISMA5 – Sao Paulo, Sept. 14, 2010 – © 2010 L.Buglione, C.Gencel www.eng.it
  • 15.
    Empirical Study Data Preparation Step Attribute Filter Projects Remaining Excluded Projects 0 --- --- --- 5052 1 Count Approach = IFPUG 1,253 3,799 2 Data Quality Rating (DQR) = {A | B} 3,799 3,614 3 Quality Rating for Unadjusted = {A | B} 3,614 2,879 Function Points (UFP) 4 BFC Types = {Not Empty} 1,482 1,397 Four subsets derived: ID # Dev Application Type Bus. Type Prog.Lang. projects Type 1 37 NewDev Fin trans. Process/accounting Insurance All 2 14 NewDev Fin trans. Process/accounting Insurance COBOL 3 15 NewDev Fin trans. Process/accounting Insurance Visual Basic 4 16 NewDev Fin trans. Process/accounting Banking COBOL 15 ISMA5 – Sao Paulo, Sept. 14, 2010 – © 2010 L.Buglione, C.Gencel www.eng.it
  • 16.
    Empirical Study Statistical Analysis & Results - UFP A typical elaboration (subset #3) only with UFP… #3 Linear Regression Statistics R 0.817 R Square 0.667 Stand. Error 2911.091 Total Number Of Cases 15 ANOVA             d.f. SS MS F p-level Regression 1. 220,988,529.59 220988529.59 26.08 0.00 Residual 13. 110,167,824.81 8474448.06 Total 14. 331,156,354.40         Coeff. Std Err LCL UCL t Stat p- H0 (2%) level rejected? Intercept 2149.62 849.57 -102.01 4401.26 2.53 0.03 No Total 3.97 0.78 1.91 6.03 5.11 0.00 Yes (IFPUG FP) T (2%) 2.65             16 ISMA5 – Sao Paulo, Sept. 14, 2010 – © 2010 L.Buglione, C.Gencel www.eng.it
  • 17.
    Empirical Study Statistical Analysis & Results – BFC+ ..and applying more BFCs Linear Regression Statistics R 0.932 R Square 0.868 Stand. Error 2205.569 Total Number Of Cases 15 ANOVA             d.f. SS MS F p-level Regression 5. 287375530.43 57475106.09 11.82 0.00 Residual 9. 43780823.97 4864536.00 Total 14. 331156354.40       17 ISMA5 – Sao Paulo, Sept. 14, 2010 – © 2010 L.Buglione, C.Gencel www.eng.it
  • 18.
    Empirical Study Statistical Analysis & Results – BFC+ ..and applying more BFCs (…next)   Coeff. Std LCL UCL t Stat p-level H0 (2%) Error rejected? Intercept 2076.14 878.79 -403.31 4555.59 2.36 0.04 No EI -14.74 39.13 -125.16 95.67 -0.38 0.72 No EO 4.67 36.98 -99.67 109.01 0.13 0.90 No EQ 26.25 9.81 -1.44 53.93 2.67 0.03 Yes ILF -24.26 12.58 -59.76 11.23 -1.93 0.09 No EIF 34.85 14.23 -5.29 74.99 2.45 0.04 Yes T (2%) 2.90             18 ISMA5 – Sao Paulo, Sept. 14, 2010 – © 2010 L.Buglione, C.Gencel www.eng.it
  • 19.
    Empirical Study Statistical Analysis & Results Summary Data Subset # prj R2 Is Total FP R2 w/FP Diff% Which BFC w/Total significant? for each (R2) Types are FP BFC Type significant? #1 37 0.290 Yes 0.369 +21% No #2 14 0.057 No 0.838 +93% Yes (ILF) #3 15 0.667 Yes 0.868 +23% Yes (EQ, EIF) #4 16 0.720 Yes 0.893 +19% Yes (EO) % distribution of BFC types by value Data set # points EI EO EQ ILF EIF Subset1 37 16.9% 24.6% 19.3% 21.7% 17.6% Subset2 14 19.8% 39.0% 6.3% 14.4% 20.6% Subset3 15 17.0% 21.6% 22.8% 23.4% 15.3% Subset4 16 18.7% 31.0% 11.4% 27.7% 11.2% 19 ISMA5 – Sao Paulo, Sept. 14, 2010 – © 2010 L.Buglione, C.Gencel www.eng.it
  • 20.
    BFC Types Conclusions & Perspectives • FSM Methods  Born with the goal to provide more objectivity in sizing FUR for a software system  The IFPUG method has the heritage of the Albrecht’s FPA and evolves it from 1986  Current version is v4.3.1 (Jan 2010) and is also an ISO standard (20926:2009)  Several methods have arisen and share common principles and background (ISO 14143-x) • BFC Types  Each FSM method has a series of basic countable elements contributing to the final fsu value, generically called by ISO “BFC”  IFPUG FPA has 5 BFC: EI, EO, EQ, ILF, EIF  Regression analysis with ANOVA  Sizing & Estimation issues  R2 values increased in 3 out of 4 cases (from +19% till +93%)  Programming language (no set in subset #1) can impact in absolute terms on predictability  Some lessons learned  Positive Effects: using that approach yet at lower maturity levels (e.g. ML2) can improve significantly estimates, helping in saving resources to be reinvested in other project activities, anticipating also the achievement of ML3 concepts (e.g. PAL)  Precondition: gather historical FSM data at that level of granularity Precondition  …let’s remember when estimating anyway that any fsu is a product size for software FURs (and not a project size)  deal with NFR and their impact on the overall project effort within the defined project scope 20 ISMA5 – Sao Paulo, Sept. 14, 2010 – © 2010 L.Buglione, C.Gencel www.eng.it
  • 21.
    BFC Types Q&A Obrigado pela sua atenção! Thanks for your attention! 21 ISMA5 – Sao Paulo, Sept. 14, 2010 – © 2010 L.Buglione, C.Gencel www.eng.it
  • 22.
    Thanks for yourAttention ! We care of your problems and we have in mind a solution Luigi Buglione Cigdem Gencel Industry, Services & Infrastructures Blekinge Institute of Technology Via R.Morandi 32 Tel. +39-06.8307.4472 SE-371 79 Karlskrona Tel. +46 -455-385736 00148 Roma Fax +39-06.8307.4200 Sweden Fax +46 -455 38 50 57 Cell. +39 -335.1214813 www.eng.it luigi.buglione@eng.it www.bth.se cigdem.gencel@bth.se 22 ISMA5 – Sao Paulo, Sept. 14, 2010 – © 2010 L.Buglione, C.Gencel www.eng.it