Downloaded 28 times


![THE GLOBAL AIDS CRISIS
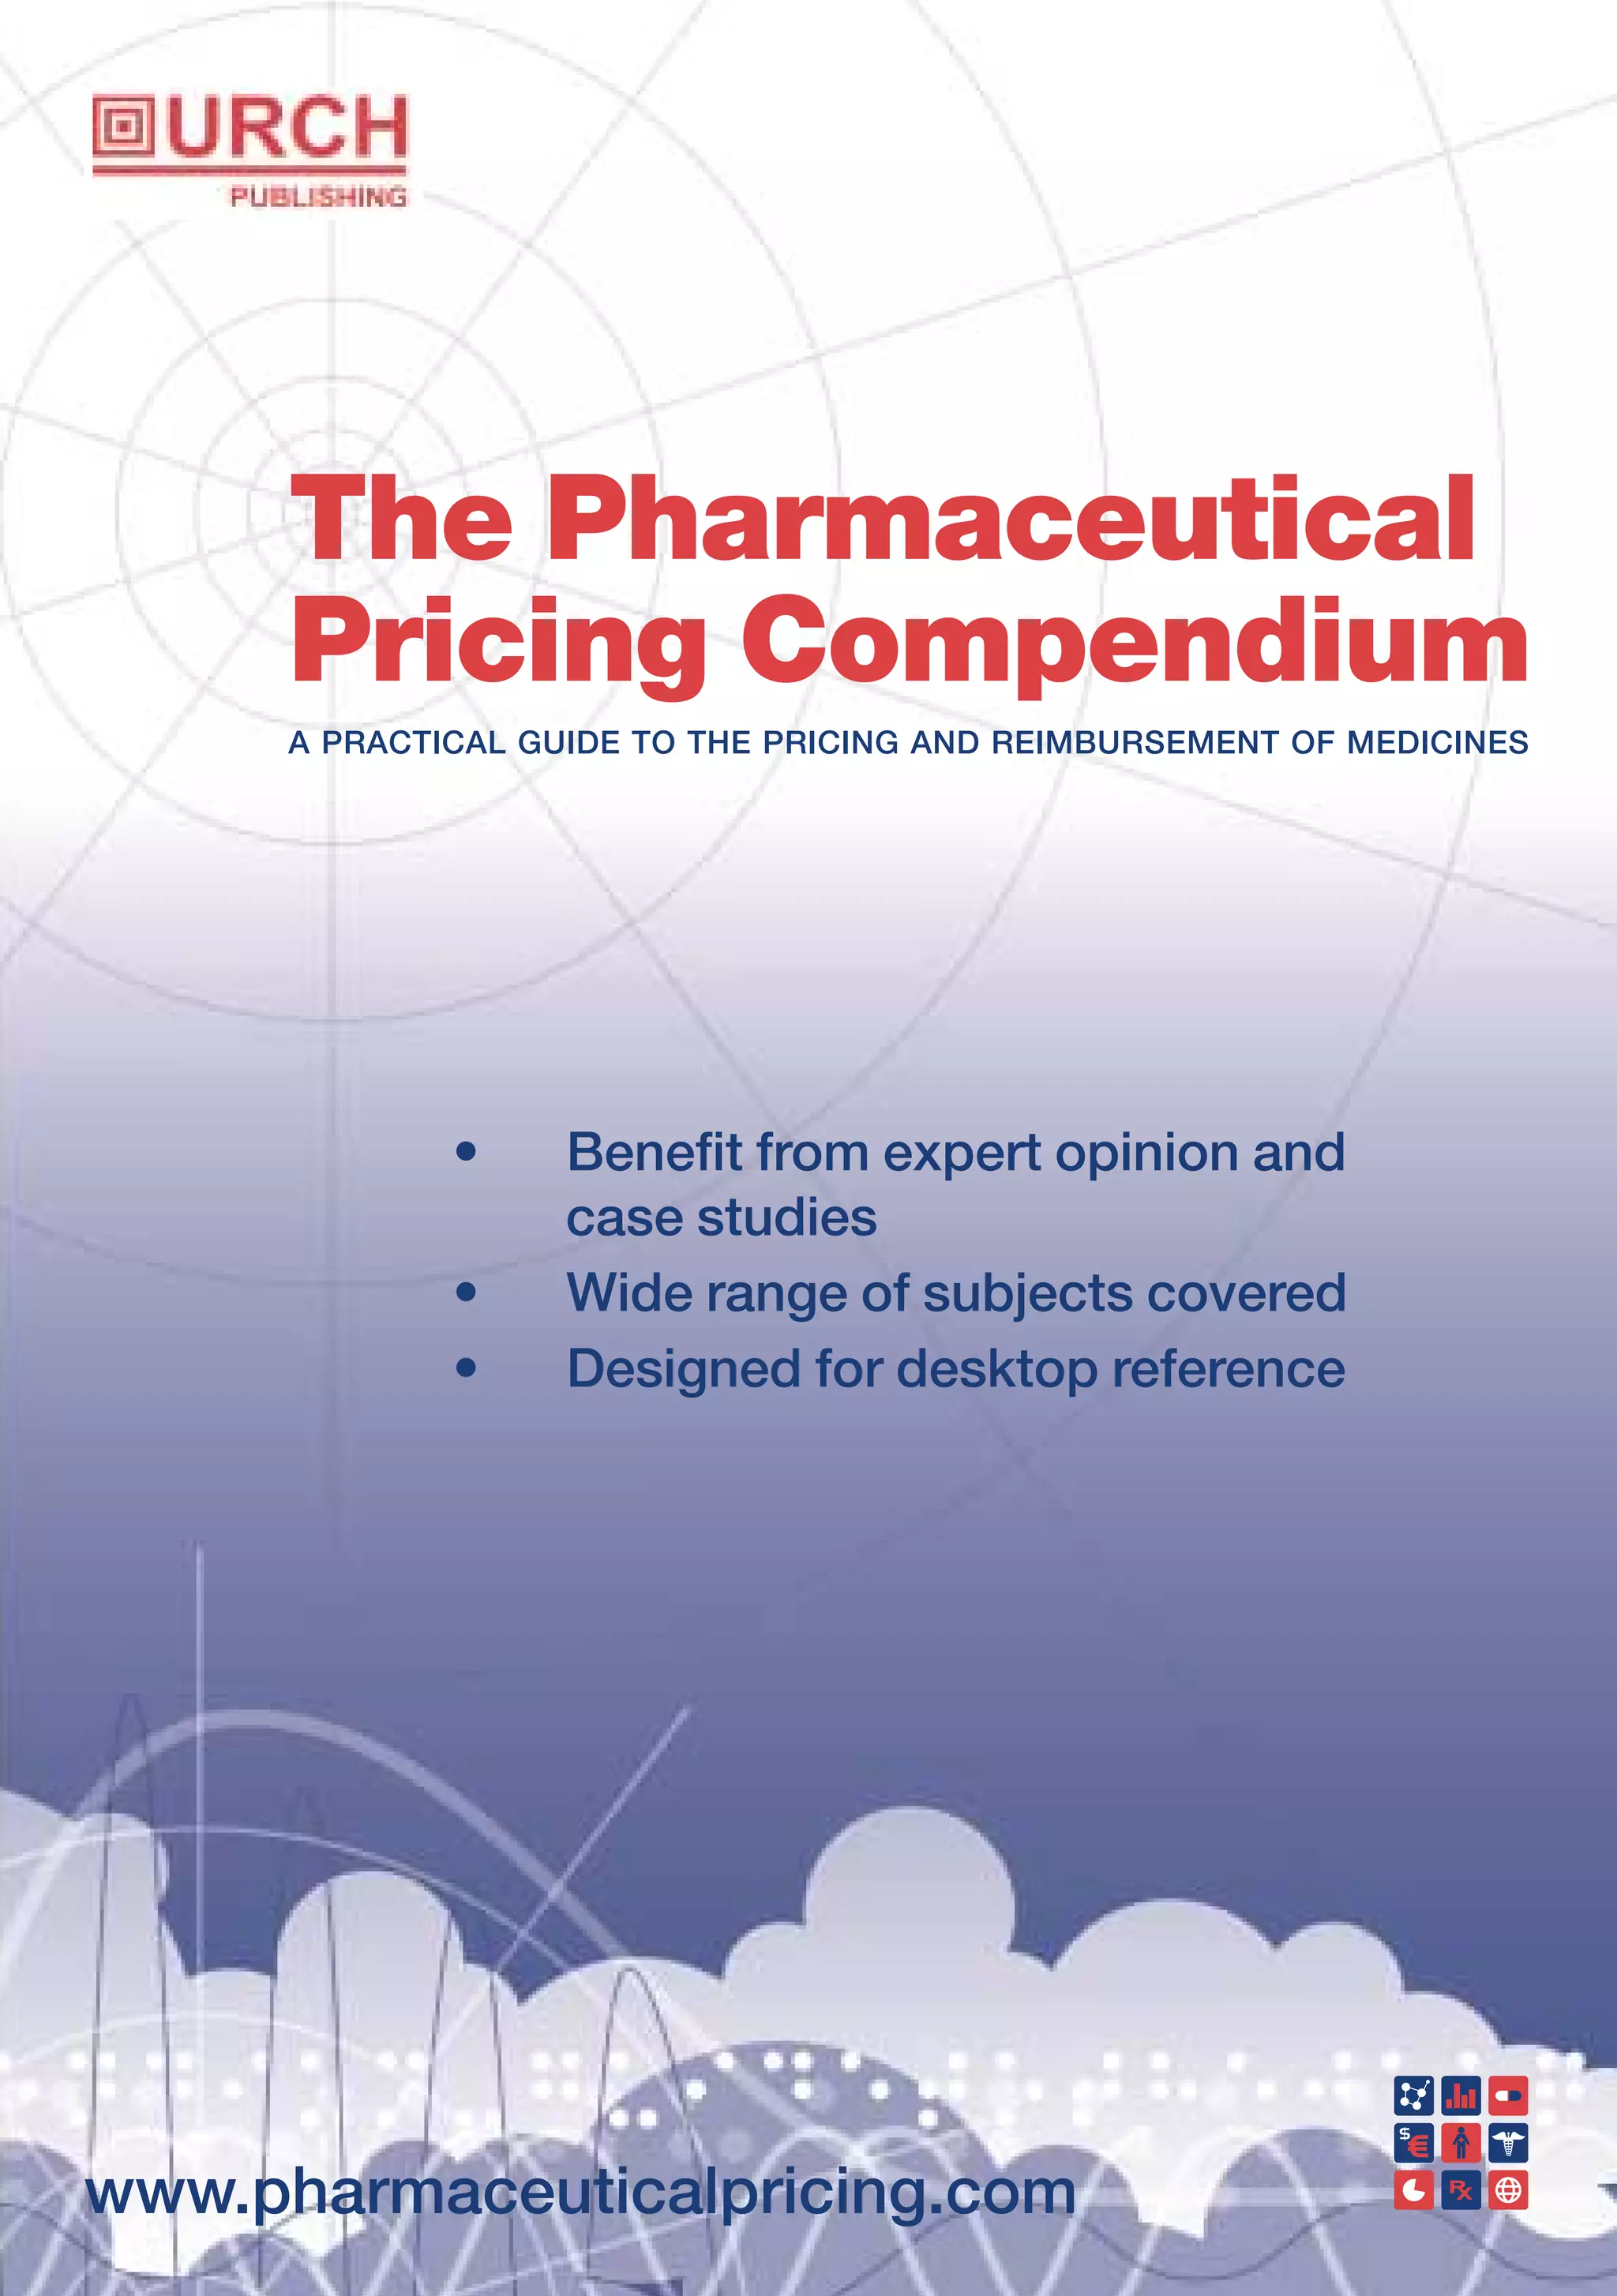
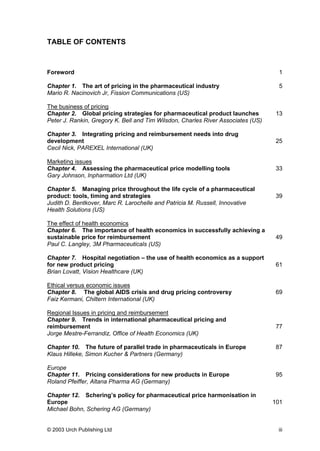
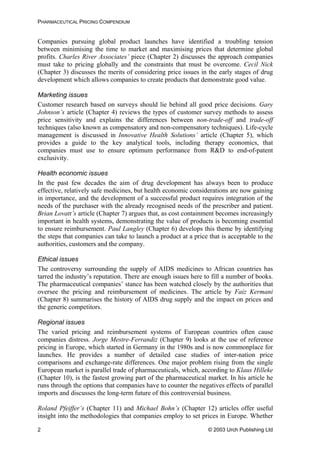
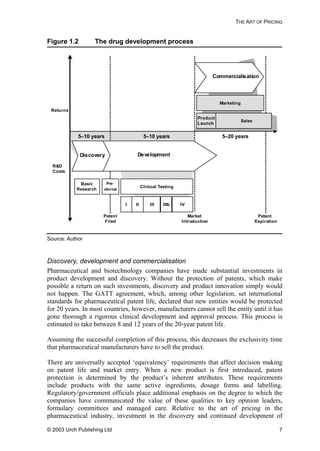
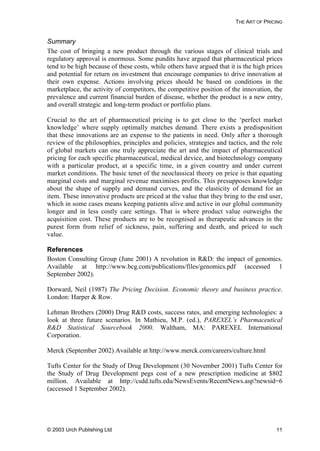
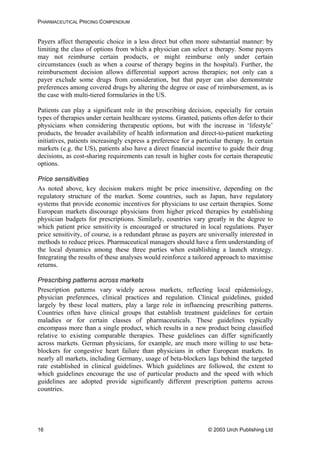
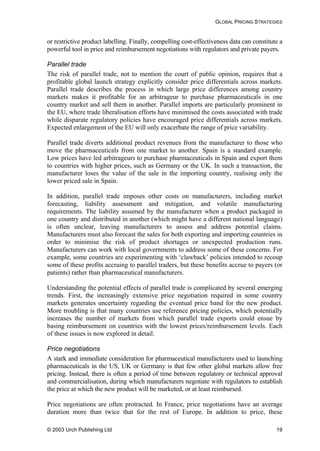
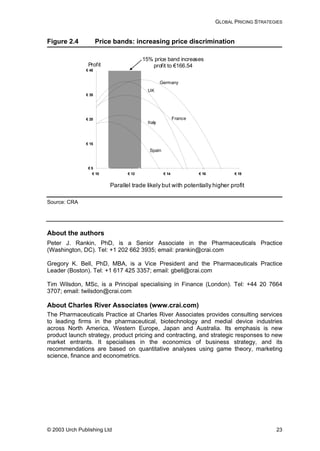
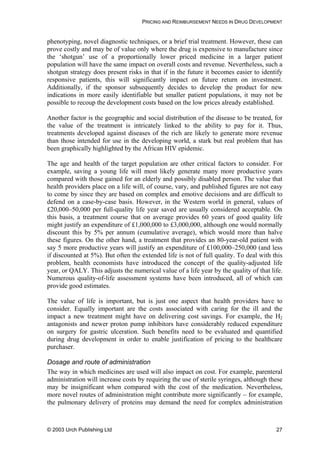
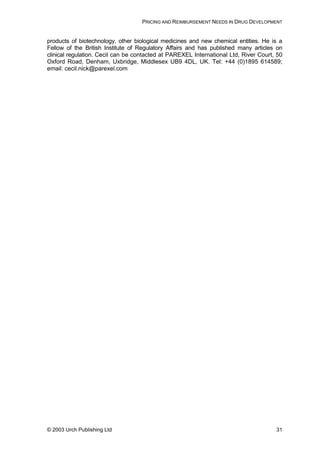
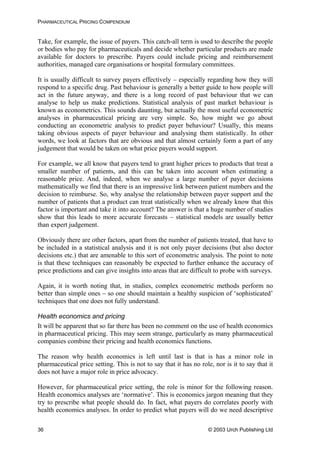
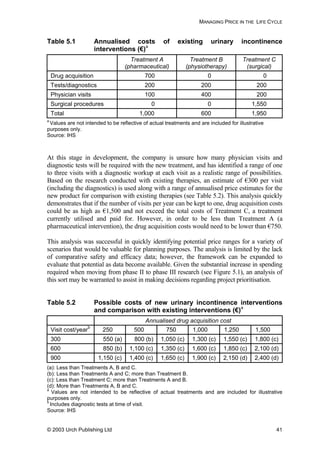
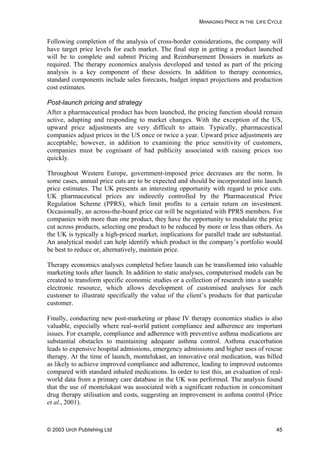
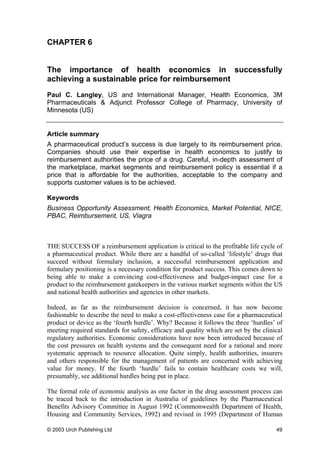
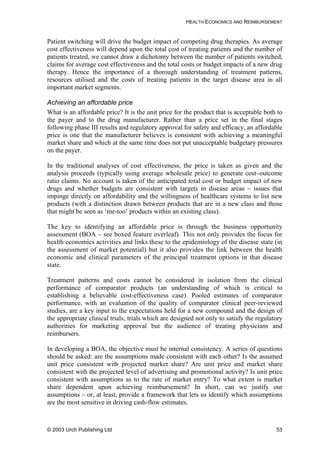
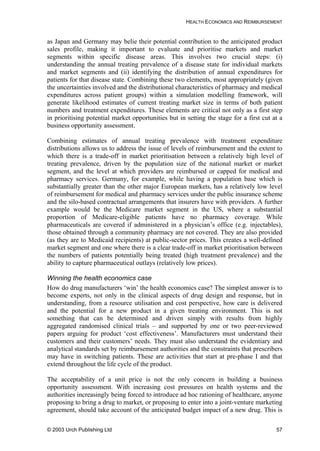
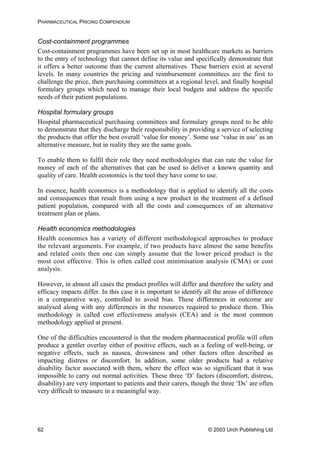
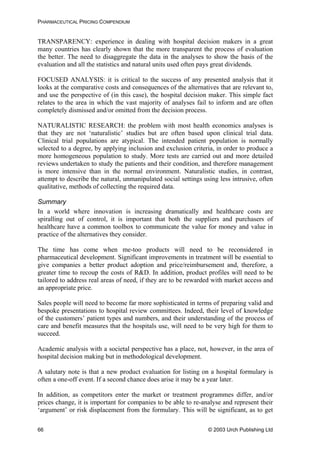
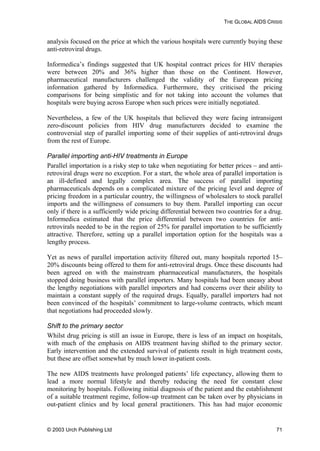
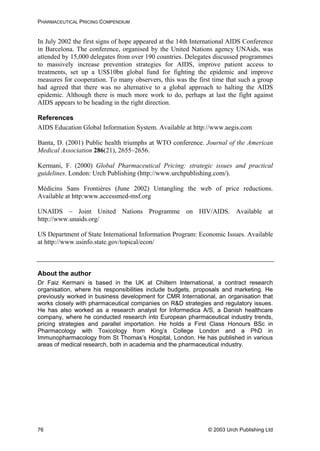
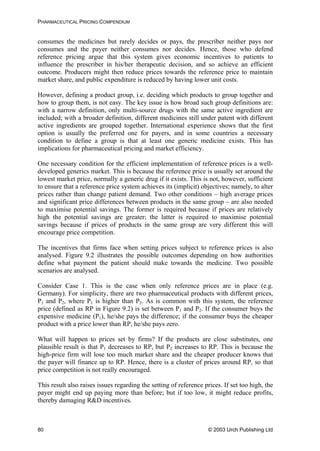
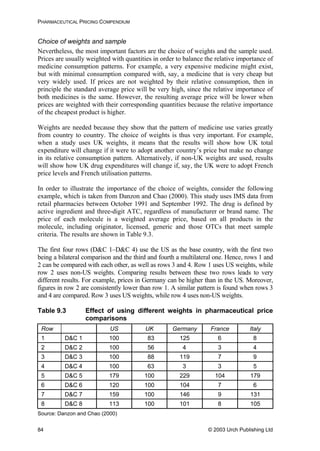
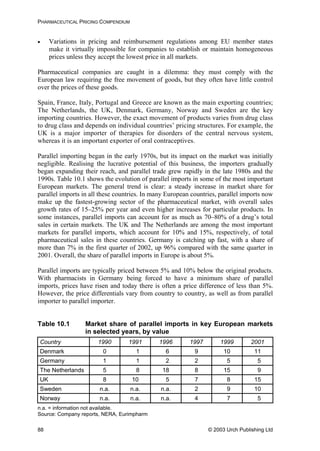
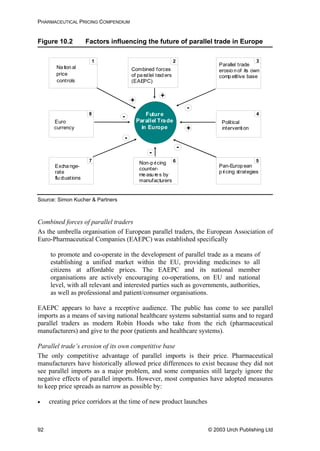
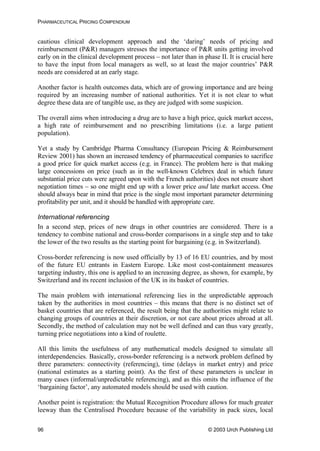
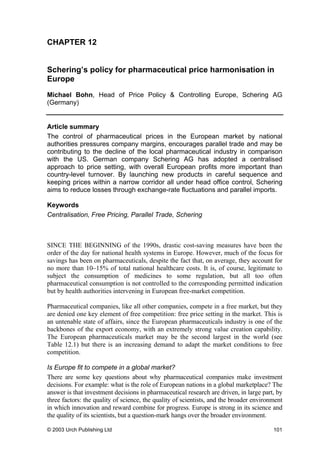
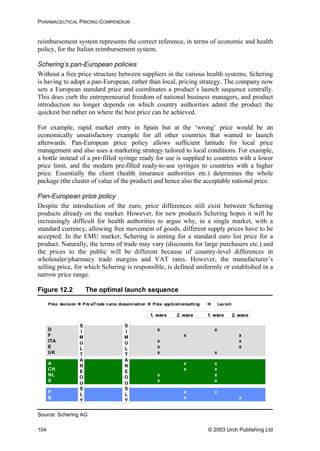
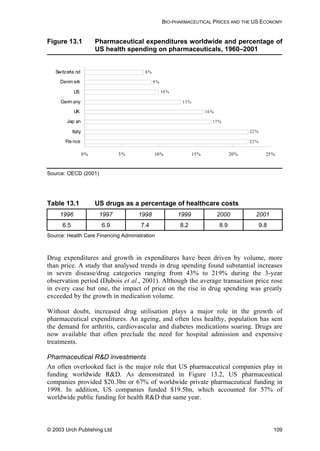
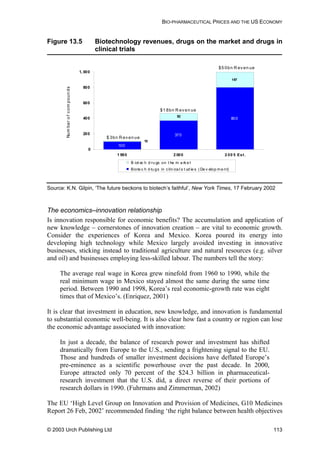
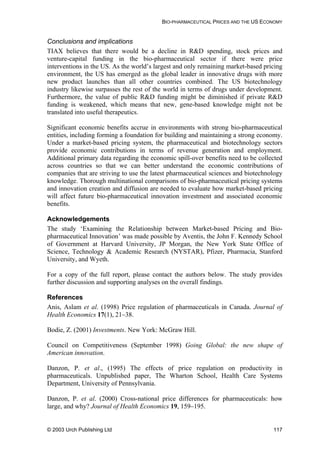
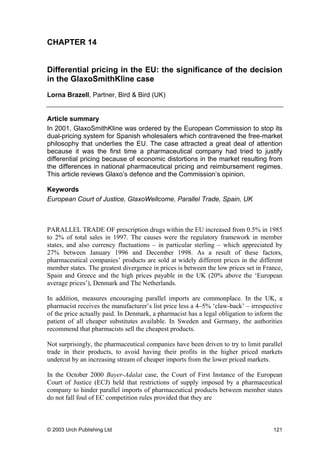
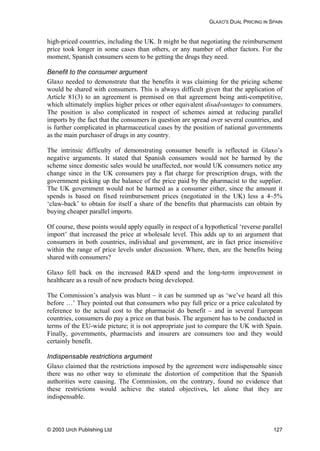
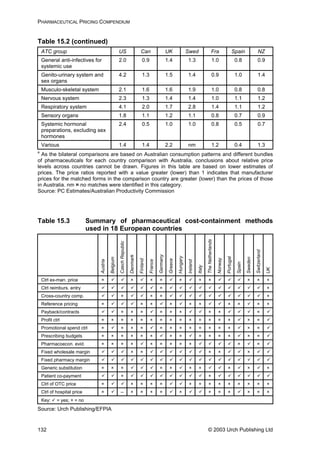
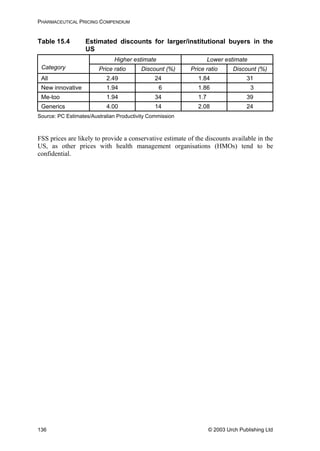
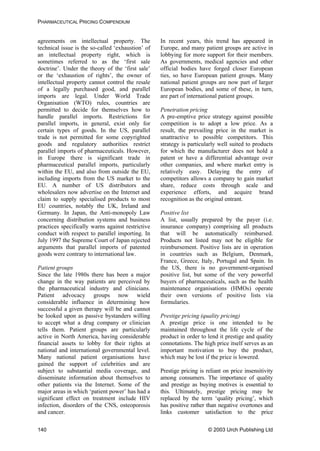
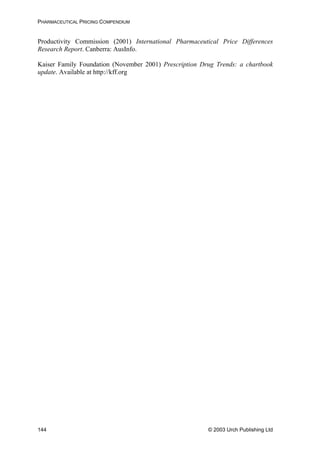
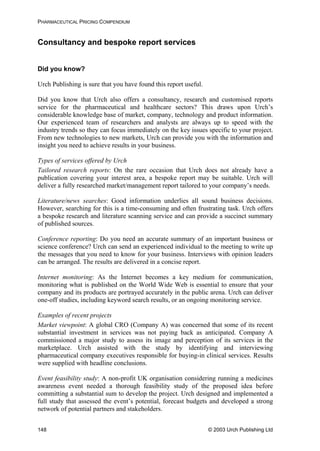
Table 8.1 Summary of pharmaceutical companies’ best ARV price
offers for developing countries (prices in US dollars per
adult per year)
NRTI
(abbreviation)
abacivir
(ABC)
didanosine
(ddI)
lamivudine
(3TC)
stavudine
(d4T)
zalcitabine
(ddC)
zidovudine
(ZDV/AZT)
Strength
(mg)
300 100 150 40 0.75 300
Europe/US
trade name
Ziagen
®
(GSK)
Videx
®
(BMS)
Epivir
®
(GSK)
Zerit
®
(BMS)
Hivid
®
(Roche)
Retrovir
®
(GSK)
Daily dose 2 4 2 2 3 2
BMS (US) 310 55
GSK (UK) 1,387 234 584
Roche(US) 161
Aurobindo
(India)
197 66 31 140
Cipla (India) 426 126 53 198
GPO
(Thailand)
650 163 73 277
Hetero
(India)
1,372 248 93 47 183
Ranbaxy
(India)
100 49 180
Prices are Free on Board (FOB) for generics’ manufacturers, and at least cost, insurance and
freight (CIF) for originator companies. All prices in other currencies than dollars were converted at
the rate in force when the offer was made. Prices are rounded up to whole numbers for easier
comparison. Annual costs are calculated according to the daily doses given in the WHO document
Scaling-up Antiretroviral Therapy in Resource Limited Settings: guidelines for a public health
approach, 22 April 2002.
Source: Médecins Sans Frontières
Although this appeared to open the way to the introduction of cheap anti-retroviral
drugs for South African patients, this has yet to happen. To a large extent this is due to
certain members of the South African government appearing to deny links between
AIDS and HIV, a view which has been severely criticised internationally.
Controversial use of generics in Brazil
Brazil has implemented one of the most successful anti-AIDS strategies in the
developing world by making affordable treatments available to sufferers, despite
opposition from the global pharmaceutical industry.
In 1998, Brazil began to produce its own generic versions of anti-retroviral drugs, and
this resulted in a 79% price decrease. Brazil has exploited a time lag until international
patent rules apply in the country. This has meant that a generic version of an anti-
retroviral combination cocktail that sells for $10,000–15,000 a year in the US can cost
$3,000 in Brazil. This situation came about from enacting a law that ‘guaranteed every
AIDS patient [in Brazil] state-of-the-art treatment’. It is widely quoted that this
© 2003 Urch Publishing Ltd 73](https://image.slidesharecdn.com/urch-pharmapricingcompendiumfinal-181017103816/85/The-Pharmaceutical-Pricing-Compendium-80-320.jpg)

![GLAXO'S DUAL PRICING IN SPAIN
authorities, and the agreement was in fact suspended for most of the period of the
European investigation.
The investigation lasted over 3 years and involved submissions from a number of
interested parties including EFPIA (in support of GlaxoWellcome’s position) and the
Spanish wholesalers’ associations and EAEPC14
(arguing that the agreement was indeed
anti-competitive). In May 2001 the Commission announced that the agreement was
anti-competitive and could not be implemented.
The fact that the wholesalers had had the option of signing up to the agreement or not
meant that GlaxoWellcome could not argue that there was no concurrence of wills, as
Bayer had successfully done. Since there was an agreement, Article 81 of the Treaty of
Rome necessarily applied at that level at least. In fact most of the conditions for
application of Article 81(1) were not seriously contested: there was an agreement, and it
would have the effect of compartmentalising the common market. This latter is of
course the ill that the Treaty of Rome sets out to eliminate. Glaxo therefore had two
options. It could argue that the agreement was not anti-competitive within the sense of
Article 81(1) at all. Alternatively, it could argue that if the agreement were contrary to
Article 81(1), it should be exempted under Article 81(3). Naturally, Glaxo ran both sets
of arguments, making this the first case in which a pharmaceutical company has
attempted to justify obstacles to parallel imports on the basis of the economics.
Glaxo argued that its pricing system did not distort competition but merely remedied the
distortion of an otherwise level playing field that was imposed by member states
through their diverse regulation of reimbursement prices. Expanding on this theme,
Glaxo identified a conflict between UK policy, where the high reimbursement prices
allowed pharmaceutical companies to profit and thus promote further R&D, and the
Spanish policy, which was characterised as maintaining low prices to bring modern
healthcare within affordable reach. Allowing parallel trade, they argued, allowed the
(quite legitimate) Spanish policy to undermine the UK one.
The Commission was not impressed. The basic argument, that GlaxoWellcome was
entitled to try to remove distortions of competition imposed by member states, had
already been argued out in the 1995 Merck v. Primecrown15
decision of the ECJ. The
ECJ acknowledged that
although the imposition of price controls is indeed a factor which may, in
certain conditions, distort competition between Members States, that
circumstance cannot justify a derogation from the principle of free movement
of goods.
observed that
Member State must be remedied by measures taken by the Community
It
it is well settled that distortions caused by different price legislations in a
14
EAEPC is the professional body representing national associations and individual companies
engaged in the parallel trade and distribution of pharmaceuticals in the EU/European Economic
Area.
15
Joined Cases C-267 and C-268/95, [1996] ECR I-6285,
© 2003 Urch Publishing Ltd 123](https://image.slidesharecdn.com/urch-pharmapricingcompendiumfinal-181017103816/85/The-Pharmaceutical-Pricing-Compendium-130-320.jpg)
![GLAXO'S DUAL PRICING IN SPAIN
least as effective as an outright contractual export ban in excluding such trade because it
involves, in principle, no cost of monitoring compliance. Accordingly, the Commission
held that the agreement did fall within the Article 81(1) prohibition.
In theory, Glaxo’s ability to use its ‘not a dual-pricing scheme’ argument might have
been improved had it not participated in the discussions with the regulators. In that case
the Commission would have had a harder time arguing that Glaxo had a hand in setting
the Spanish prices and this ‘it is as good as a dual-pricing scheme even if it isn’t
actually one’ position might not have been justified. In practice this was not an option,
as in order to be able to market the product in Spain a reimbursement price needs to be
set and the law requires the regulator to produce an economic report which would be
impossible without input from the manufacturer. The half-way alternative of providing
the information for the initial report but taking no part thereafter –not applying for any
adjustments, for example – would probably have materially worsened the commercial
position and is unlikely to have been sufficiently distinct to change the Commission’s
finding, which was based on the object of the proposed agreement and not the details of
the mechanism by which it was to be achieved.
In parallel with its primary argument that Article 81(1) did not apply, GlaxoWellcome
put forward reasons why an exemption under Article 81(3) should be granted. By way
of reminder, Article 81(3) states
The provisions of paragraph (1) may, however, be declared inapplicable in the
case of [any agreement or concerted practice] which contributes to improving
the production or distribution of goods or to promoting technical or economic
progress, while allowing consumers a fair share of the resulting benefit and
which does not:
estion.
(a) impose on the undertakings concerned restrictions which are not
indispensable to the attainment of these objectives;
(b) afford such undertakings the possibility of eliminating competition in
respect of a substantial part of the products in qu
In other words, four conditions have to be satisfied:
• the anti-competitive effects of an agreement must be outweighed by the benefits in
the form of promotion of technical or economic progress or contribution to
improving the production or distribution of goods
• these benefits must be shared with consumers
• the restrictions imposed must be no more than are indispensable, and
• competition must not be eliminated.
Economic progress argument
The benefit of promotion of technical progress on which Glaxo relied was the simple
equation that greater profits would enable it to carry out more research and thereby
improve healthcare. The Commission was not persuaded. It said no convincing evidence
had been presented that the R&D budget had been affected at all by parallel trade. Even
© 2003 Urch Publishing Ltd 125](https://image.slidesharecdn.com/urch-pharmapricingcompendiumfinal-181017103816/85/The-Pharmaceutical-Pricing-Compendium-132-320.jpg)


This document provides an overview and table of contents for "The Pharmaceutical Pricing Compendium", a guide to pricing and reimbursement of medicines published by Urch Publishing Ltd. The compendium contains 15 chapters written by experts in the pharmaceutical industry covering topics such as global pricing strategies, integrating pricing into drug development, health economics, regional pricing issues, and national and international laws related to pharmaceutical pricing. It is intended to provide pharmaceutical companies with practical guidance on the business, economic, legal and strategic issues involved in pricing pharmaceutical products. Pricing drugs is a complex process that must account for varied healthcare systems, reimbursement policies, international reference pricing, parallel trade, access to drugs in developing countries, and regulation of drug


