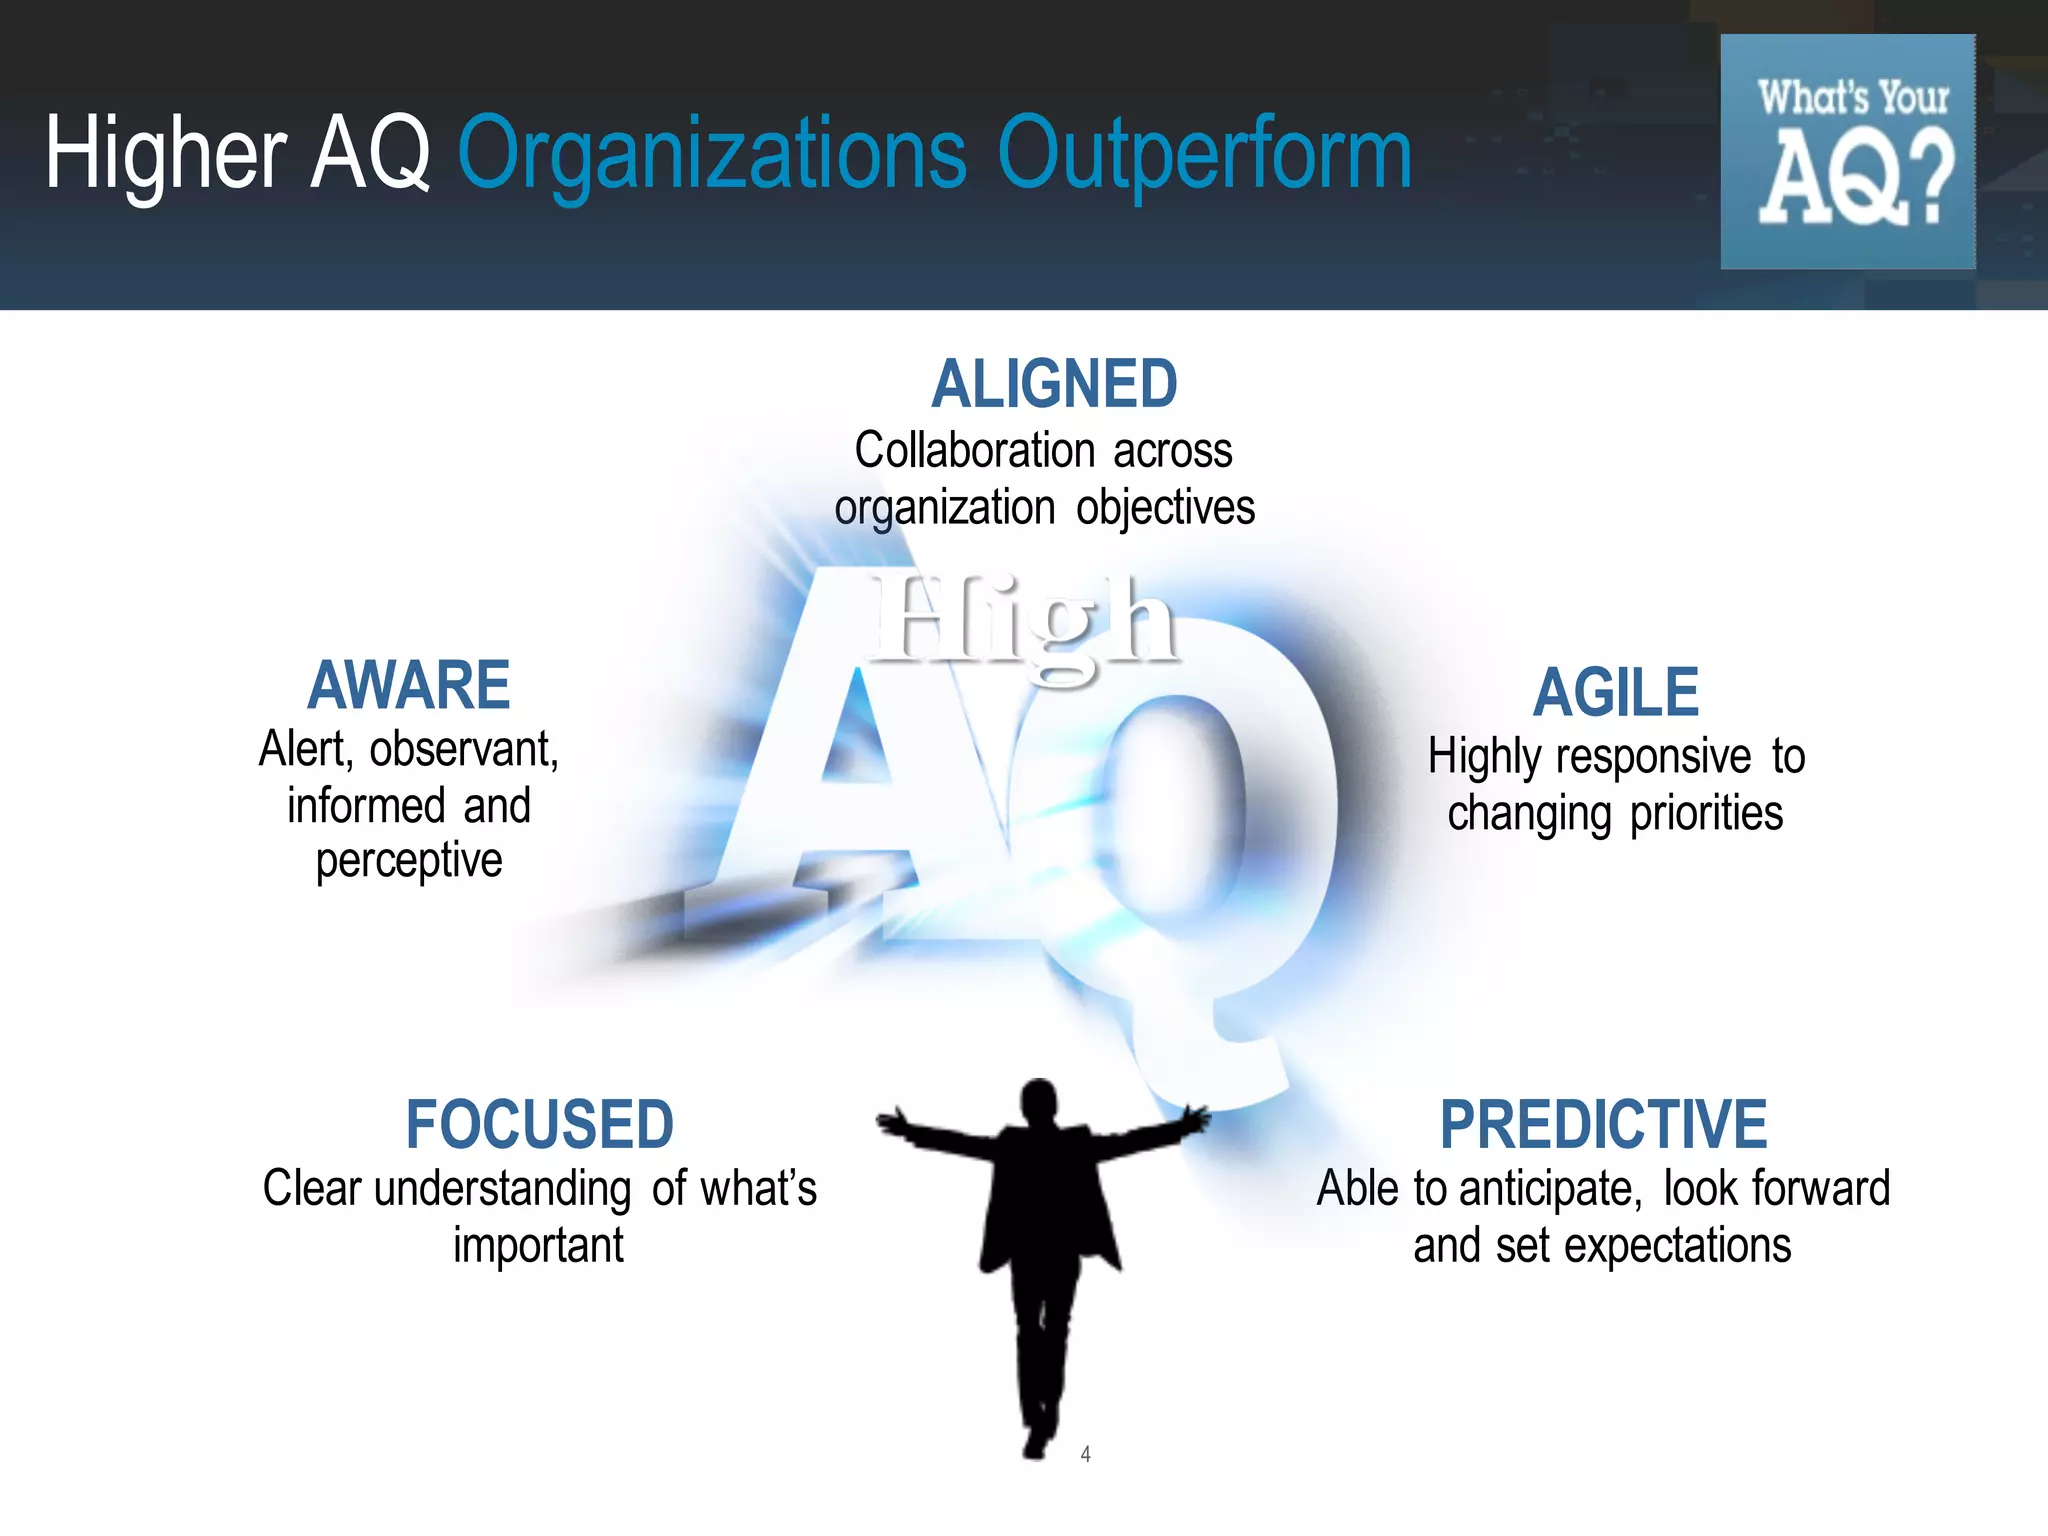
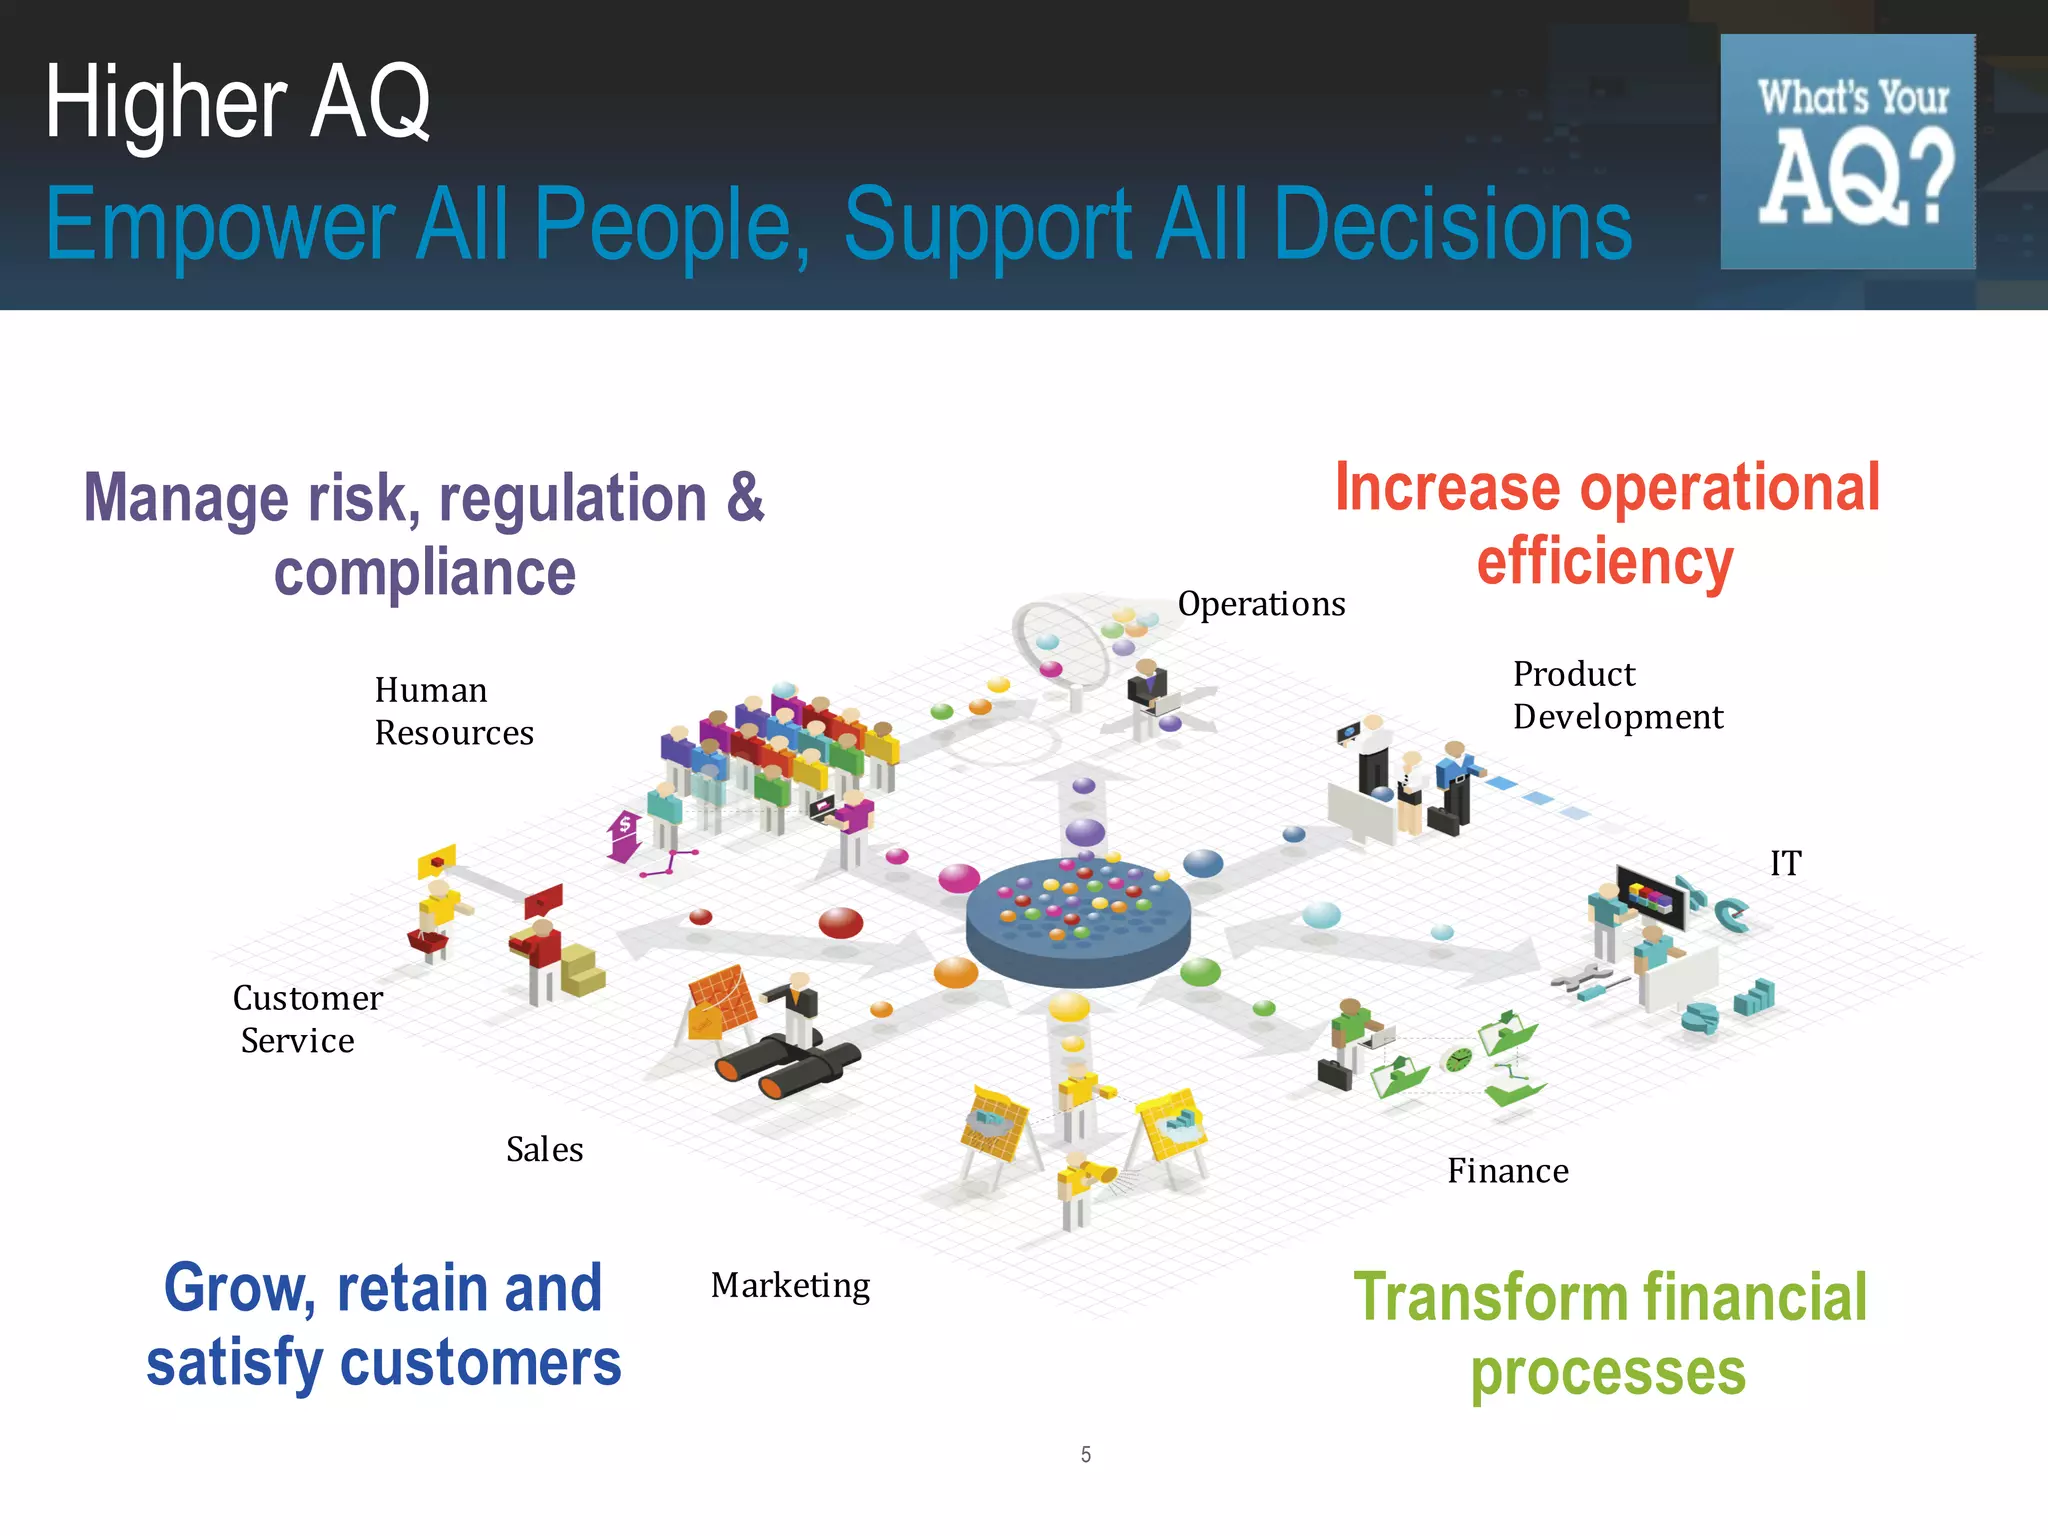
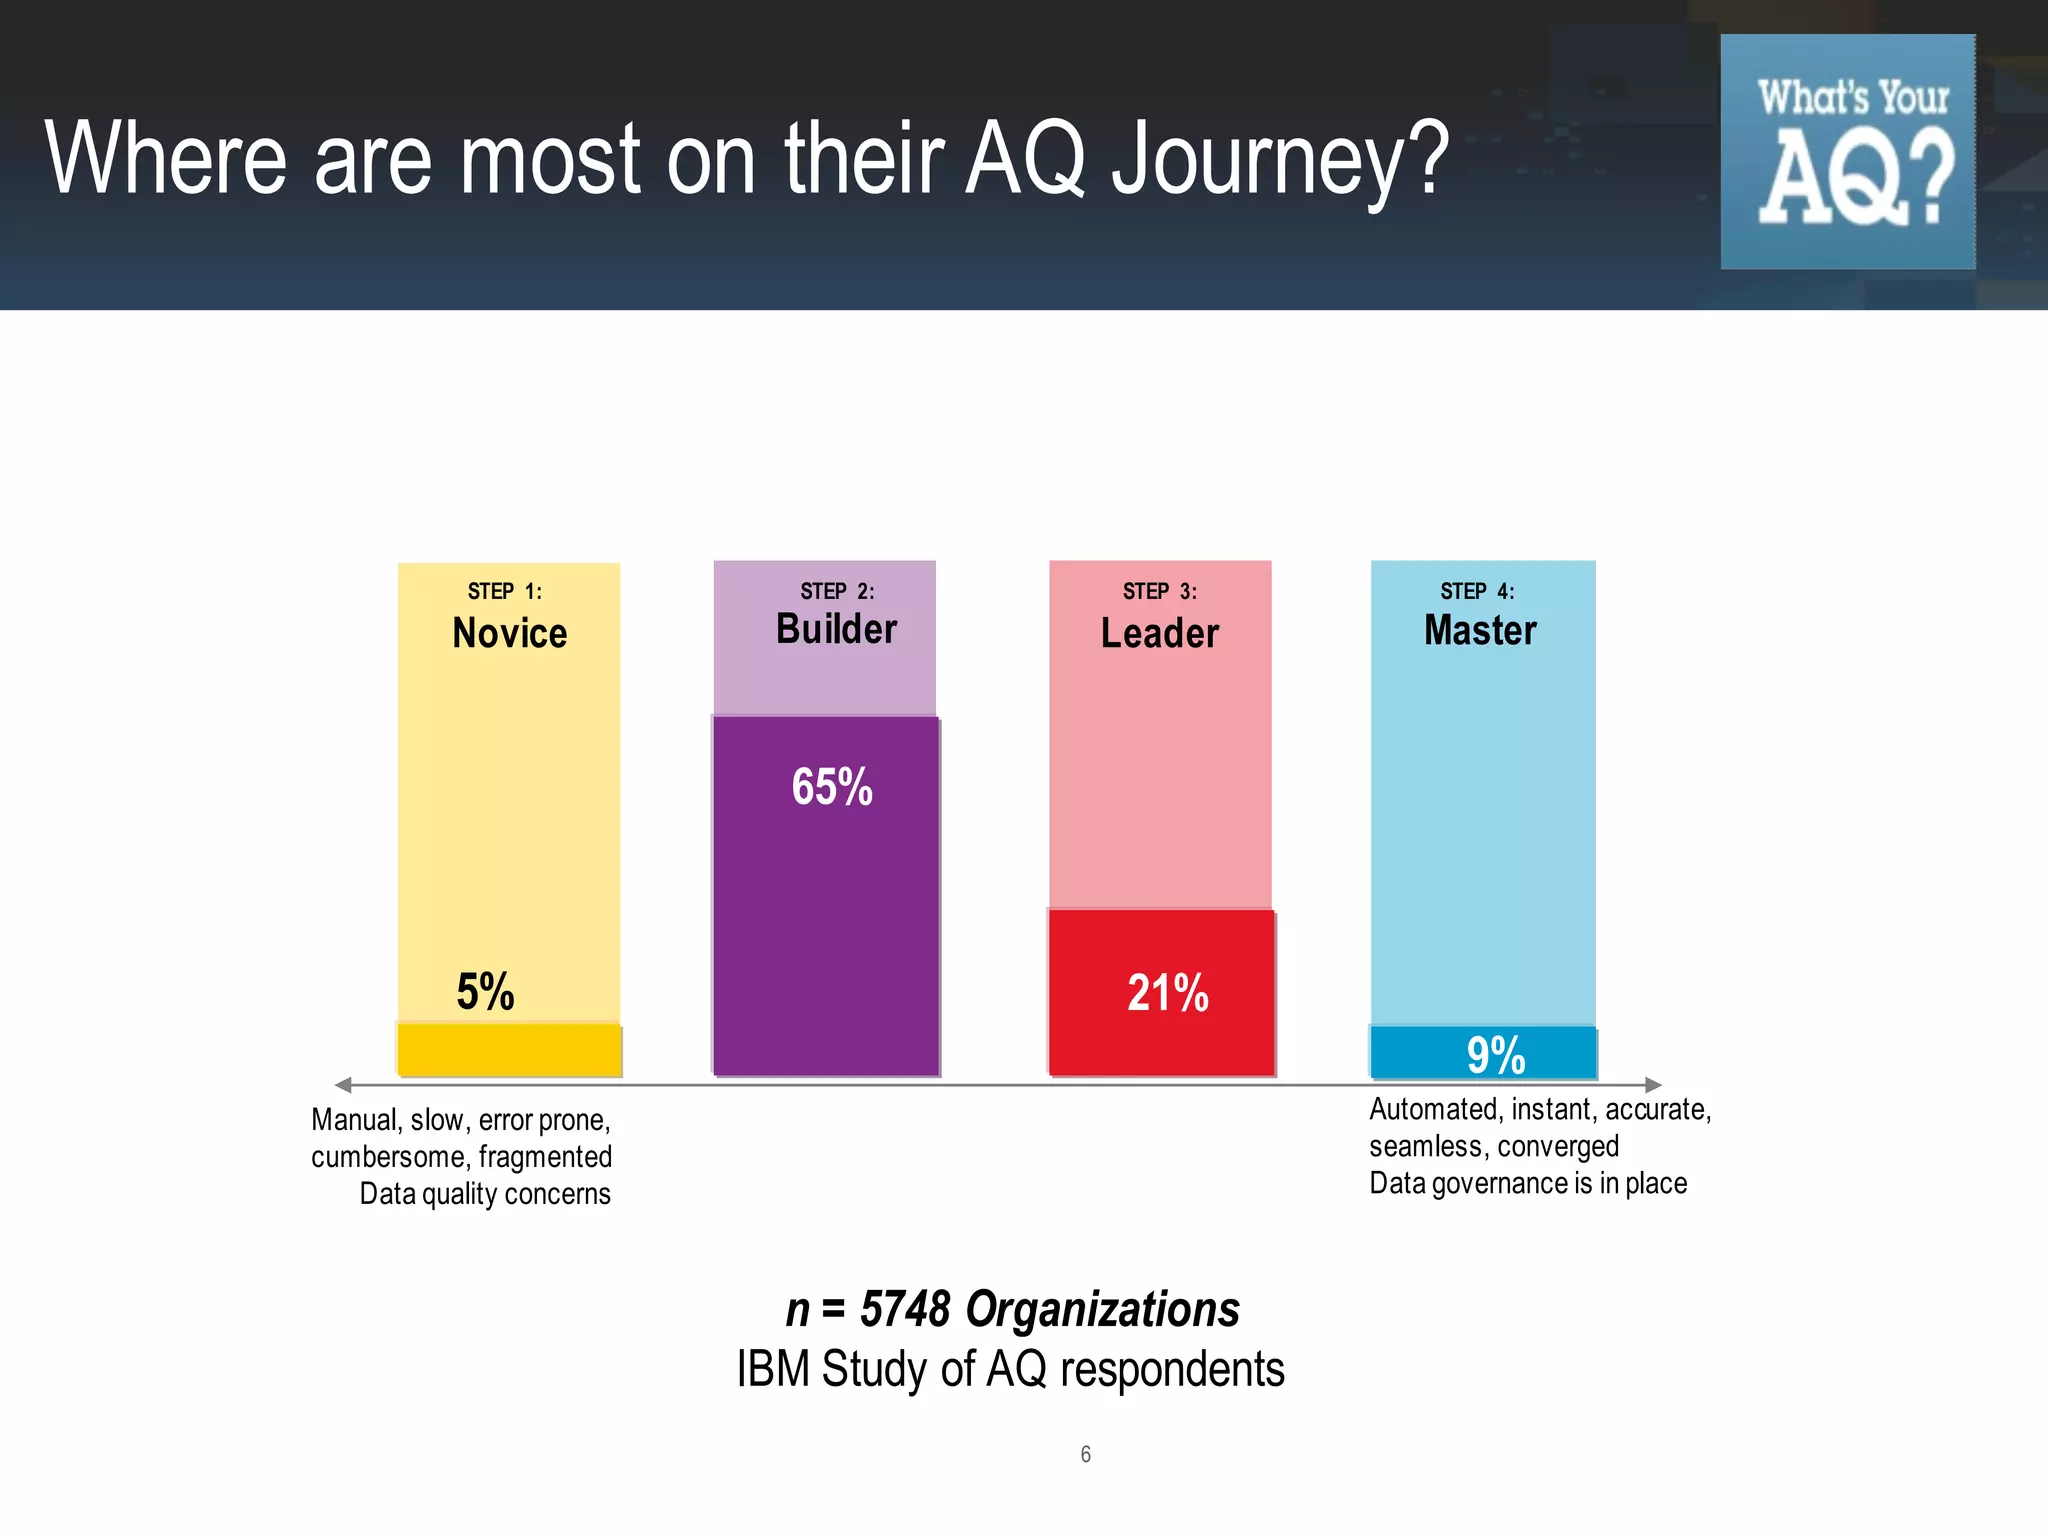
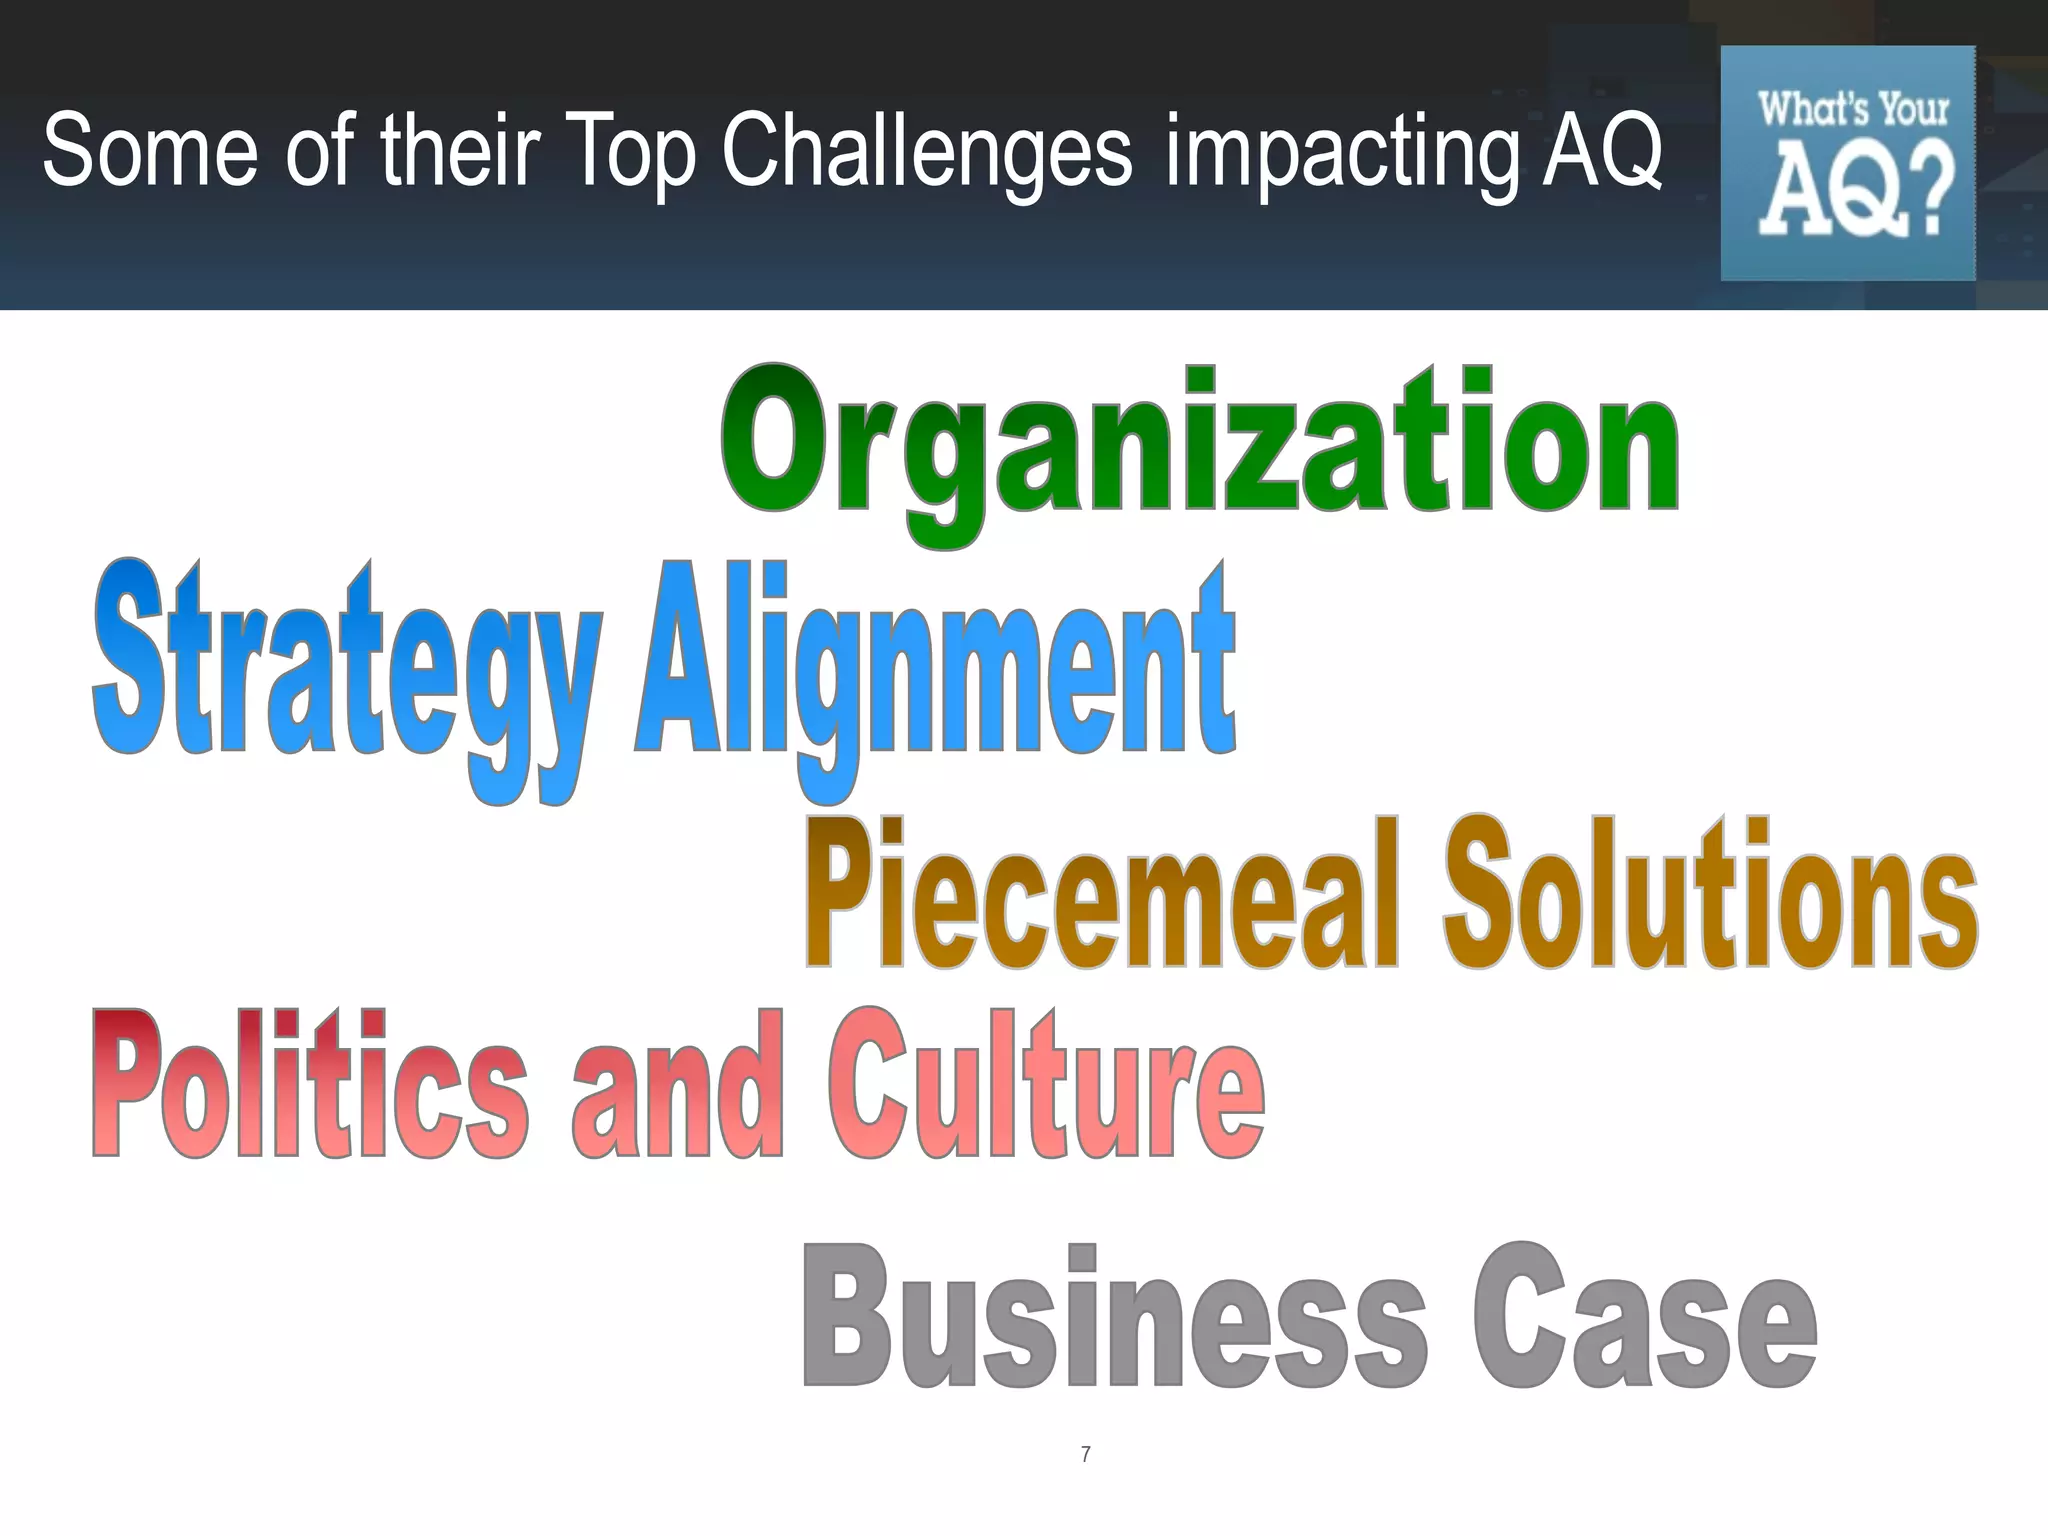
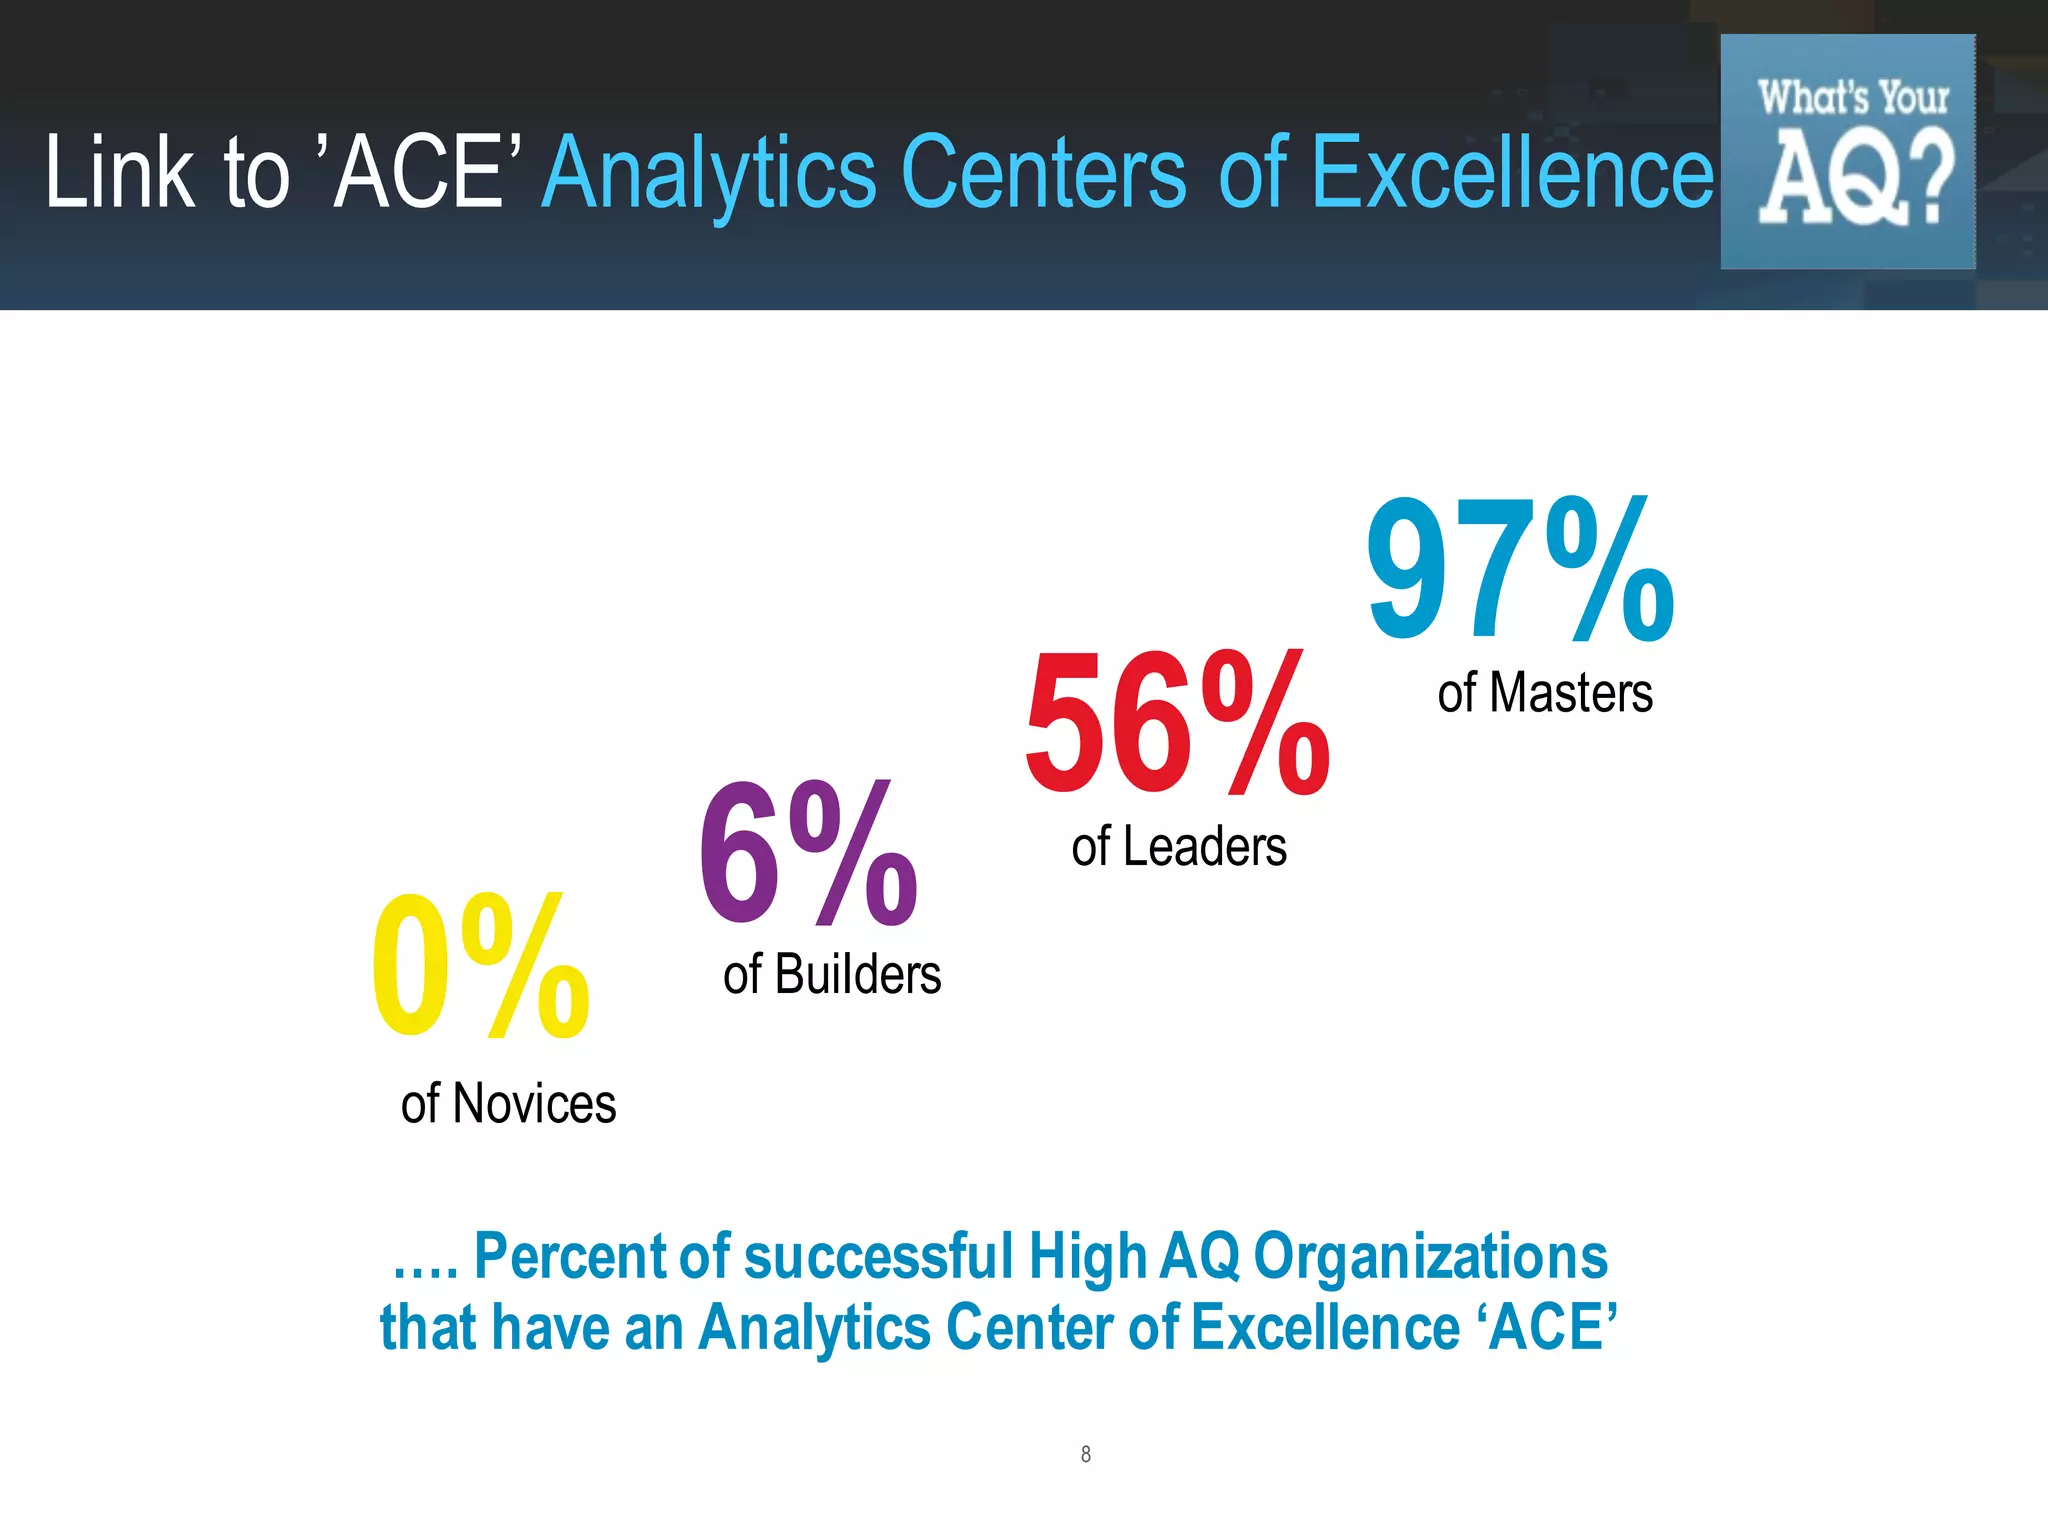
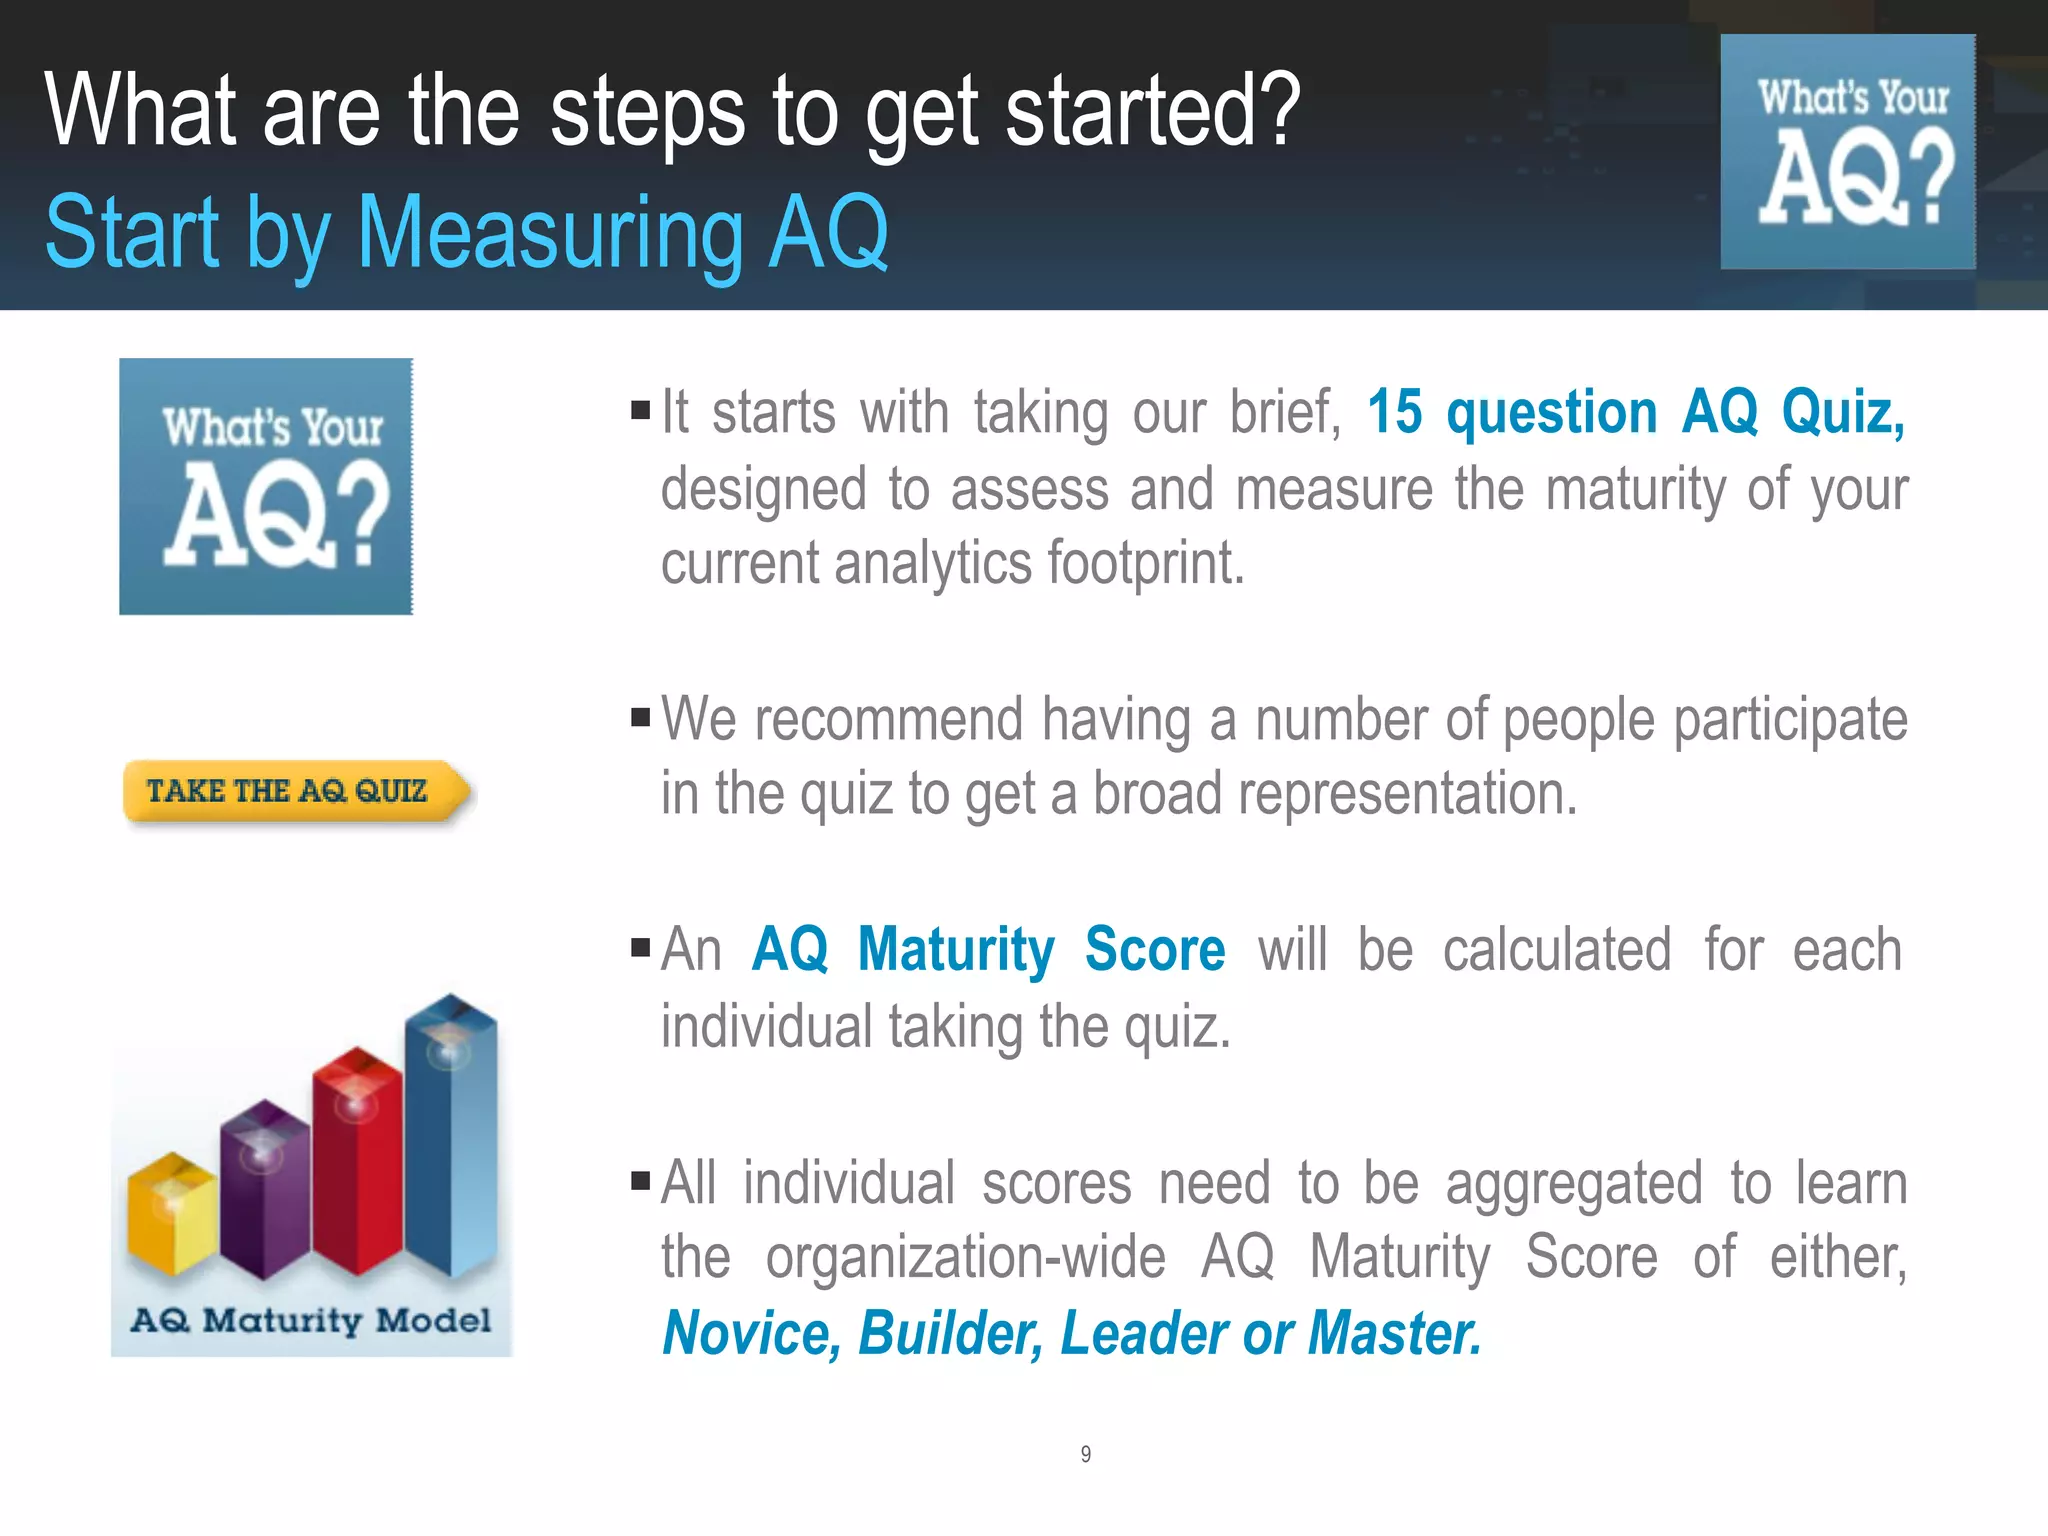
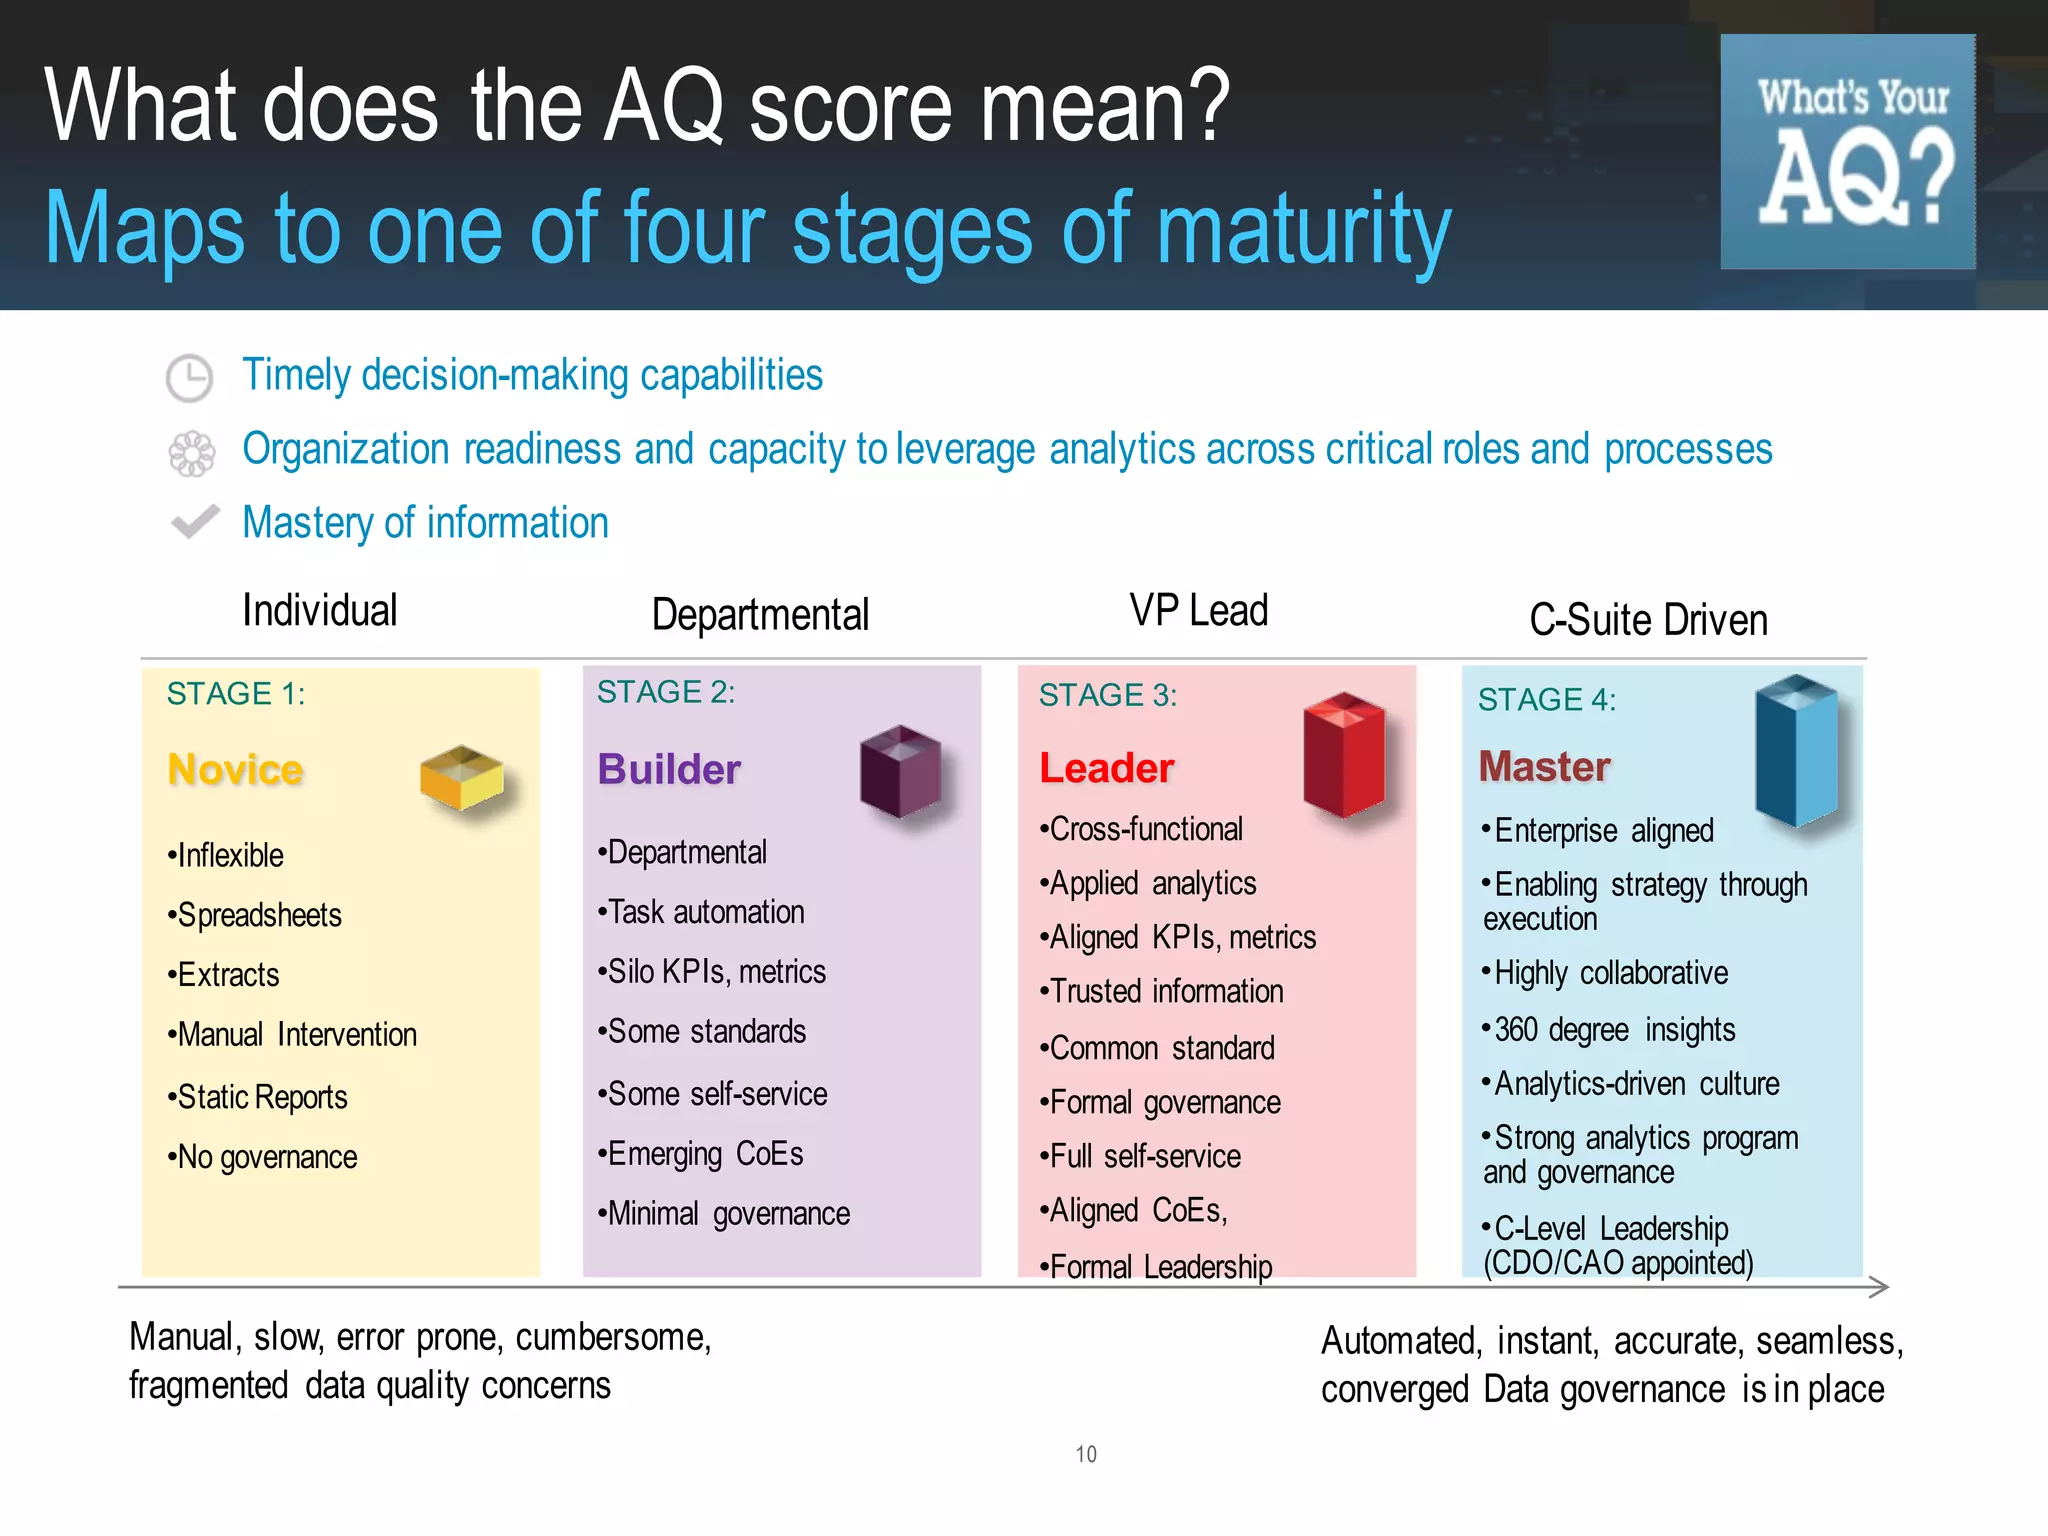
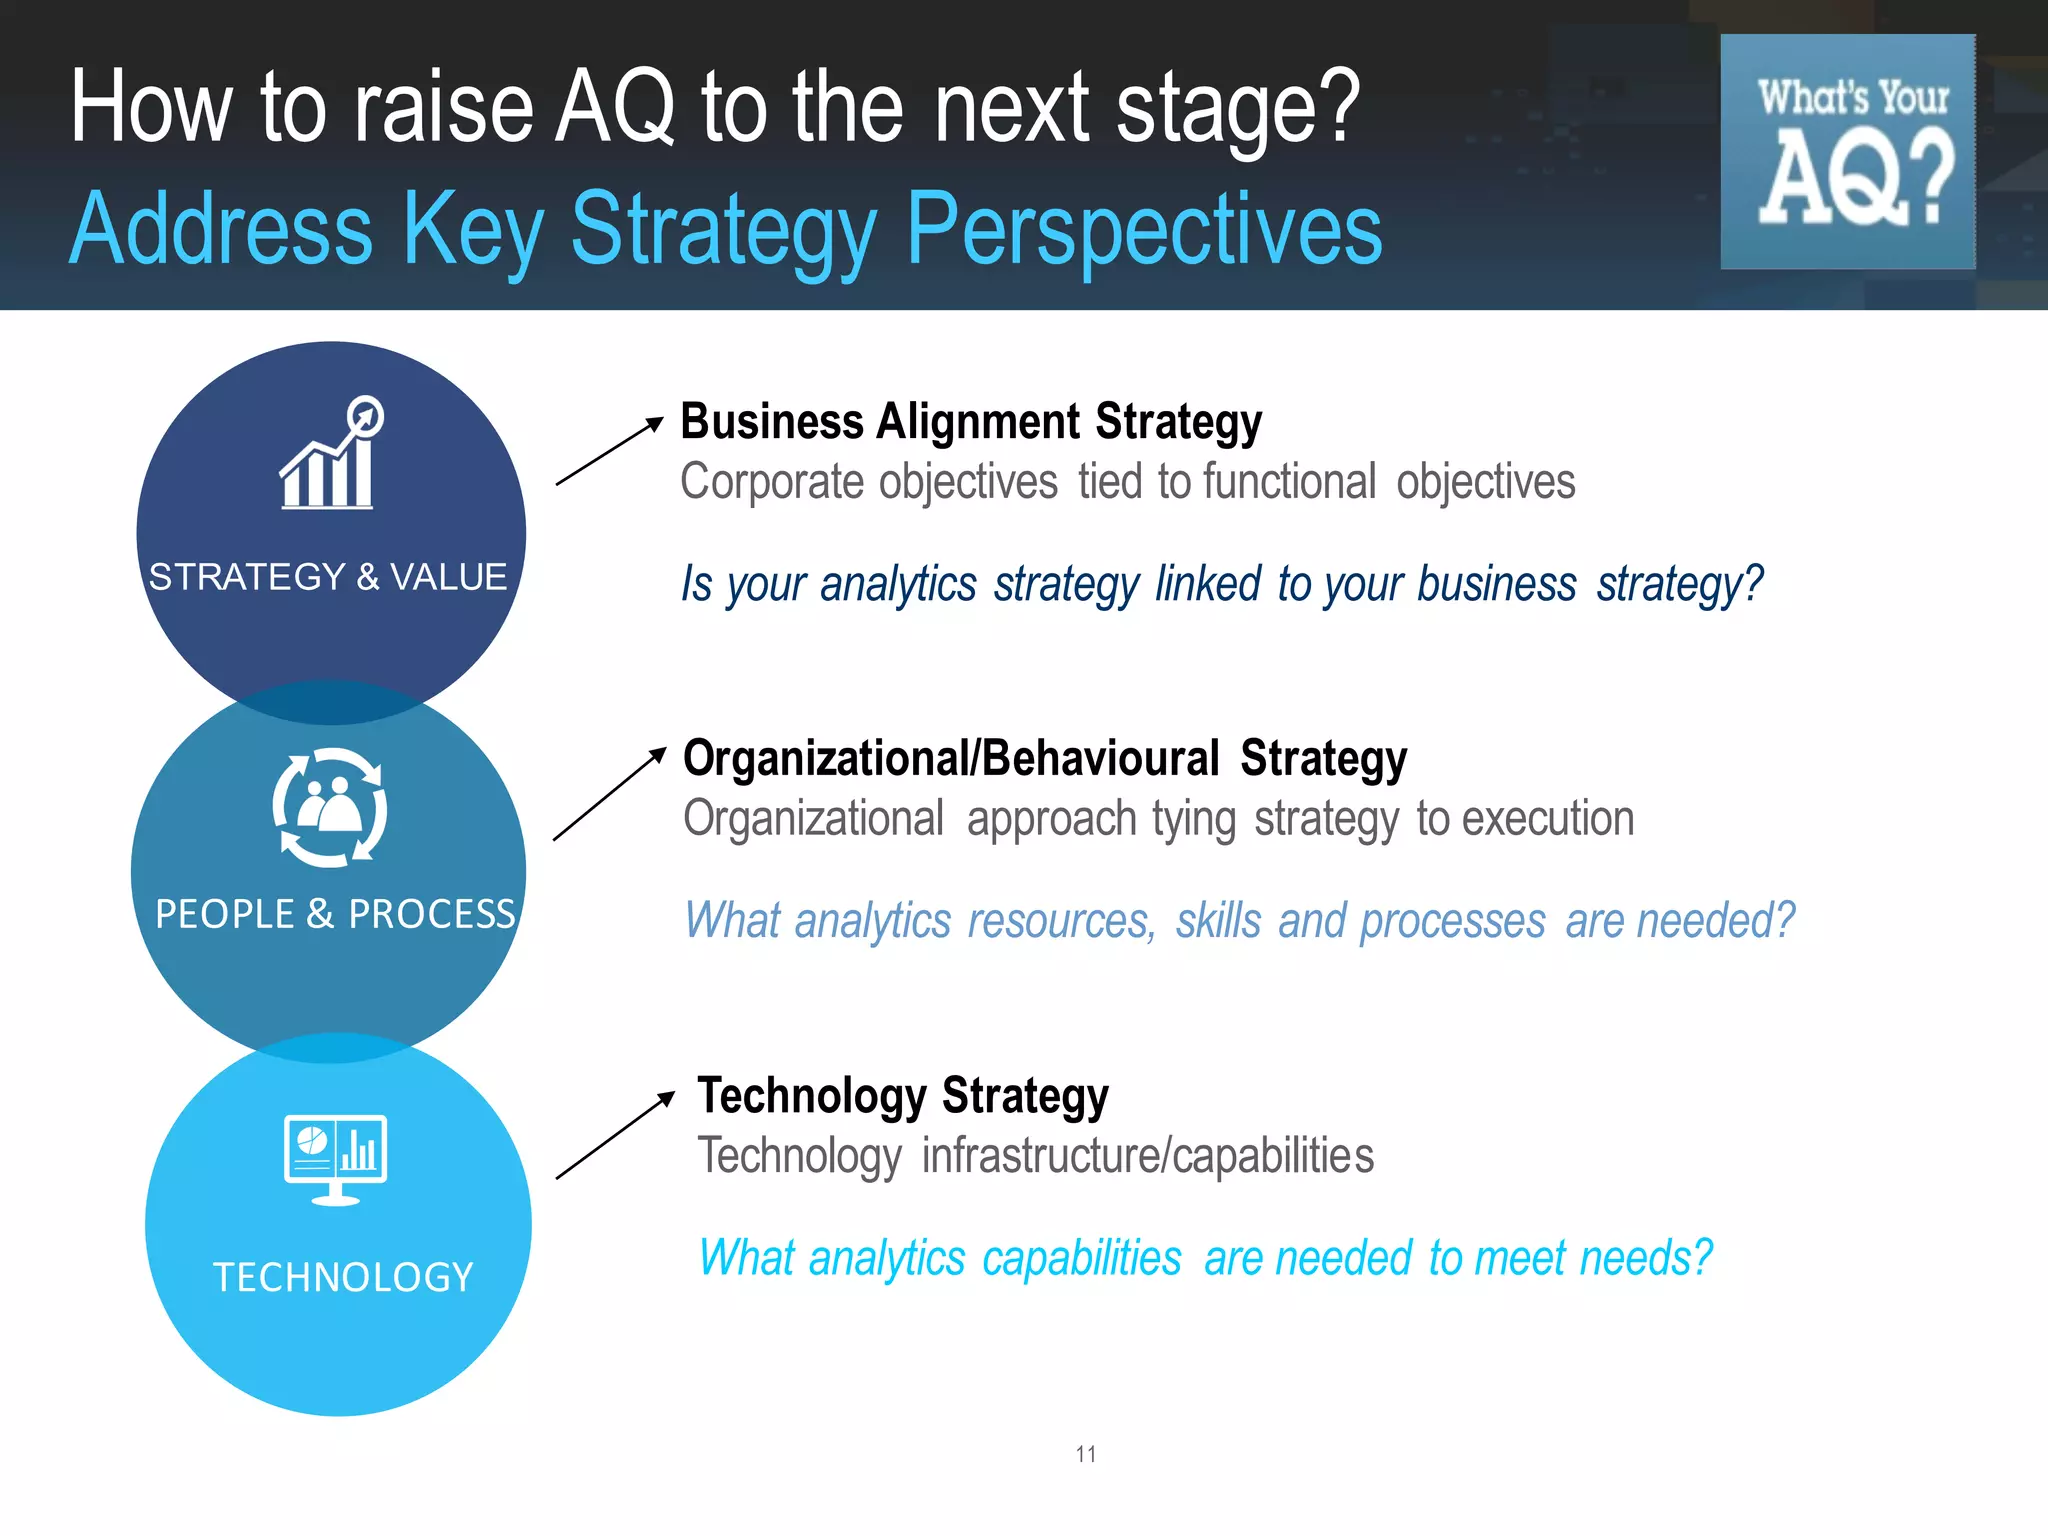
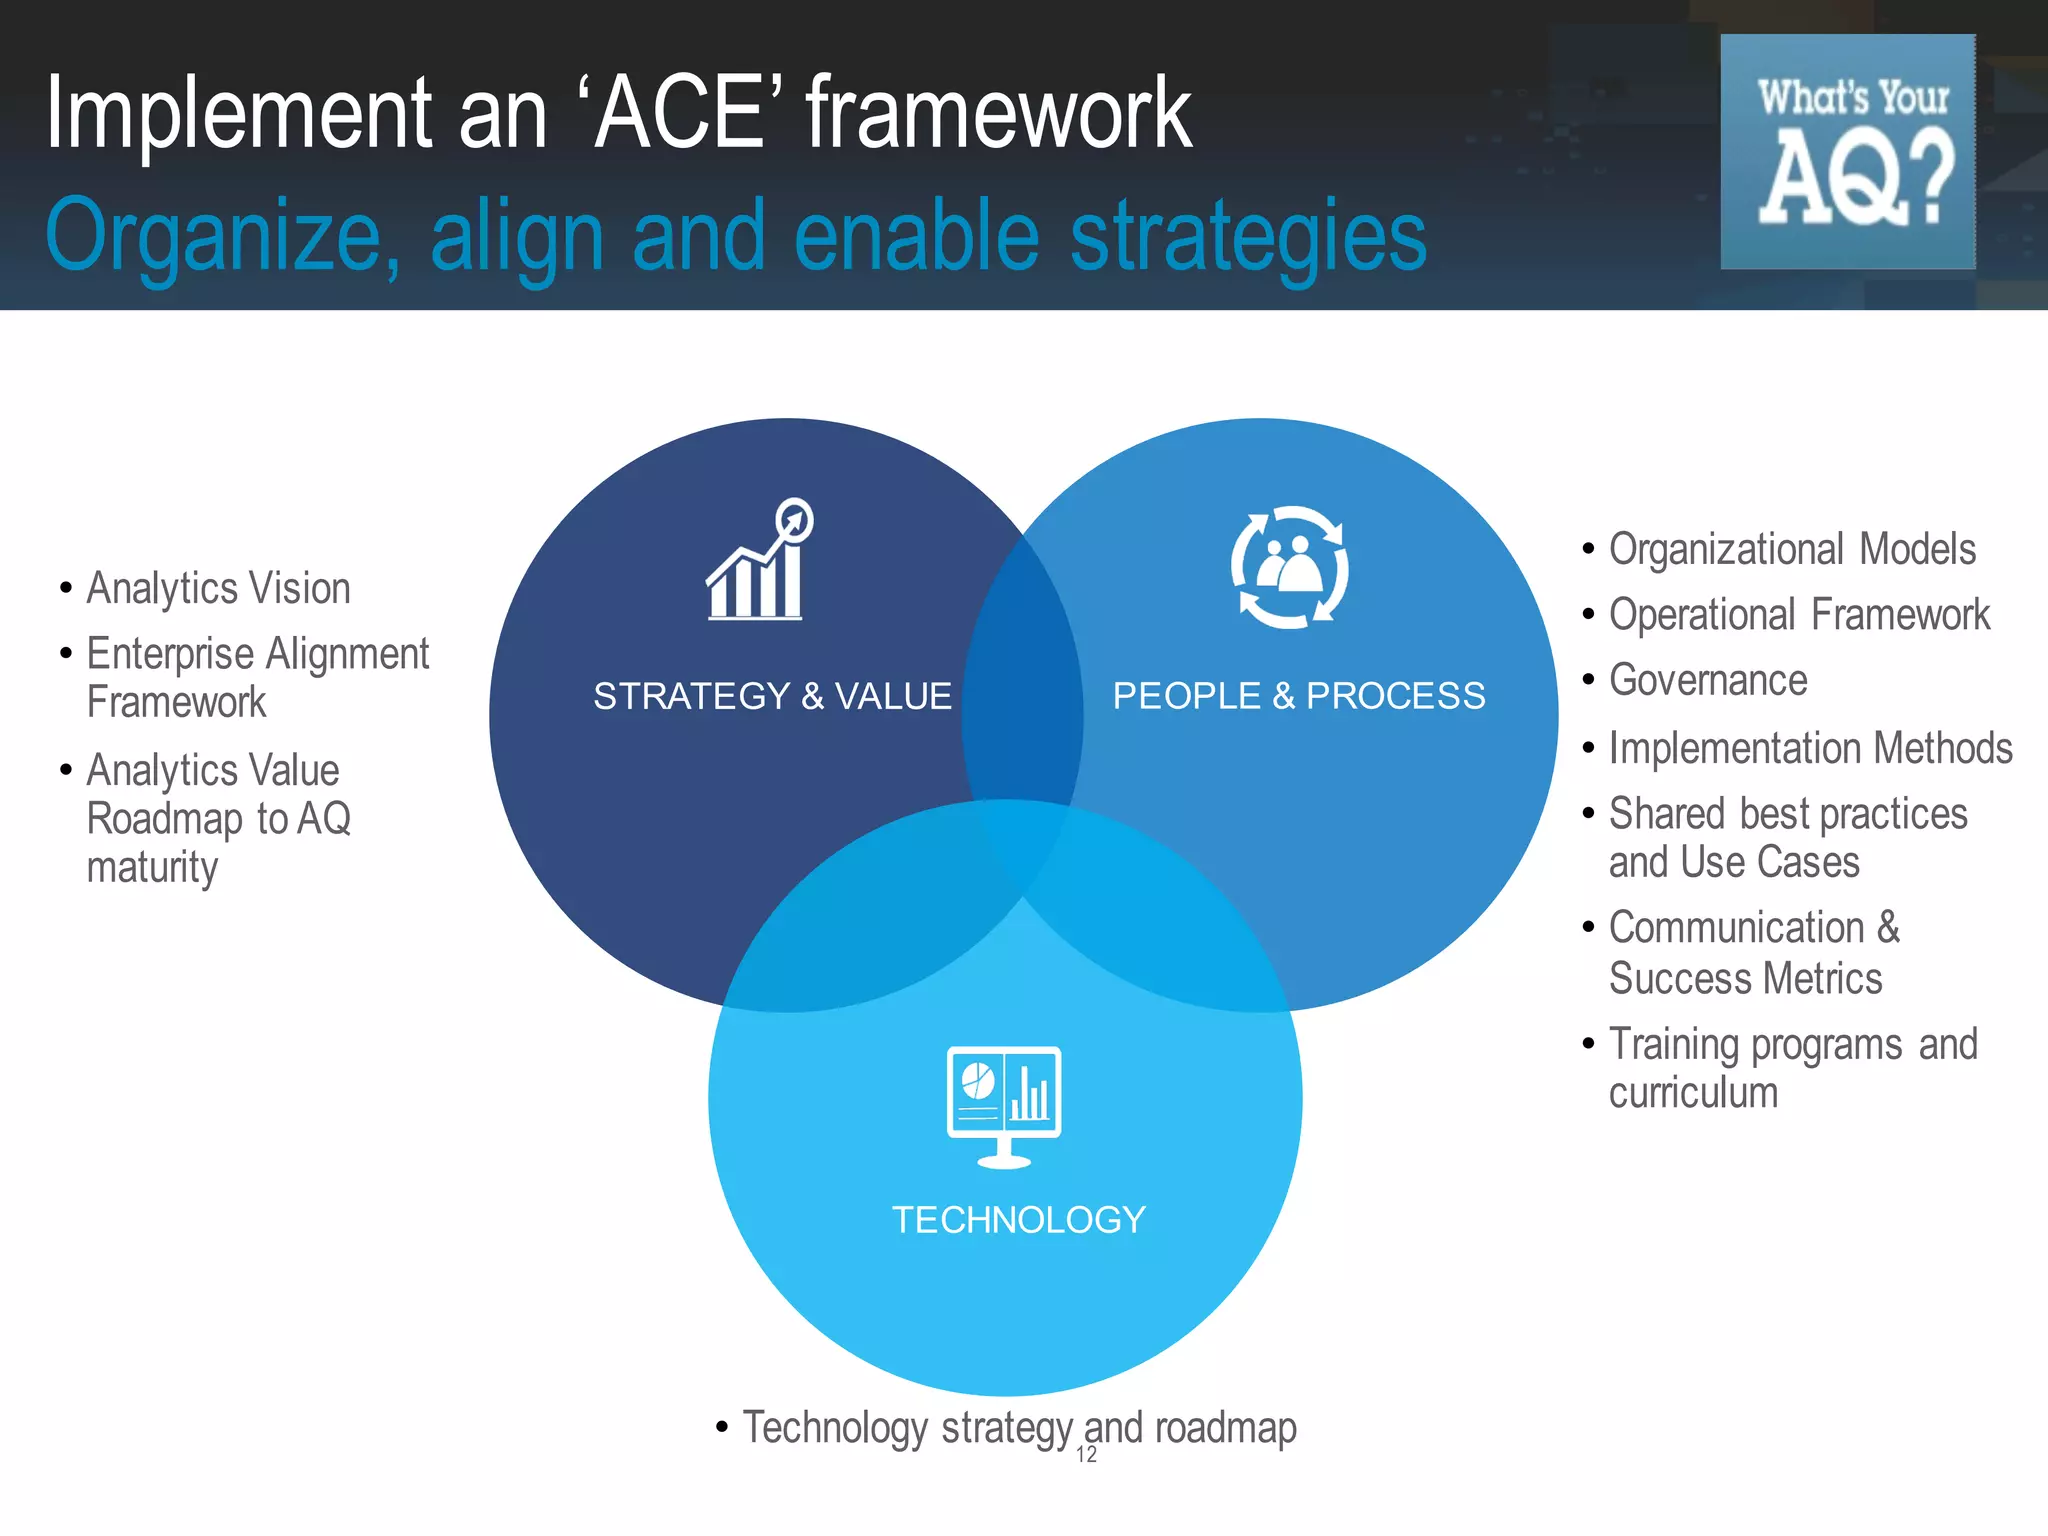
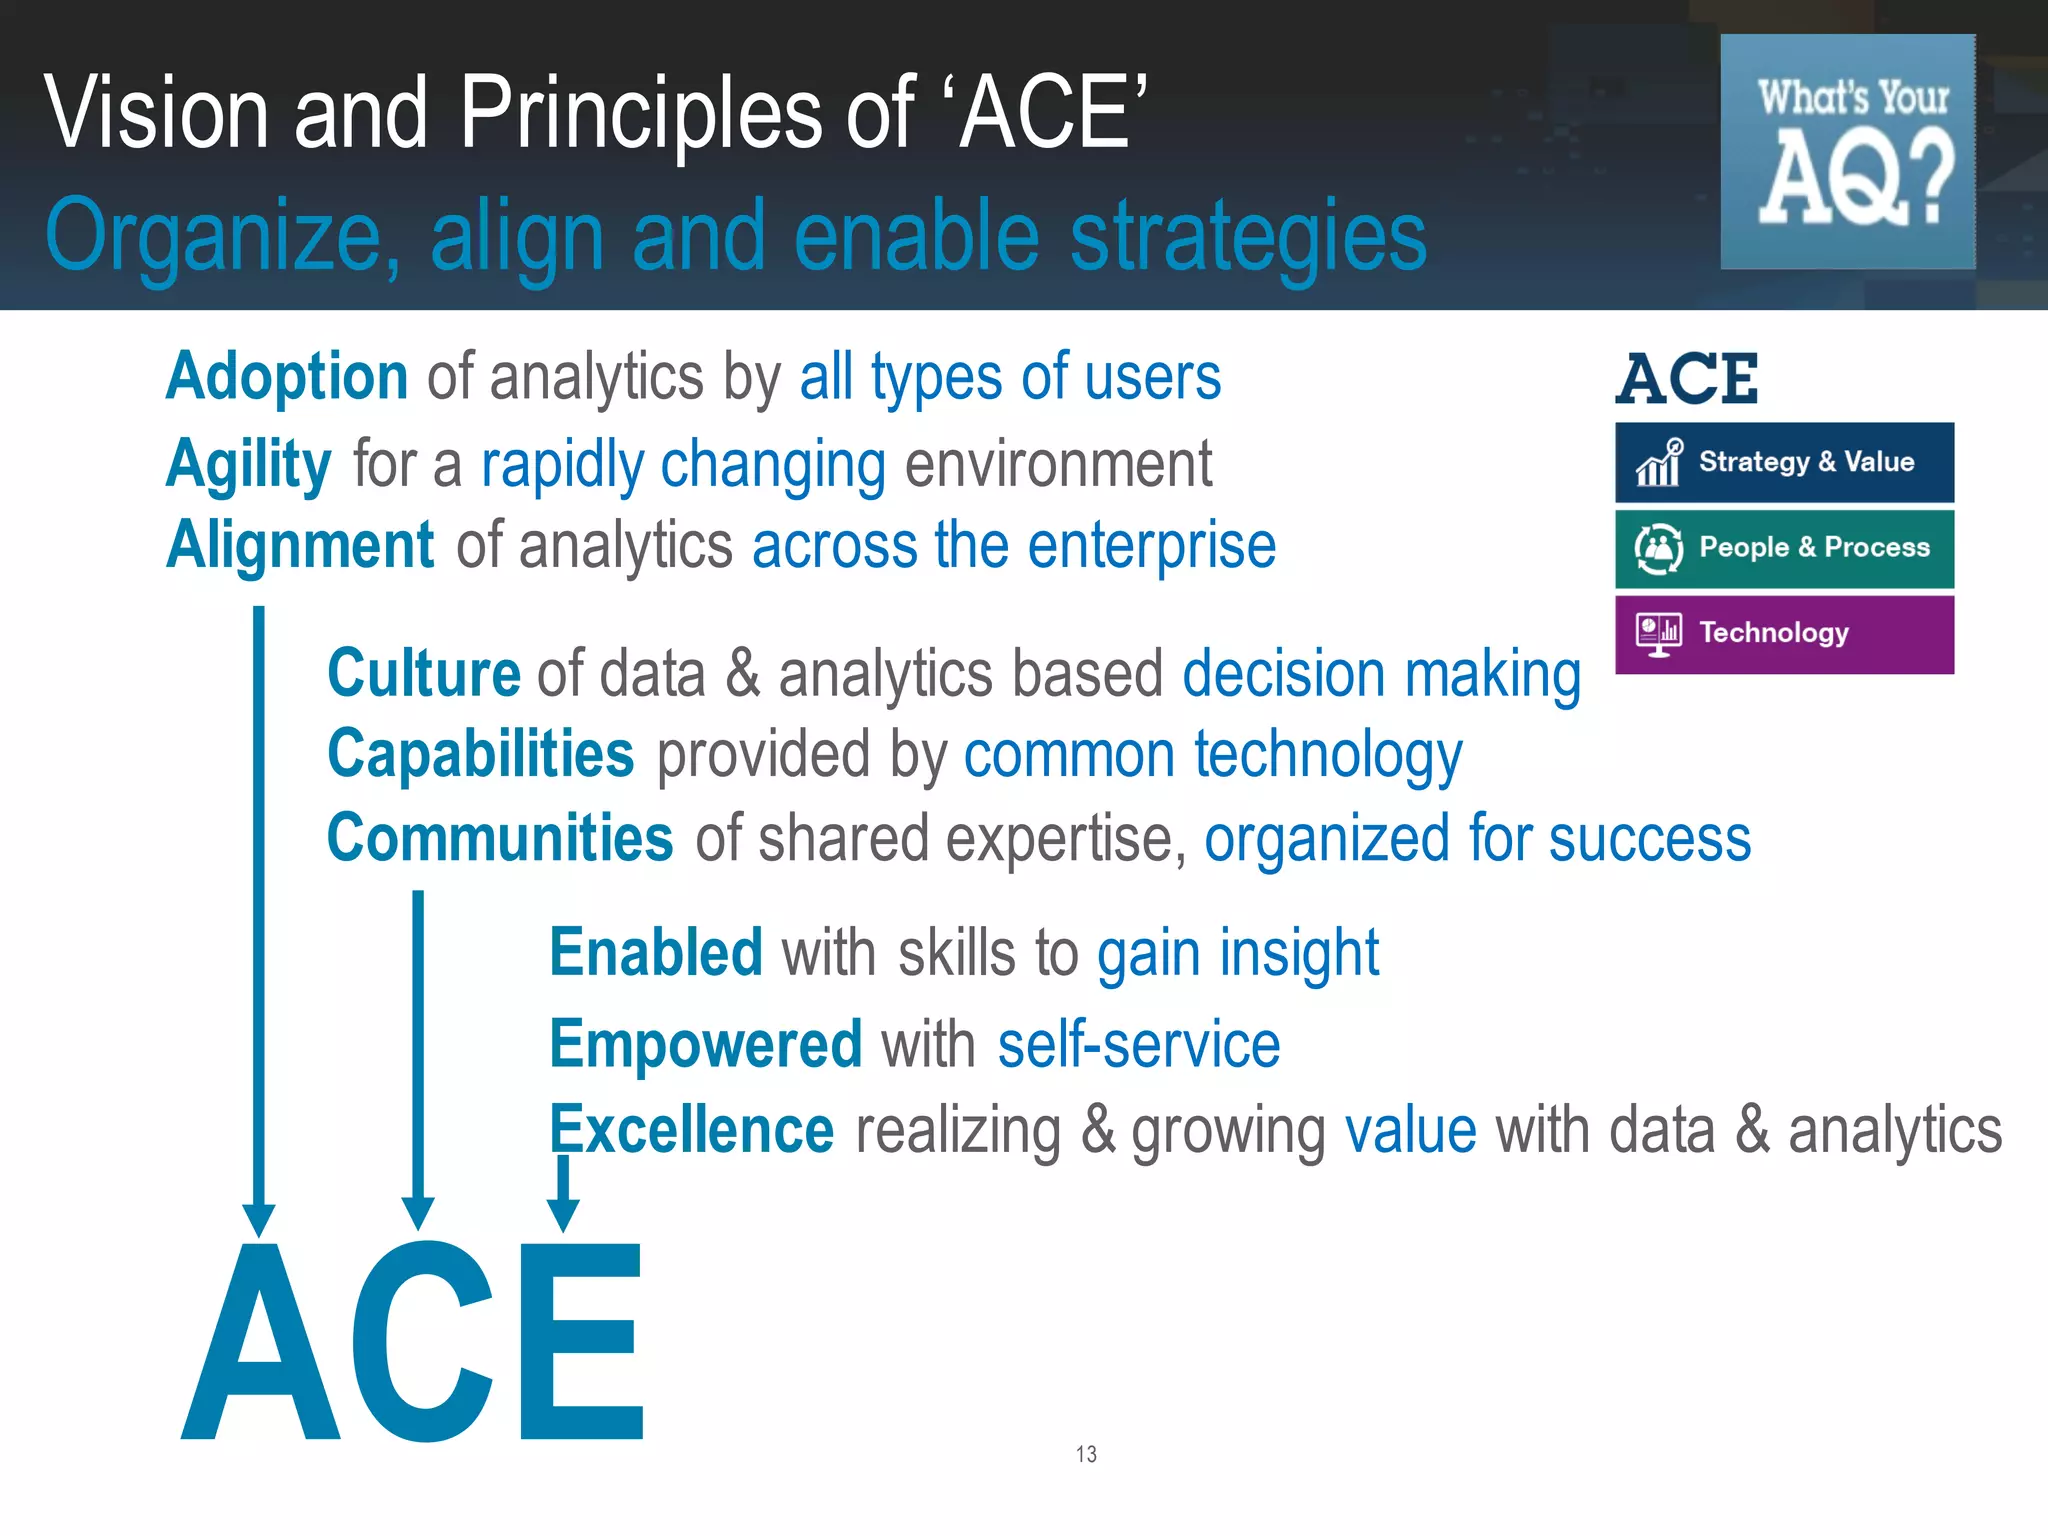
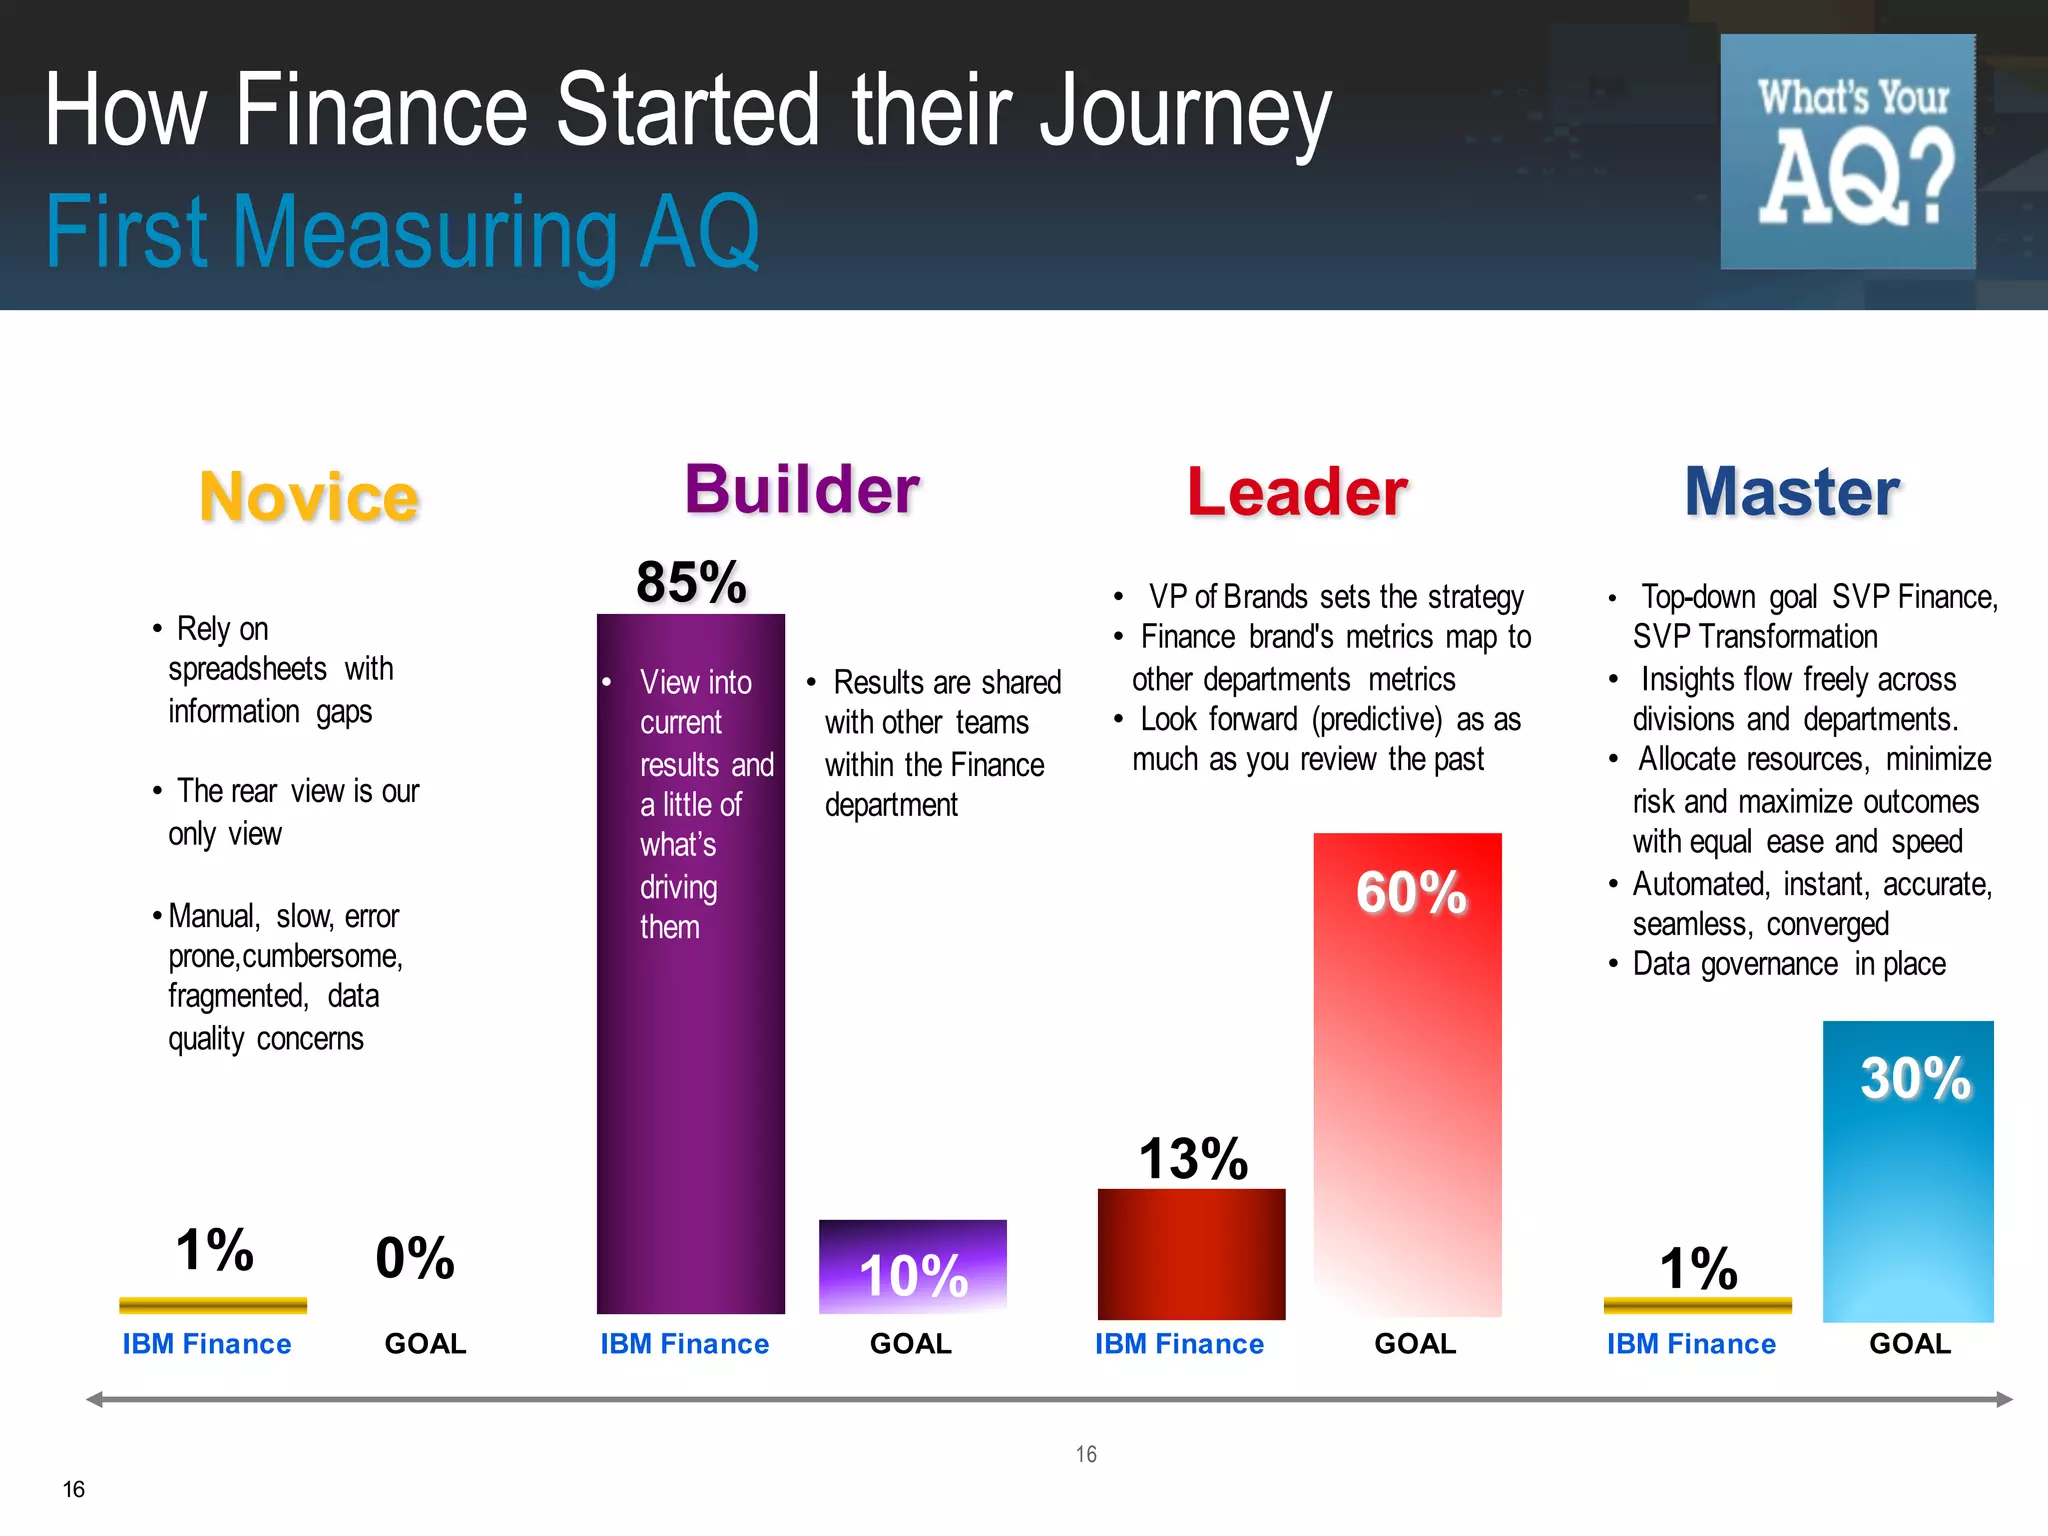
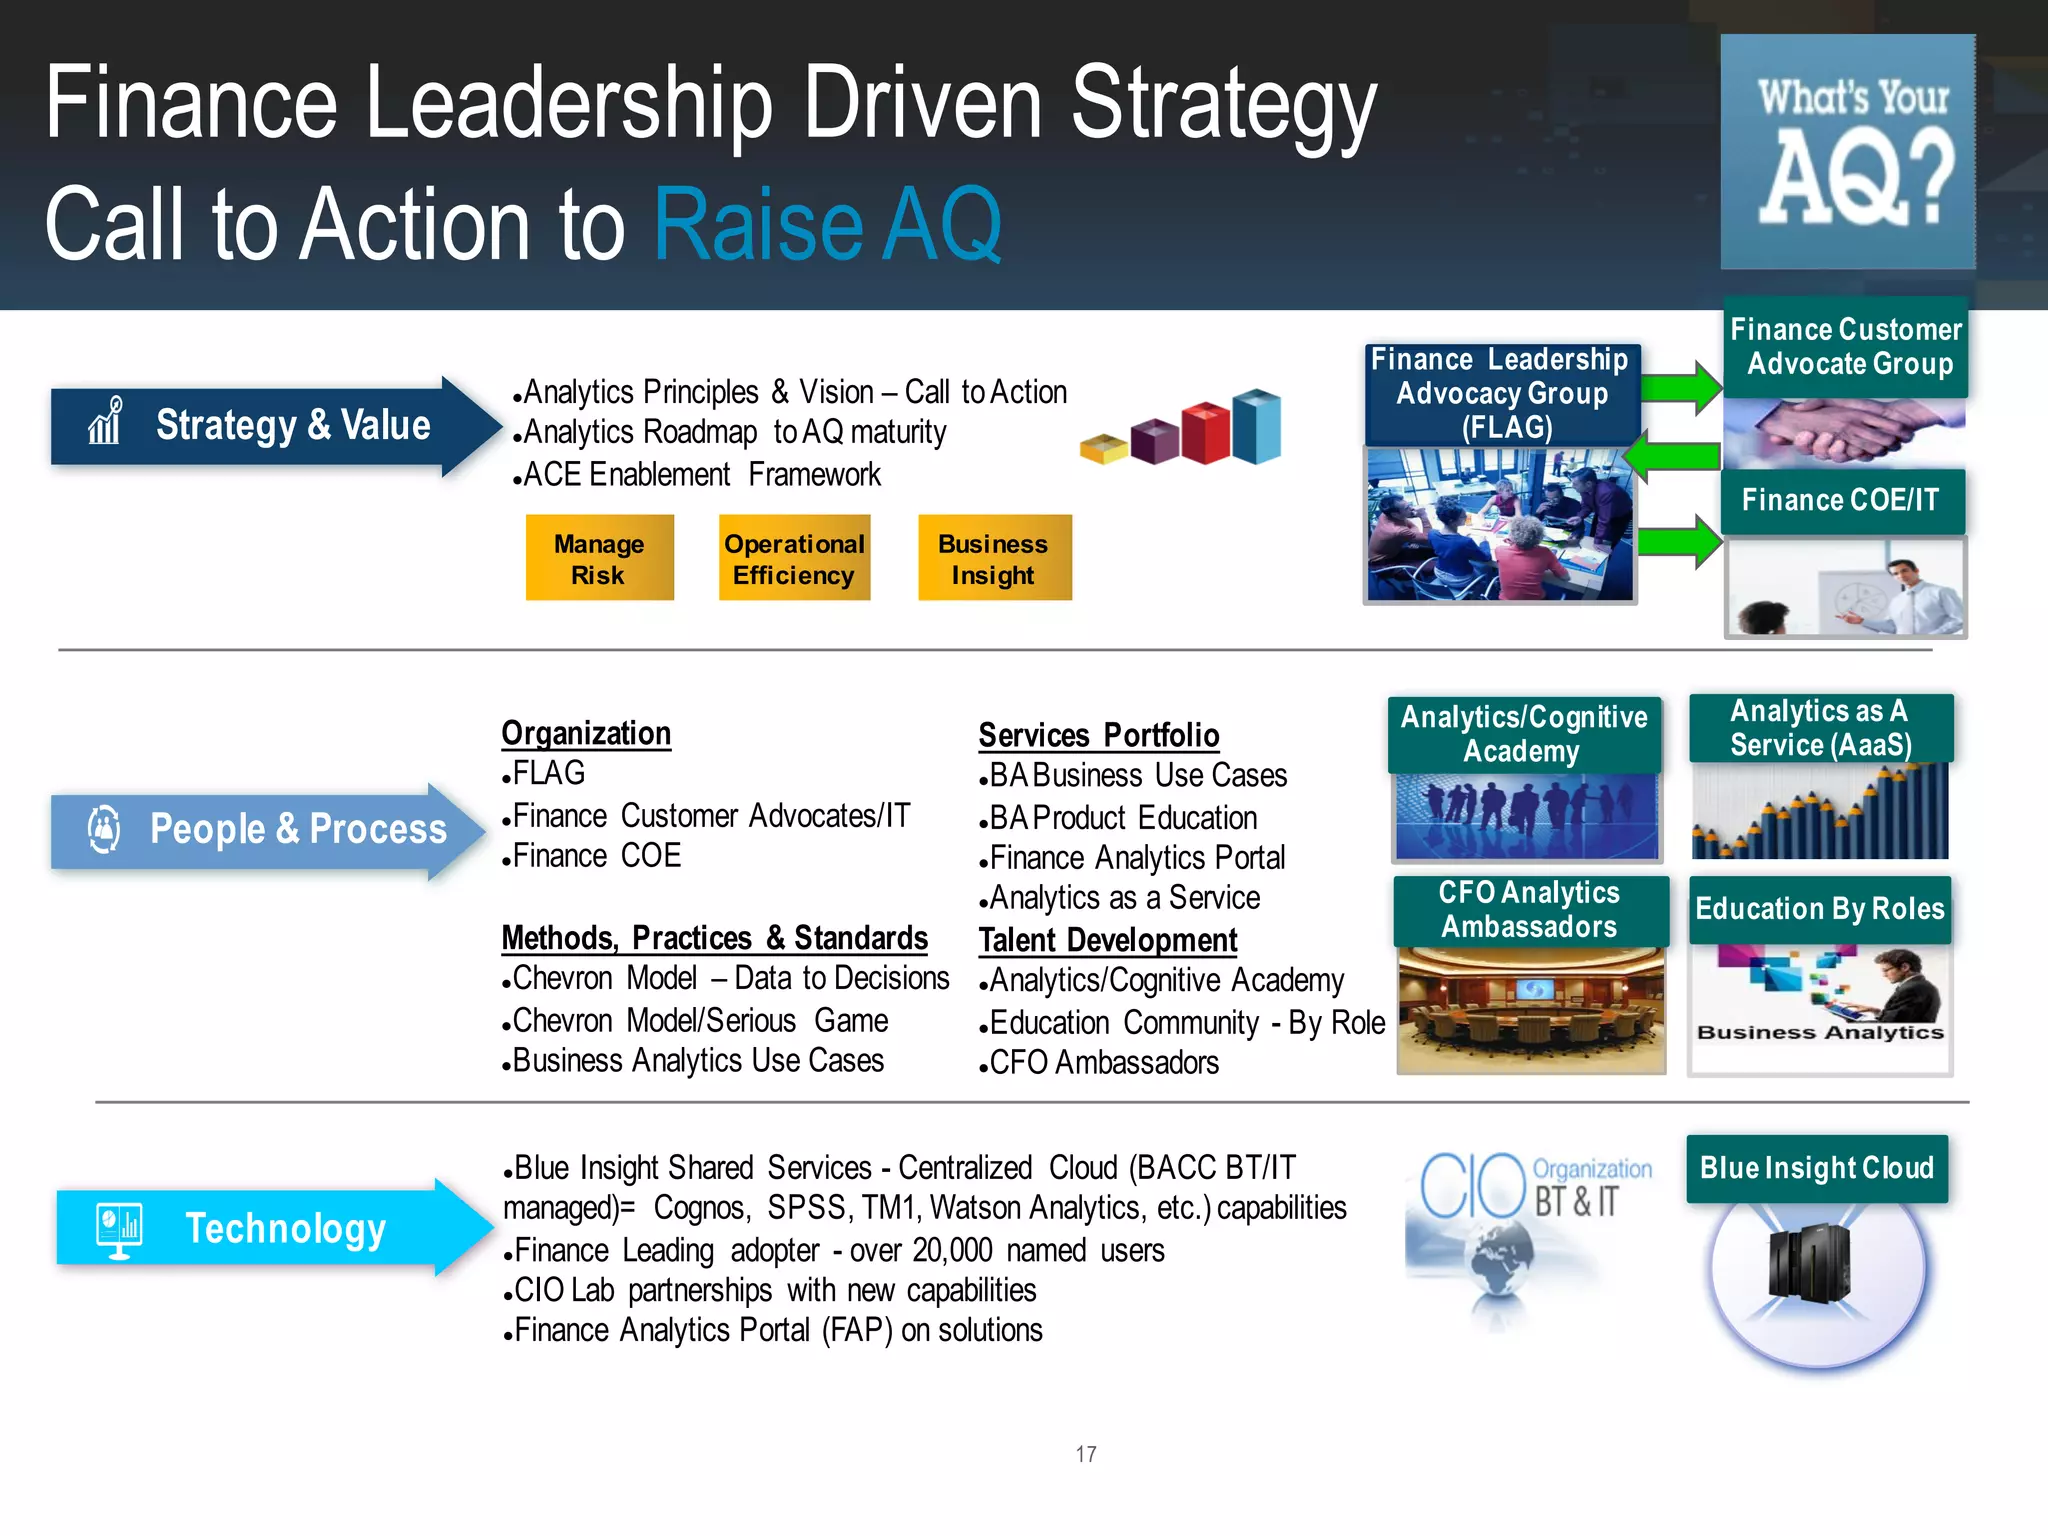
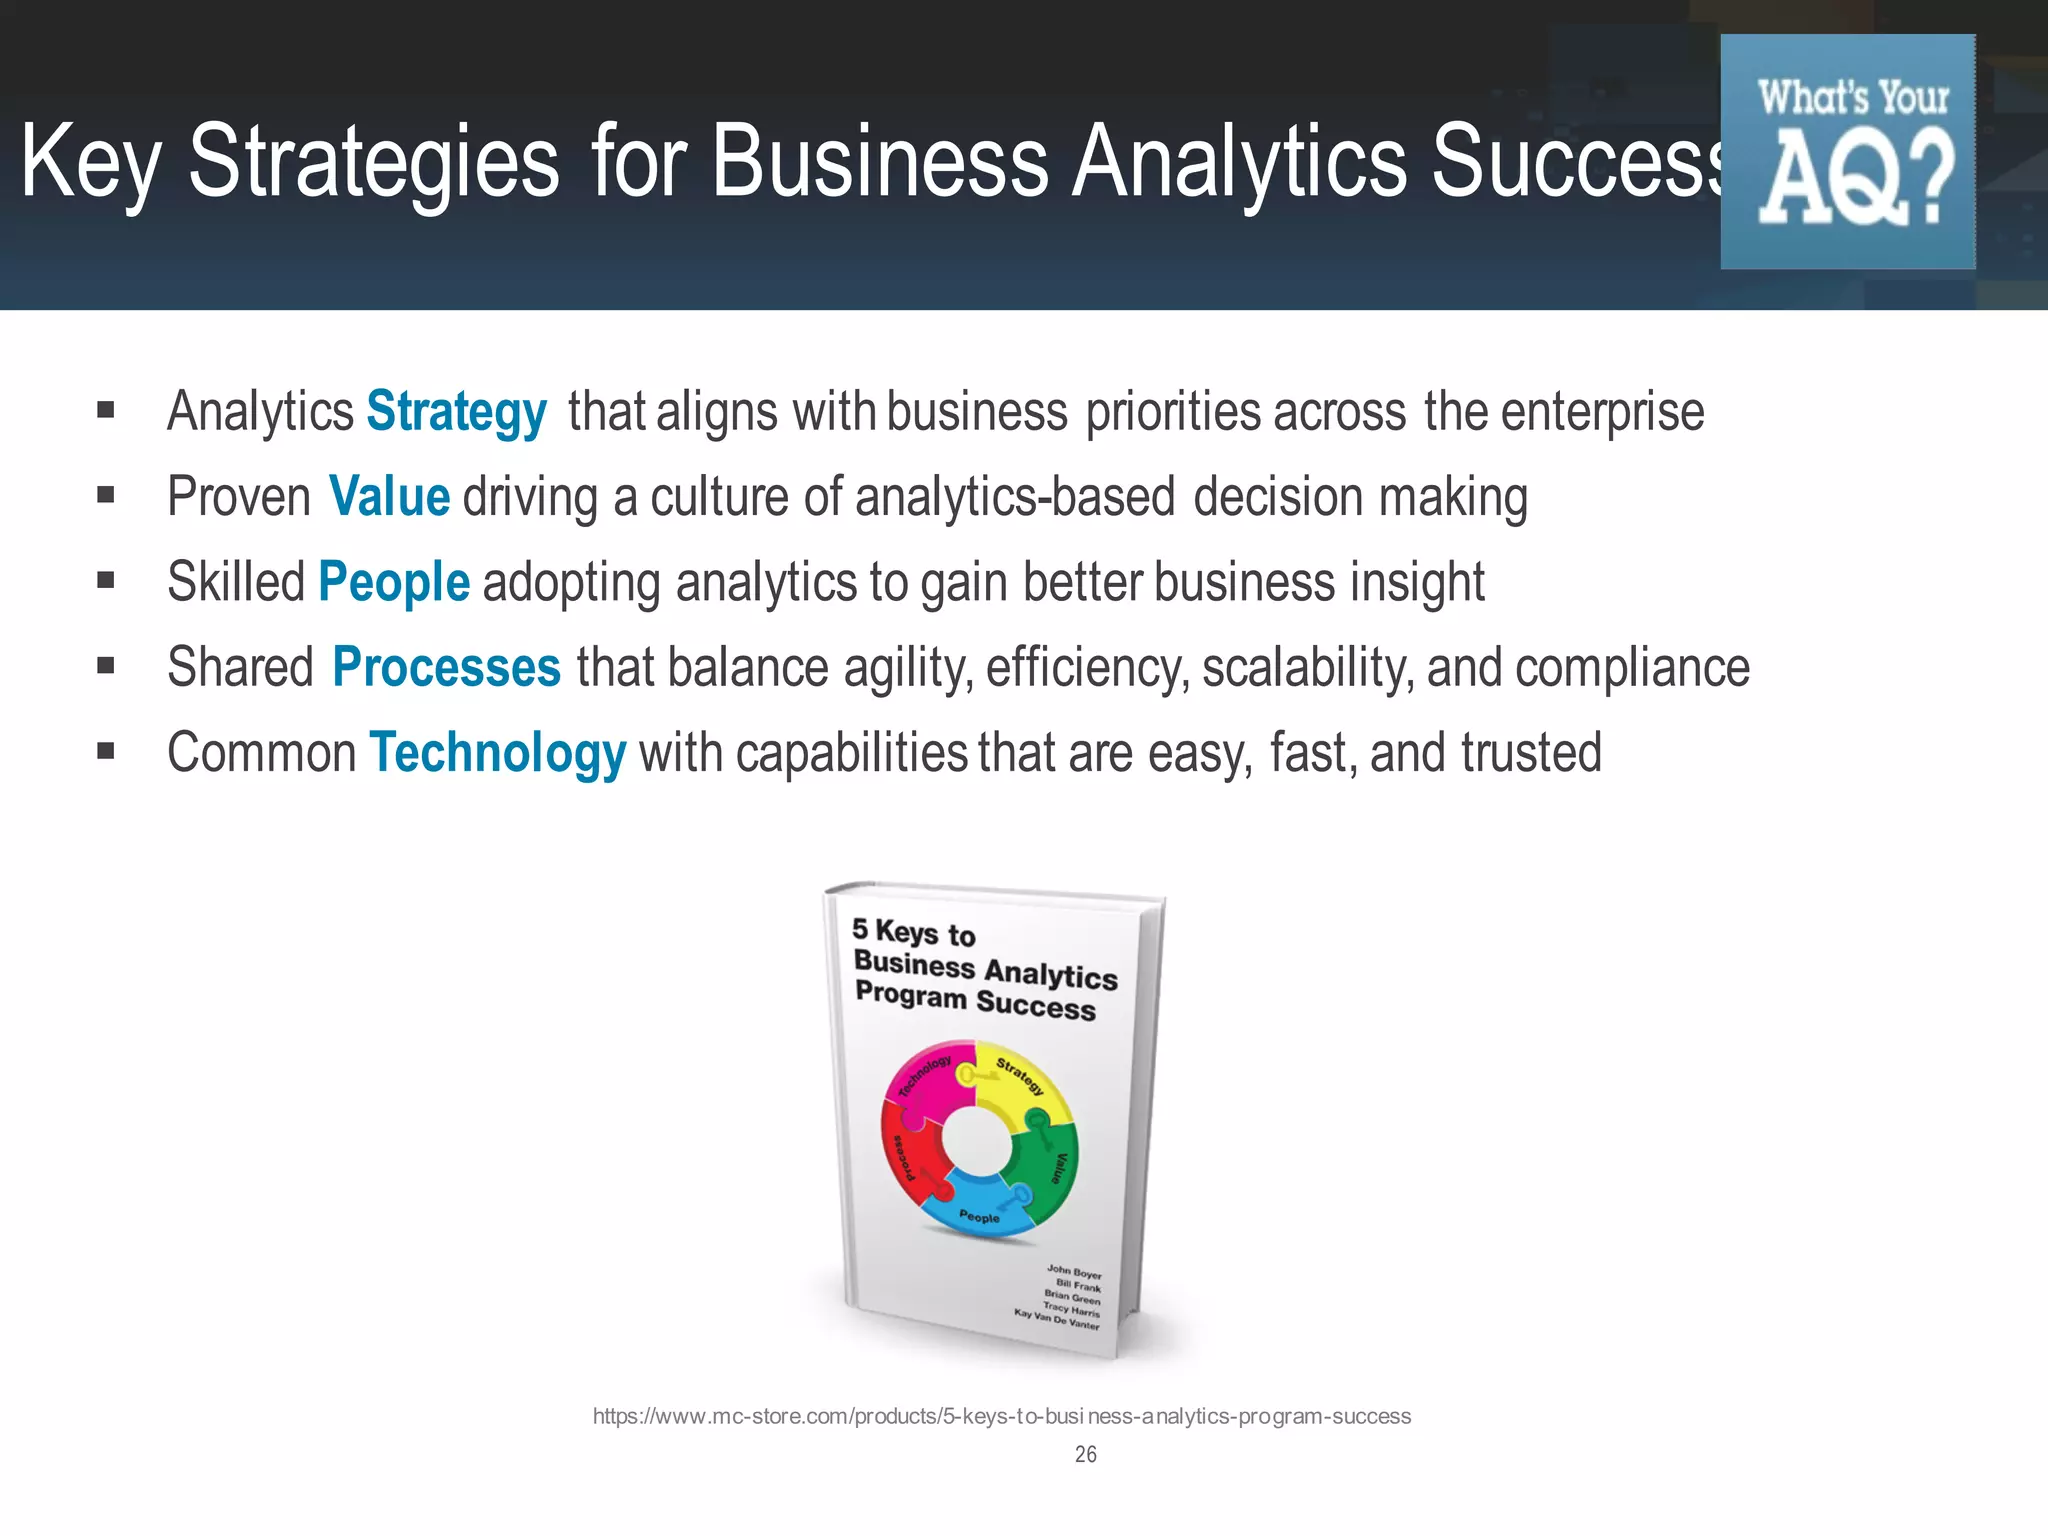
4. 4
AWARE
Alert, observant,
informed and
perceptive
FOCUSED
Clear understanding of what’s
important
AGILE
Highly responsive to
changing priorities
PREDICTIVE
Able to anticipate, look forward
and set expectations
ALIGNED
Collaboration across
organization objectives
Higher AQ Organizations Outperform
6. 6
STEP 1:
Novice
STEP 2:
Builder
STEP 4:
Master
STEP 3:
Leader
Manual, slow, error prone,
cumbersome, fragmented
Data quality concerns
Automated, instant, accurate,
seamless, converged
Data governance is in place
n = 5748 Organizations
IBM Study of AQ respondents
Where are most on their AQ Journey?
5%
65%
9%
21%
8. 8
97%
56%
6%
0%
of Masters
of Leaders
of Builders
of Novices
…. Percent of successful High AQ Organizations
that have an Analytics Center of Excellence ‘ACE’
Link to ’ACE’ Analytics Centers of Excellence
9. 9
It starts with taking our brief, 15 question AQ Quiz,
designed to assess and measure the maturity of your
current analytics footprint.
We recommend having a number of people participate
in the quiz to get a broad representation.
An AQ Maturity Score will be calculated for each
individual taking the quiz.
All individual scores need to be aggregated to learn
the organization-wide AQ Maturity Score of either,
Novice, Builder, Leader or Master.
What are the steps to get started?
Start by Measuring AQ
10. 10
STAGE 1:
Novice
•Inflexible
•Spreadsheets
•Extracts
•Manual Intervention
•Static Reports
•No governance
Builder
STAGE 2:
•Departmental
•Task automation
•Silo KPIs, metrics
•Some standards
•Some self-service
•Emerging CoEs
•Minimal governance
STAGE 3:
Leader
STAGE 4:
Master
•Enterprise aligned
•Enabling strategy through
execution
•Highly collaborative
•360 degree insights
•Analytics-driven culture
•Strong analytics program
and governance
•C-Level Leadership
(CDO/CAO appointed)
Manual, slow, error prone, cumbersome,
fragmented data quality concerns
Automated, instant, accurate, seamless,
converged Data governance is in place
Timely decision-making capabilities
Organization readiness and capacity to leverage analytics across critical roles and processes
Mastery of information
VP Lead C-Suite Driven
•Cross-functional
•Applied analytics
•Aligned KPIs, metrics
•Trusted information
•Common standard
•Formal governance
•Full self-service
•Aligned CoEs,
•Formal Leadership
DepartmentalIndividual
What does the AQ score mean?
Maps to one of four stages of maturity
11. 11
Business Alignment Strategy
Corporate objectives tied to functional objectives
Is your analytics strategy linked to your business strategy?
PEOPLE & PROCESS
Organizational/Behavioural Strategy
Organizational approach tying strategy to execution
What analytics resources, skills and processes are needed?
Technology Strategy
Technology infrastructure/capabilities
What analytics capabilities are needed to meet needs?TECHNOLOGY
STRATEGY & VALUE
How to raise AQ to the next stage?
Address Key Strategy Perspectives
12. 12
• Analytics Vision
• Enterprise Alignment
Framework
• Analytics Value
Roadmap to AQ
maturity
• Organizational Models
• Operational Framework
• Governance
• Implementation Methods
• Shared best practices
and Use Cases
• Communication &
Success Metrics
• Training programs and
curriculum
• Technology strategy and roadmap
STRATEGY & VALUE PEOPLE & PROCESS
TECHNOLOGY
Implement an ‘ACE’ framework
Organize, align and enable strategies
13. 13
ACE
Capabilities provided by common technology
Alignment of analytics across the enterprise
Excellence realizing & growing value with data & analytics
Enabled with skills to gain insight
Communities of shared expertise, organized for success
Empowered with self-service
Agility for a rapidly changing environment
Culture of data & analytics based decision making
Adoption of analytics by all types of users
Vision and Principles of ‘ACE’
Organize, align and enable strategies
16. 16
16
Novice
• Rely on
spreadsheets with
information gaps
• The rear view is our
only view
• Manual, slow, error
prone,cumbersome,
fragmented, data
quality concerns
Builder Leader Master
• View into
current
results and
a little of
what’s
driving
them
• Results are shared
with other teams
within the Finance
department
1%
• Top-down goal SVP Finance,
SVP Transformation
• Insights flow freely across
divisions and departments.
• Allocate resources, minimize
risk and maximize outcomes
with equal ease and speed
• Automated, instant, accurate,
seamless, converged
• Data governance in place
13%
85%
1%0%
• VP of Brands sets the strategy
• Finance brand's metrics map to
other departments metrics
• Look forward (predictive) as as
much as you review the past
10%
60%
30%
IBM Finance GOAL GOAL GOAL GOALIBM Finance IBM Finance IBM Finance
How Finance Started their Journey
First Measuring AQ
17. 17
Services Portfolio
BA Business Use Cases
BA Product Education
Finance Analytics Portal
Analytics as a Service
Talent Development
Analytics/Cognitive Academy
Education Community - By Role
CFO Ambassadors
Finance Customer
Advocate Group
Organization
FLAG
Finance Customer Advocates/IT
Finance COE
Methods, Practices & Standards
Chevron Model – Data to Decisions
Chevron Model/Serious Game
Business Analytics Use Cases
Blue Insight Shared Services - Centralized Cloud (BACC BT/IT
managed)= Cognos, SPSS, TM1, Watson Analytics, etc.) capabilities
Finance Leading adopter - over 20,000 named users
CIO Lab partnerships with new capabilities
Finance Analytics Portal (FAP) on solutions
Analytics Principles & Vision – Call to Action
Analytics Roadmap to AQ maturity
ACE Enablement Framework
Finance Leadership
Advocacy Group
(FLAG)
Analytics/Cognitive
Academy
Strategy & Value
People & Process
Technology
Business
Insight
Operational
Efficiency
Manage
Risk
Finance COE/IT
Analytics as A
Service (AaaS)
CFO Analytics
Ambassadors
Education By Roles
Finance Leadership Driven Strategy
Call to Action to Raise AQ
Blue Insight Cloud
18. 18
Senior Finance VP/Director members from geo brands,
Finance COE, Finance IT, Finance Customer Advocates.
Drive culture change - educate, enable and evangelize
Set the agenda & prioritize investments on AQ Framework
(Strategy/Value, People/Process & Technology)
Ensure optimal leverage of resources, tools and strategy in
satisfying financial systems requirements.
Analyze and manage portfolio, drive common systems and
standards,optimize time to value, leverage reuse
Business
Prioritization
Benefits
Realization
Communication
Culture
&
Education
Finance Leadership driven Strategy
tied to Business Value
Finance Leadership Advocacy Group Council
19. 19
IBM Finance
Analytics
Challenge
Contest
IBM Finance Education Communities -
Analytics/Cognitive Academy
IBM Finance
Analytics
Serious Game
IBM Finance Data to Business Insight Chevron Model/
Skills development by role
1 2
Finance invested in People skills/talent
Enabling Processes to deliver capabilities
IBM One Finance –
Lunch & Learn
IBM Finance Analytics
Portal Hub
CFO
Ambassadors
21. 21
Use Case: WW Spend
Simplify and standardize spending analysis processes by leveraging a single multi-
dimensional cube on a worldwide basis
18+ Spending Cubes
Consolidated
2700+ Users
Solution components:
- IBM® SPSS Modeler, Statistics
- IBM® Cognos TM1
All previous cubes used Essbase
All Spending and Resource data
for all IBM units and geographies
Challenge
Get a holistic view of worldwide spending
Solution
Create single cube for all of spending to enable
management
22. 22
Use Case: Mergers & Acquisitions
80+ Acquisitions
benefited from headlights into
execution risks to affect both
deal pricing and integration plan
Solution components:
- IBM® SPSS Modeler, Statistics
- IBM® Cognos BI
- IBM® WebSphere
End-to-End Risk
Management across the
acquisition portfolio
Streamlined tracking and
reporting to identify systemic risk
and address challenges
Challenge
Improve outcomes from mergers & acquisitions
Solution
Use analytics model to create risk profile & address risks
throughout the acquisition lifecycle.
Systematically identifies &mitigates acquisition risk by leveraging complex, disparate
data & analytics
23. 23
Challenge
Assess financial risk across many countries
Solution
Scorecard that automates information integration and
financial risk monitoring of key risk indicators
CFO
Empowered
Enabled agile decision making to
seize opportunities and mitigate
impact of risk
CFO to be value integrators
Solution Components
IBM
IBM
IBM DB2
Business Intelligence
Predictive Analytics
Use Case: Country Financial Risk Scorecard
Provides business insights into emerging risks with predictive analytics
24. 24
Heat Map with CFRS Risk Scores
<=30% > < >=54%
Risk Score Scale
Use Case: Country Financial Risk Scorecard
Benefits
Key features
100% Automated
Consistent across 160+ countries
Standardized, automated
~100 metrics
16 internal and external sources
predictive analytics
from 2006, current, future
PredictiveCurrentHistory
Understand
Risk Drivers
Assess and
Deploy Actions
Monitor Risks /
Business Outcomes
Speed
Efficiency
Identify and Predict
Increasing Risk Trends
Business Insight
GM Support
Provides business insights into emerging risks with predictive analytics
25. 25
• Becoming a High AQ Organization is a journey not a destination.
• Measure AQ to gauge your potential for analytics. Equipped with an understanding of your AQ
Maturity Model Score, your organization is now empowered to understand and map out a
smarter, collaborative analytics strategy and enablement plan.
• Raise AQ by using all forms of data, infusing analytics everywhere, empowering all people, and
all decision making. To speed up your journey, review your AQ results and implement best
practice recommendation on your analytics deployment approaches.
• Have Strong Executive Sponsorship. Lead vision for analytics, govern, develop talent and
skills, cross collaborate data, metrics and reporting infrastructure and capabilities along with
recommendation on analytics deployment approaches.
• Having a higher AQ is the foundation for a cognitive business.
• Get started on understanding your AQ. Take the AQ Quiz located in the AQ Workbook and start
mapping out your strategies today.
Key Take Away’s
26. 26
Analytics Strategy that aligns with business priorities across the enterprise
Proven Value driving a culture of analytics-based decision making
Skilled People adopting analytics to gain better business insight
Shared Processes that balance agility, efficiency, scalability, and compliance
Common Technology with capabilities that are easy, fast, and trusted
Key Strategies for Business Analytics Success
https://www.mc-store.com/products/5-keys-to-business-analytics-program-success